J
Ö N K Ö P I N GI
N T E R N A T I O N A LB
U S I N E S SS
C H O O L JÖNKÖPING UNIVERSITYJ
Ö N K Ö P I N GI
N T E R N A T I O N A LB
U S I N E S SS
C H O O L JÖNKÖPING UNIVERSITYThe Role of FDI and Openness to Trade
in Economic Growth
A study of Africa and Asia
Bachelor thesis within Economics
Author: Maria Beradović 851117-2986 Jeanette Hennix 801004-4827 Tutor: Ass. Prof. Scott Hacker
Acknowledgements
The authors would like to thank Associate Professor Scott Hacker and PhD Candidate James Dzansi for the help, guidance and support during the process of writing this thesis. January 2009, Jönköping, Sweden
Kandidatuppsats inom Nationalekonomi
Titel: Utländska Direktinvesteringar och Frihandels Påverkan på Ekonomisk Tillväxt.
Författare: Maria Beradović och Jeanette Hennix
Handledare: Ekonomie Dr. Scott Hacker och Doktorand James Dzansi Datum: Jönköping, januari 2009
Ämnesord: Utländska Direktinvesteringar, Internationell Handel, Frihandel, Ekonomisk Tillväxt, Endogen Tillväxtteori, Afrika, Asien
JEL klassifikationer: F13, N1, N15, N17, O47, P45
Sammanfattning
Ekonomisk tillväxt påverkas ur ett globaliseringsperspektiv, av två fenomen: utländska direktinvesteringar och handel. Utländska direktinvesteringar medför många positiva tillskott, som tekniska framsteg och högre nivåer av humankapital. Handel gör länder mer effektiva, då de kan fokusera sin produktion på varor där de har komparativa fördelar. Enligt David Nellor (2008) kan delar av tillväxtnivåer i sub-Sahara jämföras med grundarna av ASEAN:s under tidigt 1980-tal: Singapore, Thailand, Filippinerna, Malaysia och Indonesien.
Syftet med denna kandidatuppsats är att analysera utländska direktinvestingar och frihandels roll för att gynna ekonomisk tillväxt i Afrika och Asien. Effekten av utländska direktinvesteringar och frihandel på tillväxtnivåer i dessa två regioner är något som utelämnats i tidigare studier. Resultaten kan indikera vilken eller vilka faktor(er) är viktiga för att stimulera ekonomisk tillväxt i Afrika och Asien. Uppsatsen fokuserar på 82 länder i Afrika och Asien under åren 1999-2006. Analysen är genomförd på afrikanska och asiatiska länder tillsammans, men också för kontinentalspecifika effekter.
Resultaten visar i hög grad positiva samband mellan utländska direktinvesteringar, frihandel och dess kombinerade effekt på ekonomisk tillväxt. Resultaten är svagare än förväntat och en möjlig förklaring kan vara de komplexa samband av krafter som driver ekonomisk tillväxt, till exempel makroekonomisk stabilitet, humankapital, skatter och inflation som är utelämnande från den estimerade modellen.
Bachelor Thesis in Economics
Title: The role of FDI and Trade Openness in Economic Growth Authors: Maria Beradović and Jeanette Hennix
Tutors: Ass. Prof. Scott Hacker and Ph.D. Candidate James Dzansi Date: Jönköping, January 2009
Key words: FDI, International Trade, Trade Openness, Economic Growth, Endogenous Growth Model, Africa, Asia
JEL Classifications: F13, N1, N15, N17, O47, P45
Abstract
Economic growth from a globalisation point of view is seen as being impacted to a large extent by two phenomena – foreign direct investments (FDI) and trade. FDI brings many positive spillovers such as technological progress and increases in human capital. Trade can help improve the efficiency of production allocation in which the comparative advantage lies. According to David Nellor (2008) parts of sub-Saharan Africa today experience growth rates similar to those of the first five founding members of ASEAN in the beginning of the 1980’s: Singapore, Thailand, the Philippines, Malaysia and Indonesia. The purpose of this bachelor thesis is to analyse the role of FDI and trade openness in promoting economic growth in Africa and Asia. The contrast in how FDI and openness to trade affect growth rates in these regions in particular is something that has been left out from previous studies. It may give a hint of what factor(s) are important for Africa and Asia to focus on in order to stimulate economic growth. The effects of FDI and trade openness on economic growth are empirically tested using data on a sample of 82 countries in Africa and Asia over the years of 1999-2006. Regressions are conducted using the total sample as well as the regions separately to show on differences of the importance and effects of the explanatory variables in each of the two regions.
The regression results most often indicate a positive relationship between FDI, trade and their combined effect on economic growth. Despite this the results are weaker than expected and in general insignificant. A possible explanation for the unexpected results may be due to additional forces driving economic growth such as macroeconomic stability, human capital, taxes and inflation all of which have been left out from the estimated model.
Abbreviations
ASEAN Association of South-East Asian Nations
EP Export-Promoting
FDI Foreign Direct Investment
GDP Gross Domestic Production
GFCF Gross Fixed Capital Formation
IMF International Monetary Fund
IS Import Substitution
M&A Merger and Acquisition
MNC Multinational Corporation
NBER National Bureau of Economic Research
R&D Research and Development
TRD Trade Openness (Exports plus Imports of Goods and Services/GDP)
UNCTAD United Nations Conference on Trade and Development
UNDP United Nations Development Program
WB The World Bank
Table of Contents
1
Introduction ... 1
Purpose ... 1 Disposition... 12
Background ... 2
3
Theoretical Framework ... 4
4
Previous Research ... 6
5
Method ... 8
6
Results and Analysis ... 10
6.1 Descriptive Data ... 10
6.2 Regression results and Analysis ... 12
7
Conclusion and Suggestions for Further Research ... 16
References ... 17
Figure 1: Average annual FDI inflow in % of GDP for Africa and Asia, 1999-2006 ... 10
Figure 2: Average annual growth rate of GDP in % for Africa and Asia, 1999-2006 ... 11
Figure 3: Average trade in % of GDP for Africa and Asia, 1999-2006 ... 11
Table 1: Regression results using the 82 countries in the total sample, with GDP growth in 2004-2006 as the dependent variable ... 12
Table 2: Regression results using the 49 countries in the African sample, with GDP growth in 2004-2006 as the dependent variable ... 12
Table 3: Regression results using the 33 countries in the Asian sample, with GDP growth in 2004-2006 as the dependent variable ... 13
Appendix 1: List over included countries... 19
Appendix 2: Descriptive statistics ... 21
Appendix 3: Regression results when excluding outliers, including GFCF ... 22
Appendix 4: Regression results when including outliers, excluding GFCF ... 23
Appendix 5: Regression results when including outliers and GFCF ... 24
1
Introduction
Developing economies have become more influential in the world economy during the two last decades. The opened, dynamic and fastest-growing developing economies are considered to play a major role in a stable global economy. They attract foreign direct investments, FDI and experience high trade rates. These economies also create opportunities for the rest of the uprising developing regions, through spill over effects and increased regional trade. Today, negotiations regarding international economic agreements are not likely without involving China, India or South Africa. UNCTAD (2008a) refers to this as the “second generation of globalisation”.
From a globalisation point of view FDI and trade are often considered to be two of the most important components of economic growth in developing countries.
Parts of Asia stand as prominent examples of how sound macroeconomic policies combined with export-promoting (EP) strategies and trade liberalisation can enhance investment attractiveness and in turn boost economic growth. In some Asian countries, standards of living have risen at exceptional levels for the last six decades due to implementation of EP-strategies and increased participation in international trade. In contrast, people of many African countries have experienced very little growth, continue to suffer from poverty and are lagging behind in development. African countries have in the past protected their domestic markets and industrial production by promoting import-substituting policies. However, during the last 25 years many African economies have turned to a more liberalised trade policy which has resulted in reductions of trade barriers, an increased participation in trade and trade rates (UNCTAD, 2008a; Nellor, 2008). This at the same time as David Nellor (2008) at the IMF found that parts of sub-Saharan Africa today experience very high growth rates, similar to those of the five founding members of ASEAN: Singapore, Indonesia, Thailand, Malaysia and the Philippines in the 1980’s. Apart from this, Nellor (2008) notes that African countries’ attractiveness for foreign direct investments inflows has grown in the last few years.
Purpose
The purpose of this report is to investigate the impact of FDI, trade openness and their combined interaction on economic growth in selected countries of Africa and Asia. According to the theories presented we expect to find a positive relationship between FDI, trade and their combined effect on economic growth. The analysis is conducted using cross-section data related to a sample of 82 countries in Africa and Asia over the years of 1999-2006. This report aims at building on previous research on the role of FDI and trade openness in economic growth in Africa and Asia.
Disposition
Section two presents an overview of the recent trends of FDI, trade and growth in Africa and Asia. Section three presents relevant theories for economic growth, FDI, trade and the combined effect of the latter two on economic growth. Section four provides results from previous studies on FDI, trade and their role in economic growth. Section five presents the method used and a specification of included variables. In section six a summary of the descriptive statistics is presented followed by an analysis of the regression results. Conclusions are drawn in section seven and suggestions for further research are given.
2
Background
In a recent study conducted by David Nellor (2008) from the IMF, it is found that parts of sub-Saharan Africa, excluding South Africa, today experience growth rates similar to those of the five founding members of ASEAN: Singapore, Indonesia, Malaysia, the Philippines and Thailand, in the beginning of the 1980’s. High growth rates while at the same time not having the inflation rates that the latter countries faced make some economies of Africa, in some ways, stand on a more stable ground than ASEAN did in the 1980’s for enhancing growth. During the last two decades many African countries have worked with improving their political and financial institutions, increasing trade liberalisation policies and participated in international trade which may have contributed to the recent attraction of FDI inflow and increased growth rates. As it is argued that African countries may have better prospects of enhanced rapid growth in comparison to the South-East Asian countries in the beginning of the 1980’s, it is interesting to analyse these two regions regarding the role of FDI and openness to trade in fostering economic growth.
Foreign direct investments and trade are seen by globalisation theorists as being two of the most essential drivers of economic growth in developing countries.
United Nations Development Program defines FDI as: “an investment in a country involving a
long-term relationship and control of an enterprise by non-residents. It is the sum of equity capital, reinvestments of earnings, other long-term capital and short-term capital as shown in the balance of payments” (UNDP, 1999). FDI provides host countries with technology transfers and
knowledge spill-over effects. It adds value to foreign exchange reserves and contributes to fostering sound domestic political and financial institutions through increased managerial and organisational skills. All of these are considered important factors in fostering economic development (Todaro & Smith, 2006).
The decision of which region or location FDI should be directed to depends on whether the multinational corporation (MNC) engages in FDI due to market-seeking or cost-saving reasons. The host country’s market may offer characteristics attractive to the multinational corporation for serving it such as the size of the economy or potential growth rate. If reaching this market is the primary reason for engaging in FDI, liberal trade policies are not of as great concern although the ability for re-exporting is of some weight. When exporting goods and services, costs of transport and trade barriers arise. In order to avoid these trade costs, a multinational firm may outsource its production to serve the market from a closer distance. In order to reduce costs of production, a MNC may look for destinations endowed with labour or that offer cheap natural resources (Markusen, 1984). The host country’s market may be small or not the one targeted, but liberal trade policies become important since firms need to re-export to other markets in order for the overseas production to be profitable.
The phenomenon of FDI has grown tremendously since the 1970’s. Navaretti and Venables (2004) report that over a time period ranging from 1986-99, real world FDI grew by a staggering 17.7%. In 2007, UNCTAD reported an all time record in investments when FDI inflows rose by 30% to $1,833 billion despite the start of the financial crisis. The effects of the crisis are expected to be noticed as a decline in 2008-year’s flows (UNCTAD homepage, 2008a). This upward trend of FDI is reflected in increased rates of FDI inflow in all major economic groups; developing economies, developed economies and the transition economies (UNCTAD homepage, 2007).
The growth of FDI and enlarged global manufacture is related to the strong economic performance and increased income of several nations participating in the global economy. Moreover, high commodity prices, increased trade liberalisation, the development of financial markets, and an increased activity of cross border mergers and acquisitions (M&A) taking place in the last years are other factors underlying the intensification of FDI (UNCTAD homepage, 2007). Africa, endowed with natural resources has been attracting FDI because of high commodity prices in oil and minerals and increased demand for merchandise on the world market. FDI inflow to Africa in 2006 hit a new record and was mainly located to the West, North and Central regions, regions rich in natural resources. FDI inflows in Africa as a percentage of the regions’ gross fixed capital formation (GFCF) increased from 18% in 2005 to 20% in 2006. A large share of FDI going to developing regions is invested in Asia which through financial and political reforms has created incentives for MNC’s to invest in the region. Asia hit a peak in 2006 with an FDI inflow-increase of 19% in comparison to 2005. FDI inflow to the Asian region was further attracted to the developed financial institutions, research and development (R&D) and service related activities (UNCTAD homepage, 2007).
International trade contributes towards reallocating production of goods and services to countries that have a comparative advantage in producing them. International trade theory is used to explain why nations trade, the patterns of liberal international trade, international specialisation and income distribution due to the differences among nations. So why do nations trade? According to the Ricardian trade theory, trade patterns are predicted through differences in comparative advantage in labour productivity (Krugman & Obstfeld, 2003). However, it is not only in labour productivity that nations around the world differ: Comparative advantage can lie in the levels of human capital, the ability to attract FDI thanks to stable political institutions, trade openness, resource endowments, and capital to mention a few economic and non-economic variables. Due to these comparative advantages that exist between countries incentives for international trade emerge.
The rate of trade has increased dramatically during the two last decades. One reason is developing countries’ increased participation in world trade and the lowering of trade costs. The dynamic economic growth in developing economies in recent years has been enthused by an expanded export growth, in which the Asian region is a strong leader. In 2006, exports between developing countries and the rest of the world accounted for approximately 40% of total world exports. This growth in the export sector is a consequence of the increased demand for natural resources, goods and services in developing countries driven by rapid economic growth, especially in Asia. Another explanation for this increase in growth of exports is the demand for new markets which become available when countries open up for trade. During 1995-2006 Asia’s import increased with 130% while Africa’s real export and import sector increased by 80% and 100% respectively (UNCTAD homepage, 2008a).
UNCTAD (homepage, 2008a) research on GDP growth, estimates that during 1998-2002, developing countries grew at an annual real rate of 3.6% while GDP in Asia and Africa expanded at 4.8% and 3.3% respectively. By comparison during the period from 2003 to 2007, developing economies experienced an annual real GDP growth rate of 6.6%. Asia’s GDP grew by 7.5% while Africa expanded by 5.4% during the same time period. This growth rate may be explained by the approach to a more broad-based economic expansion, which in turn has attracted investors and encouraged trade, and increased trade openness within developed and developing economies. According to UNCTAD (homepage, 2008a), all developing regions have benefitted from this growth in GDP but at different rates.
3
Theoretical Framework
Classical growth theorists such as Robert Solow identify the main driver of economic growth as existing outside or exogenously from the growth-model. In comparison to this – the endogenous growth theorists see the drivers of growth as an endogenous result of channels through which, in their case, the rate of technological progress is influenced by economic factors. The basic idea is that through innovation – products, processes and markets are developed and new ones appear which as a matter of fact are the result of economic activities. Productivity and efficiency can be increased through savings and investments in human capital, R&D and knowledge-intensive industries. Theories of endogenous growth propose governments to take a more active role in promoting economic growth through investments in human capital and new technological knowledge in industries such as computer software and telecommunications. It is recognised that economic policies concerning trade, education systems, fiscal policies, competition and intellectual property rights influence the extent to which innovation is promoted through cost and benefits of engaging in R&D (de Mello, 1997; Howitt, 2008).
Multinational corporations may choose international production instead of exports if seeking either market or cost benefits. Cost-seekers are attracted by resources unique to the host country but its market is not necessarily the one targeted. Therefore, the country’s trade policies are of importance if the firm is to be able to re-sell products to other markets. Market-seeking reasons imply that reaching the new market is the main reason for abroad production together with the presence of these unique or cheap resources, not the ability to re-sell to the same extent. John H. Dunning’s Eclectic Paradigm, or OLI-framework, suggests reasons for MNCs to engage in international production (1980; 2001). The most important advantage for the purpose of this report concerns location. Location-specific advantages (L) are available for use for all firms, are unique to a location and may only be used in this location. It may include the business environment, laws and regulations, unique resources, different kinds of labour, and economic policies which may offer favourable reasons to produce internationally as opposed to exporting.
The importance of the location-specific advantage does not imply that the other two advantages are to be forgotten; Ownership advantages (O) are productivity differences from mobile intangible assets of the parent company. It may for example be organisational advantages or technology unique for the individual company but also includes patents, trademarks and brand names. Ownership advantages are related to and may stem from location advantages. John H. Dunning (1980, p.10) himself writes “many of today’s ownership advantages of firms are a reflection of yesterday’s location advantages of countries”. Internalisation advantages (I) relate to the manner in which firms generate and make use of resources and capabilities at hand and those available in other locations of production. A firm may internalise capital, technology and management skills instead of for example licensing out activities. The effectiveness of the foreign direct investments depends on the extent to which MNCs are able to capitalise on one or more of these advantages (Dunning, 1980; 2001).
Balasubramanyam, Salisu and Sapsford (1996) consider FDI to be an important source for the transfer of technology and know-how to developing countries. There are clear differences in trade patterns where developed countries export high-skilled products whereas developing countries export low-skill goods. This gap is considered to be bridged through FDI and the transfers in know-how and technology. The positive spillover-effects not only enable low-skilled labourers to learn-by-doing or through education but at higher
levels provide learning in new, more efficient managerial styles. It is also believed that competitor firms may learn-by-watching and hence the environment of commercial activities will grow in complexity, a major reason why endogenous growth theory sees FDI as an important factor in fostering long-term growth (Balasubramanyam et al., 1996; de Mello, 1997).
Markusen (1984) connects FDI to trade as he introduces trade costs into the picture of why firms engage in FDI activities in the first place. These costs include transport costs or other costs from barriers such as tariffs, quotas or simply limited accessibility of reaching the market of interest. Such costs can be overcome through a firm replicating itself in the host country to more easily serve the market and avoid the costs of exporting, a type of FDI known as horizontal FDI (in Bloningen, 2008).
The governments of some economies are able to pursue appropriate trade policies in order to take advantage of the benefits from trade, different comparative advantages in productivity lead the way for international trade. These benefits can be re-allocated in the economy in order to attract FDI, invest in R&D and human capital in order to stimulate future economic growth. If sound political institutions are put in place it is more likely that the people in the country will have a share of the gains from trade. Countries that lack stable political and financial institutions are most likely not able to attract FDI, develop trade strategies or distribute the trade benefits to its people (Anderson, 2008). Continuing on this, David Dollar (2001) states that openness to international trade accelerates growth which is supported by Todaro & Smith (2006); Export-promoting (EP) trade policies are used to encourage international trade; such as free movement of capital, transfer of knowledge and enterprises. They are used to attract multinational corporations and recognised for using open systems of communications (Todaro & Smith, 2006). Through export oriented policies a government encourages and supports increasing international trade by bilateral trade agreements as reduced tariff barriers. By the creation of incentives such as tax-relief, they can attract international firms to set up their production or place its headquarters in a certain region (Todaro & Smith, 2006).
Bhagwati (1978) argues that countries promoting EP-strategies are likely not only to attract a higher amount of inward FDI but also to make more efficient use of the positive spillovers from FDI and benefit from them more than an import-substituting, IS, country would. It is stated that while countries with EP-strategies may attract FDI-engaging firms through both unique localisation parameters and open policies making it easy to also serve other markets, the only thing IS-countries can use to attract MNCs are the localisation factors (Balasubramanyam et al., 1996). FDI is believed to be far more growth enhancing in the long run in countries with EP-strategies which shows a link between trade regimes, FDI and long-run growth (de Mello, 1997).
4
Previous Research
Shiva S. Makki and Agapi Somwaru (2004) noticed that although past studies showed that trade, FDI and their combined interaction are positively related with economic growth, the magnitude varied to a great extent with respect to aspects such as human capital, investment and trade policies. The article focused on the interaction between FDI, trade and economic growth on 66 countries over three decades. Their results showed that apart from FDI and trade, human capital and domestic investment are important sources for economic growth. Further, the strong positive correlation between trade and FDI in promoting economic growth was enhanced if a country had sound macroeconomic policies and institutional stability. Host countries benefitted positively from the impact FDI and trade had on domestic investment. The article implied that FDI is quite heavily influenced by the monetary, fiscal and open-market policies of the host country. They further found that decreasing the inflation rate, tax burden or government consumption enhanced economic growth. These actions will result in more stable macroeconomic policies, more profitable investments and more money being available for investments.
The empirical impacts of FDI on growth reported by some researchers (de Mello, 1997; Borensztein et al., 1998; Bloningen, 2008) are not as straightforward and obvious as it is in theory. There are quite clearly issues concerning endogeneity from the complex factors influencing what drives growth as political stability, taxes, macroeconomic stability and rule of law to merely mention some. For example, FDI may itself be influenced by innovations in other areas driving growth rates. Borensztein et al. (1998) found that FDI is more productive in host countries with a certain threshold of human capital and that investigating FDI together with human capital does indeed have a positive effect on per capita GDP growth-rates. The more developed the host country is, the greater the level of stock of initial human capital and efficiency of production and the greater the impact on long-term economic growth-rates. Workers must be trained and educated enough and inputs must satisfy certain minimum quality standards to make use of technological transfers and investments in the most efficient manner possible. Researchers stress the fact that due to this, capital augmentation rather than human capital accumulation is the probable outcome of FDI (de Mello, 1997; Borensztein, et al., 1998).
Balasubramanyam, Salisu and Sapsford (1996) tested Bagwhati’s (1978) hypothesis regarding the notion that EP-countries will both attract and make more efficient use out of the inward FDI than will a country adopting import-substituting policies. Balasubramanyam et al., (1996) divided their research with regards to the two policy-strategies Bagwhati pointed to and created two hypotheses to test. The first was to test the volume of FDI attracted with relation to whether being an EP or IS country, the second regarding the effects of FDI on growth in EP relative to IS nations. FDI was added as an endogenous variable in the production function created in addition to labour and capital to include the positive spillover-effects on technology and human capital. Exports were added as a measure of how the new technology is used and its elimination of foreign exchange constraints. Exports further provide increased access to international markets. EP strategies are neutral (as assumed) hence it will show the effects of economies of scale, capacity-utilisation and decreases in capital-output ratios.
The findings of Balasubramanyam, Salisu and Sapsford were quite what were expected by the researchers: a strong support for Bagwhati’s hypothesis in addition to FDI being a strong driving force for growth in EP nations, on the contrary to the inexistent influence on growth in IS-countries. Countries able to attract large amounts of FDI while at the same
time providing firms with the possibility to easily re-export will increase productivity efficiency and human capital and experience technological progress which among other things helps to increase GDP growth-rates.
The empirical findings of Krueger (1998), Stiglitz (1998) and Dollar (1992) suggest that export oriented policies, external openness and integration in the world economy are some of the key indicators associated with enhanced economic growth. Their findings provide evidence for correlation between liberalised trade policies and growth. However, these and other empirical studies in this area have been questioned by Rodriguez and Rodrik (2000) who are sceptical to the assumption of correlation between trade openness and growth. Bhagwati and Srinivasan (1999) contradicts their findings and argues that "the most compelling evidence on this issue can come only from careful case studies of policy regimes of individual entries such as those of OECD, NBER and the World Bank. It concludes that the virtues of openness established in these nuanced in-depth studies remain unrefuted."(Bhagwati & Srinivasan, 1999, p. 2).
Dollar and Kraay (2004) found that developing countries participating in the global economy experienced accelerated growth and were catching up with the developed nations. While countries not fully participating in the globalisation process lagged behind in terms of economic growth. Their empirical analysis further provides evidence of a strong positive relationship between changes in the quantity of trade and growth rates.
Anne Krueger (1998) argues for the fact that trade strategies and development strategies are interrelated. Her findings support the view of that trade liberalisation is linked with high growth rates. Krueger further claims that there are always benefits from trade liberalisation when in combination with an export oriented strategy and lower trade barriers. In addition to Krueger, UNCTAD (homepage, 2008a) points to previous research which supports the economic theory of a close relationship between an increased export sector and growth in GDP. It is noted however, that even though trade and GDP are closely related, the interconnection may differ significantly according to the behaviour of other economic and non-economic factors within in a country.
Leading up to here, the logic behind the included explanatory variables, FDI and trade openness, in the study by Makki and Somwaru (2004) is clearer. This report takes on a similar approach as they do in their 2004 article, i.e. investigate how FDI, trade openness and the combination and reinforcement of these affect economic growth (changes in GDP). Makki and Somwaru (2004) included 66 developing countries and hence did not investigate regional differences or specify what regions were to be included in the analysis as is done here. The focus on Africa and Asia as separate regions and together is particularly interesting to shed light on after Nellor’s (2008) article about the high growth rates and recent increased investment rates experienced by some African countries, very much similar to those of ASEAN-countries in the 1980’s. Through comparing the regions separately one is able to tell if trade openness and FDI are of the same importance for fostering economic growth in the two regions. The hope is to find implications of what impact further trade openness and foreign direct investments inflow will have on continuous growth in Africa and great parts of Asia.
5
Method
The analysis in this paper is conducted on data of 82 countries, 49 African and 33 Asian, in which two time periods are indentified; t-1 for 1999-2003 and t for 2004-2006. To explain growth in period t, the authors use explanatory variables for which the data used is that from period t-1. The authors do this since it is believed not to be very likely that the economy is affected by changes in the dependent variable the same year. Due to the Asian financial crisis at the end of the 1990’s the authors chose to initiate the data collection from 1999 in order to avoid potential bias in GDP for Asia in the closest years to the crisis. 2006 was chosen as the ending year as more recent data for 2007 was missing for many countries. The regressions are conducted not only on the total sample of 82 countries but also on Africa and Asia separately to compare and contrast the magnitude of the effects and the importance of each variable on growth rates. It might be revealed that a particular variable plays a greater role for changes in GDP in one of the regions than in the other. The regressions were initially run with data based on 84 African and Asian economies. However, as obtained results were very weak a partial correlation plot was conducted to look for outliers that could bias the results. It was revealed that Liberia and Lebanon were two major outliers in FDI and were hence removed from the main regressions. For readers interested, partial correlation plots including the outliers are provided in Appendix 5. Data on the annual average growth rate of GDP, FDI, and gross fixed capital formation as percentage of GDP were collected from UNCTAD Handbook of Statistics 2008 (UNCTAD homepage, 2008b). The UNCTAD Handbook of Statistics 2008 lacked the data for the standard measure of openness to trade, exports plus imports of goods and services as percent of GDP; this was instead retrieved from World Development Indicators 2007 (The World Bank, 2007). Quality or existence of data suffers in countries which are war-torn, experience civil strife or simply are underdeveloped. The availability and quality of estimates may be limited even though taken from reliable sources as UNCTAD and World Development Indicators (WDI). Sufficient data has not been available for all the African and Asian countries, and those countries for which the data was insufficient have been excluded. Economies included in this analysis are presented in Appendix 1.
In order to investigate how the dependent variable, average growth in 2004-2006, is affected by FDI and trade policies in the previous time period 1999-2003, explanatory variables for these had to be determined in this growth accounting. First, as FDI may stem from both market- and cost-seeking FDI, it is important to not merely include a variable for FDI inflows but also a variable combining FDI with openness to trade as some products will need to be re-exported to reach other countries’ markets. The interaction term estimates the combined impact of FDI and trade on growth and indicates the relationship between the two.
Trade flows are used as an indicator of trade openness in a country. A country open to trade will have a possibility to recoup benefits from more efficient and specialised production and experience increases in economic growth. Since one of the objectives of this analysis is to quantify the effects of trade openness on economic growth this is included as an explanatory variable.
GDP is considered to be the key economic indicator. By looking at its growth rates over time one can see if countries experience an economic expansion or recession. Present growth will also be affected by growth in previous time-periods; therefore growth in 1999-2003 is included as a control variable. Including this variable partially controls for factors
such as taxes, macroeconomic policies and human capital which can affect growth but have been excluded as explanatory variables. It is a way to avoid skewed results from endogeneity problems common when testing FDI’s effect on growth. Human capital was initially included as a control variable. Due to the limited data available for many of the African and Asian countries, the number of observations were cut dramatically when including this variable; from 84 initially to a mere 44 when using WDI’s data on net secondary school enrolment as percent of GDP and to 48 when using the universally accepted Barro-Lee index of human capital. Hence human capital was removed which may make the empirical findings less robust. This is a limitation the authors are aware of; however, as human capital is partly accounted for through the lagged growth variable, this was believed to be a better choice than including it.
The following equation was estimated in order to test the impact of the variables on growth:
gt = a + b1FDIt-1+ b2TRDt-1+ b3(FDI t-1xTRDt-1)+b4gt-1+εt (1)
where gt equals average GDP growth in the second time period, 2004-2006, FDIt-1 expresses the average FDI as percentage share of GDP during 1999-2003, TRDt-1 is defined as the
average sum of exports plus imports of goods and services as percentage of GDP in the same time period, the interaction term, FDI t-1xTRDt-1,indicates the impact of the combined
effects of FDI inflows and trade openness on gt. A positive coefficient for the interaction term would suggest that FDI and trade openness reinforce each other in advancing economic growth. The variable gt-1 equals the average GDP growth in 1999-2003 and the
final variable εt. represents the error term. The parameters a, b1, b2, b3 and b4 are all
constants.
Investments in machinery and buildings are labelled gross fixed capital formation, GFCF in the national account of a country. As FDI may very well be a part of GFCF one needs to control for this variable in order to see if it is FDI or GFCF that actually affects growth but is not included as an explanatory variable.
As a second step the authors hence estimate the following model:
gt = a + b1FDIt-1+ b2TRDt-1+ b3(FDI t-1xTRDt-1)+b4GFCFt-1+b5gt-1+εt (2)
where GFCFt-1, equals gross fixed capital formation as percentage of GDP and b5 is a
constant.
Based on the theories presented implying that the explanatory variables positively affect economic growth, the authors expect all the estimated coefficients to have positive signs. Both equation (1) and (2) are estimated on the whole sample and on subsamples of African and Asian regions separately.
6
Results and Analysis
This section presents a summary of the descriptive raw data followed by a summary and an analysis of the regression results.
6.1 Descriptive Data
Figures 1, 2 and 3 below, present an overview of the raw data collected.1 The figures
represent the average levels of FDI inflow, trade (sum of exports and imports) and growth of GDP for all the 82 selected countries and for the African and Asian regions separately. According to Figure 1, average FDI inflow decreased in Asia during 2000-2002 but the region has since then experienced a steady increase of FDI. Africa experienced increased FDI between 2000 and 2002, declined until 2004, after which the values once more increased annually until 2006. Due to the mirror image of Africa and Asia up until 2004 the trend of FDI inflows for the total sample seems quite stable, with a take-off after 2003.
Average annual FDI in % of GDP, 1999-2006
0 0.5 1 1.5 2 2.5 3 3.5 4 4.5 5 1999 2000 2001 2002 2003 2004 2005 2006 Year % Asia Africa Africa & Asia
Figure 1: Average annual FDI inflow in % of GDP for Africa and Asia, 1999-2006
Source: Computed by current authors using data from UNCTAD (homepage, 2008b) and WDI 2007 (The World Bank, 2007)
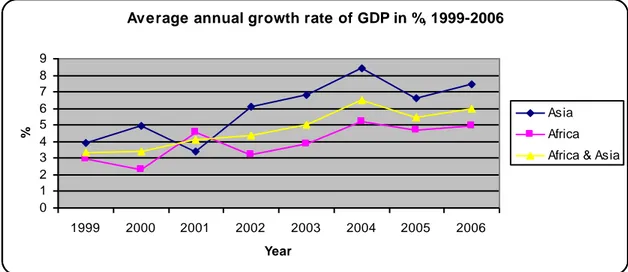
In Figure 2 the average rates of GDP growth in Asia during 2001-2006 increased quite steadily apart from a dip in 2004-2005. GDP growth increased in Africa during 2000-2001 but decreased and slowed down in 2001-2002 before eventually growing without experiencing greater fluctuations. From 2002 and onwards Africa and Asia seem to follow the same growth trends, with Asia having higher growth rates.
1 Interested readers may see Appendix 2 for descriptive statistics for the explanatory variables used in the
Average annual growth rate of GDP in %, 1999-2006 0 1 2 3 4 5 6 7 8 9 1999 2000 2001 2002 2003 2004 2005 2006 Year % Asia Africa Africa & Asia
Figure 2: Average annual growth rate of GDP in % for Africa and Asia, 1999-2006
Source: Computed by current authors using data from UNCTAD (homepage, 2008b) and WDI 2007 (The World Bank, 2007)
The trade values for both regions (see Figure 3) have been quite steady during the first half of the time frame, up until 2003, then growing slightly in the second half with Asia having a higher rate of trade than Africa throughout 1999-2006. A reason for the trade values not fluctuating as much as for FDI and GDP may be the slow evolvement of trade openness over time. Average trade in % of GDP, 1999-2006 0 20 40 60 80 100 120 140 1999 2000 2001 2002 2003 2004 2005 2006 Year % Asia Africa Africa & Asia
Figure 3: Average trade in % of GDP for Africa and Asia, 1999-2006
Source: Computed by current authors using data from UNCTAD (homepage, 2008b) and WDI 2007 (The World Bank, 2007)
Comparing Figures 1 and 2, the average rates of FDI inflow and GDP growth fluctuate to a great extent over the selected years. One can see that the fluctuations are far greater for FDI and GDP growth than for trade. The variations are seen in Asia to a lesser extent than in Africa within FDI inflow. According to Figure 3, the average values of trade for both regions do not fluctuate greatly and increase slightly throughout the latter half of the selected time period. What can be concluded from Figure 1, 2 and 3 is that there does not seem to be a strong relationship between the fluctuations of the average values of FDI, GDP growth and trade.
6.2 Regression results and Analysis
Table 1, 2 and 3 below summarise the regression results of equations 1 and 2 for the total sample of 82 countries, and the regional samples.
As can be seen in Table 1, the results indicate a positive relationship between the explanatory variables FDIt-1 and TRDt-1 (although the latter is extremely small) and the
dependent variable, average GDP growth in 2004-2006. The coefficient estimates for FDIt-1
show a significant relationship at the 5% significance level where a 1 percentage point increase in FDIt-1 indicates a 0.291 percentage point increase in economic growth. The coefficient estimates for the interaction term FDI t-1xTRDt-1 and TRDt-1 indicate no or little
effect on growth, contrary to expectations, and is highly insignificant. The coefficient estimate for gt-1 is positive and significant as expected since gt should intuitively be affected
from growth in the previous time period. The estimated R2 in Table 1 is 0.523, hence, the
equation explains approximately 50% of the variance in the dependent variable.
Table 1: Regression results using the 82 countries in the total sample, with GDP growth in 2004-2006 as the dependent variable
Explanatory Variable Coefficient Estimate Standard Error p-value
Constant 1.628 0.775 0.039 FDIt-1 0.291 0.127 0.025 TRDt-1 0.003 0.008 0.672 FDIt-1xTRDt-1 0.000 0.001 0.547 gt-1 0.829 0.108 0.000 R2 0.523 Adjusted R2 0.498
When turning our attention to the African region as shown in Table 2, the results look somewhat different. The FDIt-1 coefficient estimate’s p-value has increased which makes
findings less significant for Africa than they are for the whole sample of Africa and Asia together. The estimated coefficient for TRDt-1 shows a negative impact on growth, very
much contradictory to economic intuition and the results expected. Its results indicate that if trade openness increased by 1 percentage point during 1999-2003 growth decreases by 0.026 percentage points. The p-value of 0.011 is below the 5% significance level making the negative effect of trade openness significant. Again, the coefficient estimate of gt-1 is
positive and significant.
Table 2: Regression results using the 49 countries in the African sample, with GDP growth in 2004-2006 as the dependent variable
Explanatory Variable Coefficient Estimate Standard Error p-value
Constant 3.017 0.818 0.001 FDI t-1 0.232 0.139 0.104 TRD t-1 -0.026 0.010 0.011 FDIt-1xTRDt-1 0.002 0.001 0.216 gt-1 0.742 0.109 0.000 R2 0.725 Adjusted R2 0.700
The R2 has increased and indicates that for the African case, the variables are explaining
more of what drives growth, in comparison to Table 1. Here, the regression explains 72.5% of the variance in the dependent variable.
Table 3 for Asia reveals quite different results than Table 2 did for Africa. The impact of
FDIt-1 on growth seems greater but is statistically insignificant. The coefficient estimate for
TRDt-1 which as we remember from the African sample was negative and significant is
instead positive and insignificant just as was the case for the full sample presented in Table 1. The coefficient estimate for FDIt-1xTRDt-1 which is slightly positive in the African sample and reported as virtually zero in the total sample, is unexpectedly negative for the case of Asia. Albeit having a lower p-value than the other two samples it is still insignificant. Oddly enough in this case, the impact of growth in the previous time period is lesser for Asia and the significance levels for its impact on growth in gt is smaller than in the two previous cases, insignificant at the 5% significance level. R2 is far lower for Asia than for Africa and
the regions together, 0.310 in comparison to 0.725 in Africa and 0.523 for them together. Clearly, the model formulated accounts for substantially less of the variance of growth in Asia.
Table 3: Regression results using the 33 countries in the Asian sample, with GDP growth in 2004-2006 as the dependent variable
Explanatory Variable Coefficient Estimate Standard Error p-value
Constant 3.138 1.505 0.046 FDIt-1 0.621 0.516 0.239 TRDt-1 0.016 0.012 0.199 FDIt-1xTRDt-1 -0.003 0.002 0.188 gt-1 0.488 0.244 0.055 R2 0.310 Adjusted R2 0.211
To summarise the results found for equation one, only four significant results were found. The coefficient estimate for FDIt-1 in the total sample in Table 1 had a positive impact on growth at the 5% significance level as expected but contrary to what previous researchers have found. The coefficient estimate for TRDt-1 in Africa as seen in Table 2, showed that
trade openness has a negative effect on GDP growth nearly at the 1% significance level. The two final situations are results of the coefficient estimates for gt-1, positive and significant at the 1% significance level in two out of three occasions. In the third case, this was nearly significant at the 5% significance level.
Inclusion of the GFCFt-1 variable did not extensively affect the estimated results reported in
Table 1, 2 and 3 above. With its inclusion, FDI in the total sample is now significant at the 1% level (see Appendix 3).
One can also compare the results from the main regressions with results after the inclusion of outliers Liberia and Lebanon to the sample in order to see how these would alter the results if kept in the initial sample. The regressions show that after adding the outliers, the results in some cases change quite vastly (see Appendices 4 and 5). The results are generally less significant which is true both with and without GFCFt-1 included as a control variable,
If Liberia is included in the sample for Africa, both with and without GFCFt-1, the explanatory variable’s coefficient estimate for FDIt-1 has a negative impact on growth and
R2 is decreased. Why Liberia has this severe negative impact on the whole sample might be
explained when taking a look at their economy. Since Liberia has traded much with diamonds and blood diamonds, maybe a large share of FDI has been placed in the extraction of this valuable resource, while at the same time having experienced extensive instability and conflict which may have affected growth negatively and the positive effects from FDI are lost.
Including Lebanon, shown in Appendix 5 makes the coefficient estimate of FDIt-1 turn
negative. Lebanon has for many years suffered political instability with the presence of Hizbollah, the killing of President Raqif Hariri and fragile relations with neighbouring Syria and Israel that may have affected growth through for example extremely high levels of national debt (CIA World Factbook, 2008). However, the findings in the regression are highly insignificant- something that follows for most variables. With the inclusion of the Lebanon, the goodness of fit measured by R2, is increased from what is seen in Table 3.
The coefficient estimates for gt-1 when including the outliers are positive and significant in
all cases above, as expected.
The FDIt-1 estimated coefficient appears to be positively related to economic growth all over the regressions in Tables 1-3 even though the significance levels vary quite vastly. Many previous researchers have stated the difficulty of connecting FDI to enhanced growth empirically due to endogeneity issues although it makes sense theoretically. It is hard to say if FDI drives growth or if the case is that FDI simply is attracted to countries experiencing increases in their growth rates. In addition to this, investments in for example R&D may take many years before one is able to recoup benefits from these. The time frame used in this report may have been too short to reveal the effects of investments on economic growth. Surprisingly trade openness in Africa shows a negative and significant impact on economic growth, contradictory to economic intuition and literature. Trade openness is defined as: the average of exports plus imports of goods and services as percentage of GDP, so if a country lacks data for either exports or imports, this could have affected the results. Yet another possible explanation for trade openness’ negative relationship with GDP growth in Africa may be if countries trade with non-sustainable raw materials, goods or services that have negative future consequences for the economy. The weak results of trade openness on growth might stem from resource-rich countries in regions that most likely are influenced by commodity-price fluctuations that affect the trade balance.
The interaction term FDIt-1xTRDt-1 is surprisingly enough showing very small and
insignificant effects on economic growth. If it were positive it may have implied that FDI was attracted to countries with open policies or vice versa which is now not the case. The estimated coefficients for gt-1 generallyindicated strong and significant results, except for the
case of Asia in Table 3. Strong growth in a developing or emerging market implies opportunities to invest in a country’s future prospect. Emerging markets offer higher rates of return on investments than a mature market.
The coefficient estimates for GFCFt-1 imply results contrary to the expectations of the
authors as they show a negative impact on growth in all cases except for when Liberia is included in the regression run for Africa. The associated significance levels run the whole
spectrum from highly significant to highly insignificant. This is a surprise as the estimated coefficients for FDIt-1 which are related to GFCF, mostly show a positive, although not
always significant, relationship with economic growth.
Makki and Somwaru (2004) found that when running a regression including trade and FDI separately, FDI was the only variable statistically significant driving growth. After adding other variables the interaction term, FDIxTRD, was instead the only statistically significant which implies that FDI and trade reinforce each other for fostering growth but are not drivers of growth on a significant level by themselves. Although the authors of this report expected results similar to these with strong positive results over the span of variables, it stands in contrast to what was found in the results in this report where FDI has the strongest significance levels. de Mello (1997), Borensztein et al. (1998) and Bloningen (2008) reported on the difficulty to measure the impact of FDI as a driver of economic growth due to endogeneity problems. Although the results for FDI obtained in these regression results are quite dissimilar, this is the explanatory variable which indicates the lowest p-values in the estimated equations. Balasubramanyam, Salisu and Sapsford (1996) tested Bhagwati’s 1978 hypothesis regarding that the efficiency of FDI on economic depended on whether the country was an export-promoting or import-substituting country. What they found was that FDI was indeed more efficient in countries with EP-strategies in promoting economic growth. This implies that FDI and the trade policies are interrelated and reinforce each other in long-term growth, similarly to the interaction term used in this analysis. Contrary to what Balasubramanyam, Salisu and Sapsford found, the results here for FDIt-1xTRDt-1 indicate that it practically has no impact on economic growth rates.
One needs to keep in mind that negative values of FDI inflow are included but do not represent actual red numbers in FDI inflow. Rather, when UNCTAD reports negative values this means that one or more of FDI’s three components; equity capital, reinvested earnings and intra-company loans is negative and is not offset by positive sums of the remaining components. So even if FDI inflows are not negative per se, they may have affected the results retrieved in the regressions as if they were and affected both signs and significance levels. An additional issue related to the data obtained is the quality and reliability of data stemming from developing countries or countries experiencing civil strife or war. Even though the data is collected from reliable sources as UNCTAD and the World Bank, these organisations retrieve their data from the countries’ governments. Historical reasons might stand as yet another explanation to the estimated results obtained. The R2 results are in two out of the three cases very weak which could be an indicator that
those estimated equations fail to include important factors to economic growth for the total sample and Asia. Looking at FDI, trade openness and growth in previous years just is not enough as one misses out on other important drivers of growth. If one were to include human capital, initial stock of GDP, tax rates, domestic investment and inflation rate as Makki and Somwaru (2004) did, the results here might have looked quite different and maybe more similar to the ones found in their article.
Heteroscedasticity might also have been one explanation for the overall weak results retrieved when running the regressions. Therefore the authors tested for this by plotting the unstandardised residuals against the estimated growth, but could not find sufficient support for the existence of heteroscedasticity issues. For those readers further interested in this, the scatter plot is provided in Appendix 6.
7
Conclusion and Suggestions for Further Research
The purpose of this report has been to investigate the impact of FDI, trade openness and their combined interaction on economic growth in selected countries of Africa and Asia. It has been an objective to investigate Africa and Asia on a regional basis. The analysis is based on cross-section data relating to 82 countries in Africa and Asia in over a time span of eight years split with the dependent variable, growth, based on 2004-2006 data and the explanatory variables based on 1999-2003 data.Contrary to theory and previous research, the analysis in this report show quite diverse results on how the explanatory variables affect economic growth in Africa and Asia separately and jointly, as results were weaker than expected. Most cases demonstrated a positive relationship of the explanatory variables (FDI, trade openness and the interaction of these) on growth, in particular for FDI where the strongest results were found. However, it may be difficult to say whether FDI drives growth or if it is attracted to countries experiencing increased growth. The effects of trade openness on growth were small and positive and in the case for Africa even negative and this latter case was the only one to indicate significant results. The negative value might have to do with trade of destructive goods and services which can lead to negative future consequences for economic growth. Contrary to what was expected and to literature, the estimated coefficients of the interaction term, where the reinforcement of FDI and trade openness is captured, generally gave very weak positive and negative results, none of which were significant. The results generally revealed more significant and higher R2 results for Africa
than for Asia.
FDI seems to affect economic growth as the theory suggests, whereas trade openness and the interaction term shows little impact. One empirical difficulty is that effects from increased FDI or trade openness might not affect growth until years later. It may take time before investments in for example R&D could be recouped and the same can be true for trade openness, which develops slowly over time. The real impacts and relationships might hence not fully show through in the analysis. These problems may be diminished if extending the time frame or increasing the sample of investigation.
Although results for FDI, trade openness and their combined effects on growth were quite different than results obtained by other researchers, it should be remembered that the data in this case more often than not provided insignificant results. The analysis did not provide strong support for the expected outcome of the explanatory variables having a positive relationship with growth. Due to this, the authors cannot reject the null hypothesis that no relationship exists between the explanatory variables and economic growth.
For future research in this area the authors suggest more in-depth intra-regional analysis of countries that have opened up to trade during the past two decades or grouping countries based on economic classification over a longer period of time. One could also conduct an analysis including economic and non-economic variables omitted in this analysis.
References
Balasubramanyam, V.N., Salisu, M., & Sapsford, D., (1996) Foreign Direct Investment and Growth in EP and IS countries, The Economic Journal, 106, 92-105.
Bhagwati, J.N., (1978) Foreign Trade Regimes and Economic Development: Anatomy and
Consequences of Exchange Control Regimes, (1st ed.) New York: NBER.
Bhagwati, J.N, & Srinivasan, T.N., (1999) Outward-Orientation and Development: Are Revisionists Right? [Center Discussion Paper no. 806, Yale University]. Retrieved 2008-12-07 from address http://www.econ.yale.edu/growth_pdf/cdp806.pdf
Blonigen, B.A., (2008) “Foreign Direct Investment”, The New Palgrave Dictionary of Economics (2nd ed.) Palgrave Macmillan, retrieved 2008-11-21 from address http://www.dictionaryofeconomics.com/article?id=pde2008_F000168
Borensztein, E., de Gregorio, J., & Lee, J-W., (1998) How Does foreign Direct Investment Affect Economic Growth?, Journal of International Economics, 45, 115-135.
CIA World Factbook (2008), Lebanon, retrieved 2008-12-20 from address
https://www.cia.gov/library/publications/the-world-factbook/geos/le.html
De Mello, L.R., (1997) Foreign Direct Investment in Developing Countries and Growth: A Selective Study, The Journal of Development Studies, 34, 1-34.
Dollar, D., (1992) Outward-Oriented Developing Economies Really do Grow More Rapidly: Evidence from 95 LDCs, 1976-85. Economic Development and Cultural
Change, 523-544.
Dollar, D., & Kraay A., (2004) Trade, Growth and Poverty. The Economic Journal, 114, 22-49.
Dunning, J.H., (1980) Toward an Eclectic Theory of International Production: Some Empirical Tests, Journal of International Business Studies, 11, 9-31.
Dunning, J.H., (2001). The Eclectic (OLI) Paradigm of International Production: Past, Present and Future, International Journal of Economics and Business, 8, 173–90.
Gujarati, D.N., (2003) Basic Econometrics, (4th ed.) New York: McGraw Hill.
Howitt, P., (2008) “Endogenous Growth Theory”. The New Palgrave Dictionary of Economics. (2nd ed.) Retrieved 2008-11-25 from address http://www.dictionaryofeconomics.com.bibl.proxy.hj.se/article?id=pde2008_E0 00079&q=endogenous%20growth%20theory&topicid=&result_number=1
Krueger, A. O., (1998) Why Trade Liberalisation is Good for Growth.
The Economical Journal, 108, 1513 – 1522.
Krugman, P.R., & Obstfeld, M., (2003) International Economics – Theory and Policy. (6th ed.)
Boston: Pearson Addison & Wesley.
Makki, S.S., & Somwaru, A., (2004) Impact of Foreign Direct Investment and Trade on Economic Growth: Evidence from Developing Countries, American Journal of
Markusen, J., (1984) Multinationals, Multi-Plant Economies, and the Gains from Trade.
Journal of International Economics, 16, 205–26.
Navaretti, G.B., & Venables, A.J., (2004) Multinational Firms in the World Economy, Princeton: Princeton University Press.
Nellor, D.C.L., (2008) The Next Frontier – The Road Ahead for Low-Income Countries.
Finance & Development, 45(3), 9-14.
Rausch, J., (2008) “Growth and International Trade”. The New Palgrave Dictionary of
Economics. (2nd ed.) Palgrave Macmillan, retrieved 2008-11-25 from address http://www.dictionaryofeconomics.com/article?id=pde2008_G000129
Rodriguez, F., & Rodrik, D., (2000) Trade Policy and Economic Growth: A Skeptic's Guide to the Cross-National Evidence. NBER Macroeconomics Annual, 15, 261-325.
Stiglitz, J. E., (1998) Towards a New Paradigm for Development: Strategies, Policies and Processes. [Lecture Notes from Prebisch Lecture UNCTAD Geneva,
1998-10-19], retrieved 2008-12-01 from address
http://siteresources.worldbank.org/CDF/Resources/prebisch98.pdf
Todaro, M.P., & Smith, S.C., (2006) Economic Development. (9th ed.)
London: Pearson Addison & Weasley.
UNCTAD homepage (2007) World Investment Report 2007: Transnational Corporations,
Extractive Industries and Development, retrieved 2009-01-30 from address
http://www.unctad.org/en/docs/wir2007_en.pdf
UNCTAD (2008a) Economic Development in Africa 2008 – Export Performance Following Trade Liberalisation: Some Patterns and Policy Perspectives [Report] (Available from United Nations; New York and Geneva).
UNCTAD (2008b) Development and Globalization Facts and Figures 2008. [Report] (Available from UNCTAD, Geneva, Switzerland).
UNCTAD homepage (2008a) World Investment Report 2008: Transnational Corporations and the
Infrastructure Challenge, retrieved 2008-11-10 from address
http://www.unctad.org/en/docs/wir2008overview_en.pdf
UNCTAD homepage (2008b) UNCTAD Handbook of Statistics 2008, retrieved
2008-10-28 from address
http://stats.unctad.org/Handbook/ReportFolders/ReportFolders.aspx?CS_refer er=&CS_ChosenLang=en
UNDP - Note on Statistics in the Human Development Report (1999) Definitions of
Statistical terms: Foreign direct investment. Retrieved 2008-11-10 from address http://hdr.undp.org/en/media/hdr_1999_defintions.pdf
The World Bank (2007). World Development Indicators 2007 [Computer software] Washington: The World Bank Group
The World Bank (2008). Doing Business 2008 Report, Retrieved 2008-09-25 from address
http://www.doingbusiness.org/documents/FullReport/2008/DB08_Full_Repor
Appendix 1: List over included countries
Africa
Algeria Angola Benin
Botswana Burkina Faso Burundi
Cameroon Cape Verde Central African Republic
Chad Comoros Congo
Côte d’Ivoire Djibouti Egypt
Eritrea Ethiopia Gabon
Gambia Ghana Guinea
Guinea-Bissau Kenya Lesotho Liberia2 Libyan Arab Jamahiriya Madagascar
Malawi Mali Mauritania
Mauritius Morocco Mozambique
Namibia Niger Nigeria
Rwanda Sao Tome and Principe Senegal Seychelles Sierra Leone South Africa
Sudan Swaziland Togo
Tunisia Uganda United Republic of Tanzania Zambia Zimbabwe Total African countries: 50
Source: UNCTAD Handbook of Statistics (UNCTAD homepage, 2008b) & World Development Indicators 2007 (The World Bank, 2007)
Asia
Afghanistan Bahrain Bangladesh
Bhutan Cambodia China
China, Hong Kong SAR China, Macao SAR India
Indonesia Iran Japan
Jordan Kuwait Lao People’s Democratic Republic
Lebanon3 Malaysia Maldives
Mongolia Myanmar Nepal
Oman Pakistan Philippines
Qatar Republic of Korea Saudi Arabia Singapore Sri Lanka Syrian Arab Republic Thailand United Arab Emirates Viet Nam
Yemen Total Asian countries: 34
Source: UNCTAD Handbook of Statistics (UNCTAD homepage, 2008b) & World Development Indicators 2007 (The World Bank, 2007)
Appendix 2: Descriptive statistics
Descriptive statistics based on the transformed data, for the explanatory variables used in the regression model.
Descriptive statistics for total sample, excluding outliers
N Minimum Maximum Mean Std. Deviation
FDIt-1 82 -1.201223000 2.270741500E1 3.13128603659E0 4.246434168596E0
TRDt-1 82 .083746000 2.861784990E2 8.27454139512E1 5.024063925024E1
FDIt-1xTRDt-1 82 -7.525390700E1 4.609784430E3 3.64826680671E2 7.465363312635E2
gt-1 82 -5.710245000 1.238021600E1 4.07163303659E0 2.535259279952E0
Valid N (listwise) 82
Descriptive statistics for Africa, excluding Liberia
N Minimum Maximum Mean Std. Deviation
FDIt-1 49 -.512664194 2.270741533E1 3.53824193516E0 4.522386207336E0
TRDt-1 49 22.34587402 1.80976416E2 7.3922108771E1 3.71434783108E1
FDIt-1 xTRDt-1 49 -4.704240704E1 3.412632609E3 3.27583848838E2 5.506950390845E2
gt-1 49 -5.710244577 8.603876717 3.42493453612E0 2.535007439254E0
Valid N (listwise) 49
Descriptive statistics for Asia, excluding Lebanon
N Minimum Maximum Mean Std. Deviation
FDIt-1 33 -1.201223207 1.610807398E1 2.52701821018E0 3.786278404101E0
TRDt-1 33 .08374643 2.86178499E2 9.5846685211E1 6.34311464132E1
FDIt-1xTRDt-1 33 -75.2539065 4.6097844E3 4.201266430E2 9.7495245917E2
gt-1 33 .923764806 1.238021576E1 5.03188233152E0 2.244777003062E0