This exam work has been carried out at the School of Engineering in J¨onk¨oping in the subject area Computer Science and Informatics. The work is a part of the Master of Science programme. The authors take full responsibility for opinions, conclusions and
findings presented. Scope: 30 credits
Abstract
The purpose of this thesis is to explore and study the usability issues within Technical Data Management Systems (TDMS). The research has been conducted as a single case study at the gardening and landscape maintenance company Husqvarna. The inductive research led to conducting 10 interviews, 2 expert focus groups and a observational study. An artefact was produced during the research to emulate a potential system. During the research, the researchers identified ten heuristic usability issues within TDMS. Fur-thermore the functional and non-functional needs of Husqvarna have been identified. The artefact was created, based on existing usability guidelines, addressing the usability issues and the needs of Husqvarna. The artefact was used to answer if the applied guidelines have solved the identified usability issues. The conclusion was set, that the applied guidelines had solved the identified issues.
With the research being conducted with a single case study, the result may lack generalisability. Future researchers are encouraged to conduct a multiple case study to further identify issues within the research area. Keywords: usability, usability issues, usability guidelines, data manage-ment systems, technical data managemanage-ment systems, user interface design
Summary
Data management systems (DMS) have the purpose of providing support for maintaining large quantities of data. TDMS refers to a DMS which handles technical data. Technical Data is data which is produced in an engineering process, e.g prototype testing results. TDMS has risen in use within the industrial market, as the trend for collecting and analysing this data has become a necessity for companies to stay competitive. With the big amount of data, the data evolves to become more complex. As the complexity rises, the usability for these systems tends to drop. The purpose of this thesis is to study the usability issues in TDMS. The research has been conducted with a case study at the gardening and landscape maintenance company, Husqvarna. It was elected they are currently using multiple TDMS. Due to the lack of research in this area, a case study approach was chosen. The thesis was set out to answer two questions.
• What are the functional and non-functional requirements of a technical data management systems within a manufacturing company?
• How can existing usability guidelines solve usability issues for technical data management systems?
The thesis took an inductive approach to answer the questions. The 10 con-ducted interviews have discovered 10 usability issues and 33 functional and non-functional needs for Husqvarna. The issues were, ”Lack of standards of manual data input”, ”Incompatible with other necessary systems”, ”Difficult generate general overview”, ”Lack of version control of the data”, ”Compro-mised high-lighted important sections”, ”Workflow flexibility”, ”Lack of data visualisation”, ”Intuitive UI” and ”Inefficient Search”. The needs have partly emerged from the issues but are also specific for Husqvarna. An artefact was produced to emulate a potential system where the guidelines are applied on. It was created, based on the applied 174 usability guidelines; As well as on the 10 usability issues. Two focus groups were conducted to confirm the findings of the interviews and partially answer the second question. The observational study was conducted, with the artefact, to answer if the applied guidelines had solved the usability issues. The conclusion of the study was that the guidelines had solved the issues and the requirements were confirmed. 83% of the participants were able to complete the tasks set in the study. Which showcases that the usability guidelines had solved the issues.
Contents
1 Introduction 7
1.1 Motivation . . . 7
1.2 Purpose and Research Questions . . . 8
1.3 Delimitation . . . 9
2 Theoretical Background 10 2.1 Technical Data Management System (TDMS) . . . 10
2.1.1 Academic Definition . . . 11
2.1.2 Industrial Definition . . . 12
2.1.3 Thesis Definition of TDMS . . . 13
2.2 Usability Definition . . . 14
2.3 Usability Issues within TDMS . . . 16
3 Methodology 18 3.1 Data Collection . . . 19 3.1.1 Literature Review . . . 19 3.1.2 Case Study . . . 21 3.1.3 Interviews . . . 22 3.1.4 Focus Group . . . 24 3.1.5 Observational Study . . . 26 3.2 Data Analysis . . . 32
3.2.1 Analysis of Literature Review . . . 33
3.2.2 Analysis of Interviews . . . 33
3.2.3 Analysis of Focus Groups . . . 35
3.2.4 Analysis of Observational Study . . . 36
4 Findings and Analysis 37 4.1 Usability Guidelines . . . 38
4.1.1 Discussion of existing Usability Guidelines . . . 38
4.1.2 Applied Usability Guidelines for TDMS . . . 42
4.2 Case Study: Husqvarna . . . 44
4.2.1 Interview Findings . . . 45
4.2.2 Usability Issues in the Garden & Landscape Mainte-nance Industry . . . 49
4.2.4 Focus Groups Findings . . . 57
4.2.5 Observational Study Findings . . . 61
5 Discussion and Conclusions 66 5.1 Discussion of Method . . . 66 5.1.1 Case Study . . . 66 5.1.2 Literature Review . . . 67 5.1.3 Interviews . . . 67 5.1.4 Focus Groups . . . 67 5.1.5 Observational Study . . . 68
5.1.6 Reliability and Validity of chosen methods . . . 69
5.2 Discussion of Findings . . . 70
5.2.1 What are the functional and non-functional require-ments of a technical data management systems within a manufacturing company? . . . 70
5.2.2 How can existing usability guidelines solve usability issues for technical data management systems? . . . . 71
5.3 Conclusion . . . 72 5.3.1 Summary . . . 73 5.3.2 Prospects . . . 73 Bibliography 75 Appendices 78 A Interview Questions 78
B Focus Group Questions 78
C Observational Study Tasks 79
D Artefact 81
1. Introduction
The motivation of doing the research in the area of usability in technical data management system is presented firstly. It introduces the intention of the paper and why research in this area is needed. This chapter is followed by stating out the purpose and research questions. Since not every aspect of the chosen research can be perfectly covered, the delimitation of this paper are outlined at last.
1.1. Motivation
The need of usability in software has been established over the past few years [22]. The main purpose of a software, beside the main functionality, is that the software has to be used by the users. Without a good usability the application can not be used to it’s full potential and therefore can not fulfil it’s purpose.
Data management systems (DMS) have been around for several years. DMS have the purpose of providing support for maintaining large quantities of data. For example maintenance planning, product development and prod-uct testing in a company [14]. At the same time these systems, facilitate the job-tasks of the personnel which is in charge of the data management in a company. Registering current and completed tasks or getting the de-scription of maintenance’s tasks, are examples of the functions where a DMS can support the company’s personnel [22]. The system serves as a central hub of communication within project management, data management and task management [14]. DMS is a collective term for software which acquires data, stores it, retrieves it and also in general controls the access to the data [16]. Technical Data Management Systems (TDMS) are in general systems which handle technical data. Technical data refers to data which is used by engineers. TDMS store information about functions which are used in/by machines and about the personnel [5]. Technical data is usually collected in enormous quantities, and the data has multiple relationships. This makes managing the technical data a very complex task. Therefore TDMS will aid engineers with their tasks [5]. With that trend, automation and with the possibility of facilitating the process of maintenance management, the computerisation of these systems has severely increased [24]. Computerised maintenance management systems (CMMS) is another kind of TDMS which focuses on project maintenance and product management within companies
[22]. Currently CMMS and with that TDMS in general, are facing many usability issues such as, having the trend of having user interfaces which are too difficult to use. The systems are usually too complex for the users and have too much manual input [22][24].The manual input becomes a negative outcome, as the data becomes inconsistent. It varies from the user’s level of motivation, knowledge of the system and the user’s workload during the input [22]. This leads to a lot of the data within these systems becoming corrupt, creating issues within the companies using TDMS [15].
As of now, there do not exist standardised usability guidelines for TDMS [22]. This creates a continues issue for future systems since the same usabil-ity issues will plague future similar software. Currently a lot of researched usability guidelines exist within software [15]. These guidelines could be potentially used for TDMS or potentially be modified to solve the current usability issues within TDMS.
1.2. Purpose and Research Questions
The purpose of this thesis is to firstly fill the research gap of usability guidelines in technical data management systems. Secondly to provide a solution for a TDMS in a company. The case study will take place in the company Husqvarna. Husqvarna operates in the field of forestry and gar-den/landscape maintenance. The company does not has a centralised TDMS for their data maintenance at the moment. The case study will be conducted in the Research & Development (RD) department of Husqvarna. They currently maintaining their data through several individual files and pro-grams due to the lack of a usable TDMS. During the case study, research will be conducted on the current used systems by the Husqvarna RD depart-ment and defining the current usability issues. An artefact of the proposed new system will be created based on existing software usability guidelines in research. The artefact will then be tested with the Husqvarna’s RD em-ployees. The testing process of this artefact will support in answering if the existing guidelines are able to solve the current usability issues within TDMS. This leads to the first research of:
• What are the functional and non-functional requirements of a technical data management systems within a manufacturing company?
Answering this question and conducting the case study will bring up several usability issues to the surface. To create a connection and to bring a profit for research about usability in TDMS, current usability issues which occured in the industry and in research will be presented. How to overcome those issues is the questions which arises directly. Therefore the second research question this paper wants to answer is:
• How can existing usability guidelines solve usability issues for technical data management systems?
To overcome these issues we are going to use existing guidelines which have been discovered by several researchers in the usability area. To be able to measure and say how they can be solved, those guidelines will be used while developing an artefact in our case study. Summarising, the two research questions this thesis is aiming to solve are targeted on the usability in technical data management systems.
1.3. Delimitation
As there are many di↵erent data management systems, which face usabil-ity issues, we decided to limit the research to only study the usabilusabil-ity issues within technical data management systems. Since TDMS do have previous academically confirmed usability issues. This helps us to identify the issues in a more focused manner. Which helps to answer if the existing usability guidelines can provide an aid in solving the existing usability issues. Further delimitation we have set for this project was within the case study and with the research participant we choose. As we are using a industrial case study for creating a industrial software, the research participants were chosen to fit within the context. Using participants which are experienced users of the system helps to focus more deeply into what the issues are within this system. Furthermore it helps to identify a solution to the issues. Choosing partici-pants within the company which are not inexperienced users of this system would have created irrelevant issues. The third delimitation we have taken for the project is that we used a qualitative research approach, by collecting data through semi-structured research methods. This was once chosen to collect a more focused view on the issues from an expert point-of-view. If a quantitative research approach would have been taken, we would not have been able to go deeply into the issues and would rather confirm the issues from previous research. The result would be too general and too broad for a data result. If unstructured methods would have been applied for collecting
the data, the view would be too scattered for the issues. This would provide the same problem as the quantitative approach, by having a too broad range of a data result. Using semi-structured methods helps with diving deep into the issues and understanding them, but still focusing on a structure to follow along. Another aspect which limited the research is the circumstance that the whole project was conducted by two researchers. This has some e↵ect on the analysis and interpretation of the data.
2. Theoretical Background
The following chapter provides the necessary academical knowledge about the usability in technical data management systems (TDMS). Therefore TDMS will be introduced and defined. The definition of TDMS is split in three di↵erent parts to allocate a rounded view on these systems. Since the usability in those system is researched, usability as itself has to be defined. The presented definition of usability takes was viewed from three di↵erent angles.
2.1. Technical Data Management System (TDMS)
Technical Data Management Systems (TDMS) are systems which handle technical data. The di↵erent tasks and aspects of such a system are part of the definition and will be further clarified in this chapter. Since TDMS are not acknowledged in the academic world, but in the industrial, di↵erent definitions exist. Therefore, the systems are di↵erently viewed. Especially in the academic world there are several perspective on data management systems. They have to handle with technical data which is partly entered manually and/or automatically with the computer. In the first sub-chapter we will present several views which correspond to the system of the case study. This will provide a common ground and clarify what the meaning of technical data management system is. Due to the circumstance that the case study is conducted in a industrial company, the need of giving a industrial definition is indispensable. Since especially in the industry a clear di↵erence from the academical view of those systems exist. In the last sub-chapter a deeper definition in combination of both former definitions created. This supports to tailor it more the topic of the thesis and the case study.
2.1.1. Academic Definition
Technical Data Management Systems are a kind of data management systems (DMS) as the term as itself reveals. In general the act of manag-ing data includes a broad range of activities like for example acquirmanag-ing the data, storing it, retrieving it and also in general controlling the access to the data [16]. Having a software or system which handles the management of the data, is a data management system. The definition of the Oxford Dic-tionary for Computer Science defines DMS as following: ”A class of software systems that includes database management systems and file management systems.” [9]. Therefore a data management system has a database as base for handling the amount of data. For the purpose of this thesis, the data which is handled in the TDMS is technical data. Technical data is in the literature often referred to engineering data [5]. It is a specific kind of data which increases in quantity enormously daily and includes information about functions and people. As well does it has di↵erent components in technical data, multiple relationships to each other or di↵erent data. Which leads to having di↵erent version of the data. All these aspects make it difficult to manage the data. And therefore specific systems for technical data ex-ist [5]. As above mentioned a lot di↵erent perspectives have been taken on TDMS in the academic world. According to the former definitions of tech-nical data and data management systems, Computerized Maintenance Man-agement Systems (CMMS) and Product Data ManMan-agement Systems (PDMS) are included in the term of technical data management systems.
CMMS are data management systems which have the purpose of maintain-ing data [22]. With the trend of data minmaintain-ing, automation and with that the possibility of facilitating the process of maintenance management, the computerisation of these systems has severely increased [24]. It manages the information about the person who plans or schedules maintenance of machines as well as the actual information about it. This includes several versions of costs, information tracking or the assigned personnel. Which falls under the term of technical data since several relationships between the dif-ferent information. Therefore there exists multiple versions of it.
Product data management systems have the purpose on handling data which is about specific products. These systems are mostly computer based. They electronically provide the management of technical data, activities and
docu-ment, as well as changes which are in relation to the product. The intention of PDMS’s is to improve and maintain the quality of the supervised products and the related processes to it [5]. The same arguments, as for CMMS, can be taken to identify it as a technical data management systems, since the same kind of data is handled. This has to be kept in mind for the upcoming content in the paper. The usability issues, which will be discussed, emerge generally from technical data management systems. They can have their ac-tual origin for example of the above mentioned specific systems (i.e. CMMS or PDM). Since they are TDMS their issues can be mirrored for technical data management systems issues.
2.1.2. Industrial Definition
In the industrial world technical data management systems are used daily. The market for these systems has been already discovered and several com-panies are selling software with the purpose of managing technical data. Trix [23] or CSoft [11] are examples of companies who have taken the technical data management from a niche to a mass market level. Trix or CSoft are companies which are selling specific application for technical data manage-ment. They define data management as a process which manages data in an consistent way, which provides a software to access data and a database to be able to store the data. They highlight the importance of technical data management in the issue of the rising amount of data and that managing the data manual can not be processed efficiently anymore. They define technical data in the same way as the academical world. It is data which can be related to the product and is the output of an engineering process. Within the defi-nition from Trix, the fact of which business procedures and users are included in the technical data management process, are pointed out as well. Work-flows to design, revision and change control as well as communicating and security are examples of the procedures. The users which are pointed out are Engineers, Technicians, Data Controllers or for example Project Managers [23]. Those are all aspects which have importance for defining TDMS. Another aspect to mention for the industrial definition of TDMS is that there is a definition of it on Wikipedia. Even though Wikipedia is not a trusted source for academical research and there will not be relevant references from it for this paper. It is still important to mention here, that there is an entry of technical data management systems on Wikipedia. This indicates that the term and the systems as itself do have an importance in the industry.
The article mentions di↵erent references which strengthened the quality of it relatively. Nevertheless, the broader definition of Wikipedia corresponds with the ones from Trix and CSoft. This substantiates the view of industrial definition in this thesis.
The case study is held in the industrial company Husqvarna. Their definition of technical data management system is on the same level of profoundness as the academical definition. They perceive the system mostly as general data management system even though technical data is processed by it. What kind of systems are in use currently in Husqvarna and which ones do have importance for the thesis will be explained in Chapter 4.1 Use Case: Husq-varna
2.1.3. Thesis Definition of TDMS
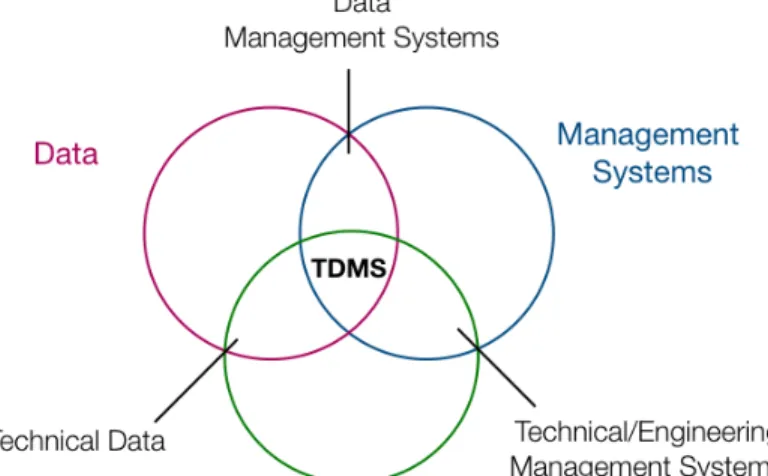
The former given academic and industrial definition have several similar-ities but also di↵erences. Therefore we will take a closer look at the common factors. Gathering together the commonalities and creating an intersection of them to create a definition of TDMS for this thesis. Furthermore it will unite both worlds and create a new perspective on these systems. Figure 1 shows the similarities intersected to define technical data managements systems.
There are three main components for defining TDMS. To be able to man-age data, data is needed. Since data can be anything and can occur in every area of research or the industry we have to take data which comes from en-gineering and technical processes. That is the first commonality which both definitions have. The second component is a system which manages some-thing. Combining management systems with technical/engineering processes an engineering management system results. In this aspect the industrial and academic perspective agree and both of them are using the term in the same way. Intersecting the data part with technical/engineering processes results into technical data. Combining the specific kind of data, technical data, with the technical/engineering management systems leads to the overlapping of technical data management systems. The individual definition of data, man-agements systems and technical/engineering processes are corresponding in most part in a researcher and practitioner way. For the definition of TDMS we have taken the similarities of the intersections to create a well-balanced definition.
For the academic and industrial world TDMS’s occur in di↵erent forms. As above mentioned they can be called for example computerized maintenance management system (CMMS) or product management system (PDM). There are lot of versions of those systems which di↵er in some aspects but they all do handle partly or mainly technical data.
2.2. Usability Definition
The usability of a product/an application has been defined by many re-searchers. Therefore several definitions do exist, which take slightly di↵erent approaches. For this paper we will introduce three di↵erent definitions. A standard definition has been made by researchers. We are going to introduce this one firstly. The definition which is written down in the ISO standard from 1998 is worded as follows: ”the extent to which a product can be used by specified users to achieve specified goals with e↵ectiveness, efficiency, and satisfaction in a specified context of use” [1]. Examining this definition leads to the key words of e↵ectiveness, efficiency and satisfaction in relation to a user achieving a goal in a specific utilisation context. The definition was made over 20 years ago and is still revised every five years and therefore valid and used by several researcher. Even though the specification of the word ”usability” has not included the specific area of software, it can still be applied to the context of using a software. This specification of the word
”usability” has been seen of a user perspective and helps this paper to in-clude the users view while defining usability.
The second definition which coincides for the use of this thesis, is the defi-nition from Nielsen. Nielsen [20] refers to qualitative factor which appraises how easy a user can use the interface of an application as the definition of usability. More over is ”usability” according to him a method which is used during the process of designing a software to enhance the ”ease-of-use”[20] of the design. The definition from Nielsen of usability includes five elements: learnability, efficiency, memorability, errors and satisfaction. The learnabil-ity in context of the usabillearnabil-ity of a design, answers the question on how easily a user can solve a tasks on their first time being faced with the design. The efficiency on the other hand is defined as how fast a user can achieve the goal of a tasks when he/she has acquired the design. For the memorability in the usability, Nielsen reckons the users ability of re-establishing the attainment of being proficient of the design after being absent from it. Another component of usability is the amount of errors a user makes and how grave they are, and if the user can recover from them easily. Lastly, the overall satisfaction i.e. the pleasure of the design matters for the general usability definition from Nielsen. He sees the definition from a design perspective and with having the area of the ”world wide web” in mind. This leads to be able to apply this definition not only to web applications but to applications in general. Furthermore, has Nielsen influenced the usability guidelines later on in this chapter. Therefore his definition of usability is indispensable for this paper. Definitions of the user’s and designer’s perspective have been given. Benyon [7] examines usability more as the ”quality of the interaction in terms of pa-rameters such as time taken to perform tasks, number of errors made, and the time to become a competent user”. His definition intersects with Nielsen’s and the ISO one but approaches it in a more measurable way. Since the usability will be researched on a specific kind of software, it is important of being able to quantify it on an application. Benyon’s definition does not only combine the two mentioned definitions but also helps to be able to identify and measure the usability of an application, which will be done in the use case of this paper. Parameters as how long it took users to achieve tasks or how many mistakes have been done while executing them will indicate to which extent the usability of a software exists. This can be based on and with Benyon’s description of usability.
2.3. Usability Issues within TDMS
The current status of usability issues in technical data management sys-tems in the academical is complicated to define. There are di↵erent variations of how these systems which are handling technical data. Important papers which are related these systems and have been identified for computerised maintenance management systems. These are the papers from Tretten [22], Lopes[17], Wienker[24] and de Wit[6]. Other researchers who have examined technical data management systems and have under taken several studies on the usability or user-centered approach of those systems are: de Porto Alegre Muniz and de Moraes [12], Bugaje and Chowdhury [8] and Hirz [13]. All of the mentioned researchers are agreeing on the fact that most of the current existing TDMS are currently not designed from a user’s perspective, but rather than from a requirements point of view. Therefore these system lack in general in usability since they are handling technical data. Which can not be processed in a easy way by humans [22].
The papers which fitted most in the context were providing tangibles is-sues are from Tretten and Bugaje. Tretten and Karim [22] had the aim to enhance the usability in CMMS. Inter alia they have conducted a case study in the aircraft maintenance industry and split their usability issues. In general needs for the industrial and on the other hand for the aircraft maintenance industry. The following issues are the generalised industry ones Tretten found:
• Limited access to necessary documentation • Incompatible with other necessary systems • Too much manual input of information • UI difficult to use
• More guidance needed
• Maintenance decision support is lacking • CMMS was too complex
All these issues have been found in di↵erent industries but the need for them was found between all of them. One of the factors is leading the human to
enter data in a not assumed way. The issues are emerged from the lack of a suitable information architecture, complicated user interface or complex data flow. The authors invoke for CMMS, and with that TDMS, to be a easy understandable and easily navigated software. It shall provide essential information which enables the user to execute maintenance tasks, to trace the data flow and to gather and transfer data to other systems.
Bugaje and Chowdhury have been researching on user-centered research data management systems (RDM) [8]. They have more in detail examined the re-quirements for those systems. Research data is a part of an engineering process [8] and falls therefore in the category of technical data as well. Due to this fact, the findings of Bugaje are important for this paper. The list of requirements which have been found for RDM systems can be adapted as issues which current TDMS are lacking. The ones which are connected to the usability are:
• Users are not able to structure data
• Recognisable di↵erence of di↵erent roles and user types in the system • UI is not according to standards and best practices
• Lack of data visualisation
• Non-existing interaction with data sets on web-browser before down-load
• Allow user to save data as draft/invisible
Bugaje and Chowdhury gathered those issues from an online survey, face-to-face interviews and market appraisal and review. The listed issues are the requirements for this kind of systems, which they got from the users. They are also corresponding to several guidelines in the literature [8]. For them the main goal for a data management (DM) systems with a user-centered ap-proach is that the system supports the user to discover data and to provide easy access and usage of the data. As well, they invoke that a DM system should help the user to enter data in a e↵ective way. Furthermore to also use it in a way which enables the systems itself to inter-operate.
issues in TDM systems. They are mainly arguing that these systems have a trend of having user interfaces which are too difficult to use. The systems are usually too complex for the users or having too much manual input. Which leads the user to not use the systems full potential, as they are less willing to put e↵ort into using the system [6]. Accordingly to them the difficult user interface and the complexity of the system lead to state of the user of need-ing more guidance. This leads to user producneed-ing errors in the system and eventually losing interest [22][6][17]. This results to the user needing more training than to actually use the application. With the right amount of user research the output will be, that these users do not have the need spending their majority of their time with documenting [17]. Rather will users spend time with proper issue solving and requirement testing. Hirtz [13] focused on engineering data management and is concluding as well that the challenge within this kind of information is to create usable ways to interact with the data. Another factor which Lopes, de Wit, Hirtz, Tretten and Muniz have in common is that the origin of one of the main usability issue is the data structure. With that is the flow of the data the ”behind the scences” of the application Lopes et al. [17] [13] [6] [22] [12].
The work which is represented in the thesis, is focusing on the industrial needs and how to cover them. The base for this, is the current status on the issues from the academical perspective. Therefore, are the presented re-searched usability issue used as the first layer for the found ones in the case study .
3. Methodology
The following chapter provides the explanations and arguments for the the research methods we used through this research project. The chapter will help establishing a good understanding why the methods we used were chosen to answer the research questions. The chapter has been split up into two sections. The first section introduces the research methods which were used for collecting the data. Every method will be explained and arguments why they fit within the research are given. The second section will introduce the methods we used to analyse the data which was collected through the research methods.
3.1. Data Collection
In this sub chapter the research methods which were used for collecting data in this research project will be introduced. Each of the methods will be provided with an explanation of the method and also arguments why this method was chosen for this specific research context. Firstly the method of the literature review is presented. The explanation of the case study followed by the interviews, focus groups and observational study follows.
3.1.1. Literature Review
A literature review supports the project to establish a stable academic ground. Critically reviewing previous literature provides an insight into the topic and creates a foundation for the research [2][25]. This is also the in-tention of using literature in the researching process for this paper: creating a stable academic ground of current usability issues in TDMS and usabil-ity guidelines. As there is no need to reinvent the wheel, literature review locates the trends within the field [2]. The academic ground will help in ar-guing for where the knowledge gap lies within usability issues within TDMS. Dependent on the acknowledged knowledge gap, which is identified from the literature review, a research purpose will be set how the research project shall continue from previous research. Usability standards and issues within technical data management system will be reviewed.
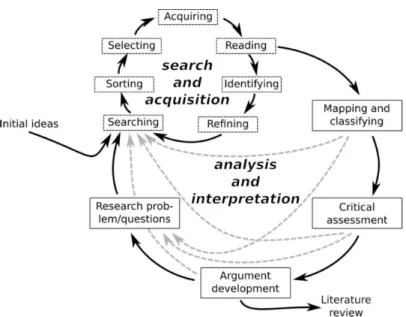
The hermeneutic framework (illustrated in Figure 2) by Boell [3] has been applied during the literature review, to create coherency when retriev-ing the literature. The hermeneutic framework will create a structured way for conducting the literature review. By applying this framework it will be ensured that the di↵erent literature is critically reviewed by connecting and comparing them. Due to the risk of neglecting the important literature dur-ing the process of narrowdur-ing down the key search words, the hermeneutic framework was chosen to prevent it. The iterative process of the frame-work enables the researcher to validate the first results and then approach the search ones again. The framework takes an inductive approach to the literature review. An inductive approach starts with analysing the data of previous literature and then continues with creating theories which will re-late to the reviewed literature [2]. The hermeneutic framework[3] (Figure 2) consists out of two iterative workflow circles. In the first circle, ”Search and Acquisition”, the researcher starts with defining the keywords for the search process. The researcher use these keywords to search for relevant literature,
Figure 2: A hermeneutic framework for the literature review process consisting of two major hermeneutic circles
followed by sorting and filtering them. This is followed by collecting and re-viewing the relevant literature. If relevant literature findings are not found, the researchers use the found literature to identify and refine additional key-words to search for. If relevant literature is found the researcher continues into to the second workflow circle, which will be explained in the chapter 3.2.1.
The literature review consists of academic articles, journal articles, conference proceedings, books and internet resources. The literature was located from the academical search engines Primo and Google Scholar. Their retrieving content from the academic databases Emerald Insight, Elesiver, ACM Digital Library and IEEE Xplore Digital Library. During the search, the literature was filtered by ”peer-reviewed”. The relevance tree by Saunders [2] (Fig-ure 3) displays the keywords for the literat(Fig-ure search which were used and redefined during the first hermeneutic framework workflow circle. To em-phasis the combination of the di↵erent searches a circle has been chosen to fulfil the iterative process proposed by Boell [3]. Figure 3 showcases how the keywords have been combined during the search. Each of the boxes in the figure displays the keywords which have been applied during the search.
Adjacent boxes to that keyword in the figure have been combined by using two of the keywords or all three together (e.g. Data Management Systems AND Usability Issues AND Usability Guidelines).
Figure 3: Relevance Circle
3.1.2. Case Study
The focus which has been set for this thesis is a qualitative approach. The research project will be collaborated with the Husqvarna RD team. Therefore the framework of a case study was chosen. Case study research is extensively used for finding and developing theories about a social phenomenon [25]. As this research of the social phenomenon which is being researched in its nat-ural setting [25]. The intention with the case study is to find out the case studys’ company functional and non-functional requirements of TDMS. This helps to answer the first research question of the thesis. As well it provides insights on how TDMS are used and needed in the industry.
part of the big workflow of their testing process. A case study is well fitting, as a research framework for developing and testing a theory where knowledge is limited [25]. Many of these systems are very tightly intertwined in the com-pany and not a lot of knowledge exists outside of the comcom-pany. A case study will help to understand the usability issues within these systems and how they can be solved through studying the problem close at hand. The case study will be designed as a single-case study. This was chosen for the reason of the limited time and due to the resources provided for the project. A single case study is suitable when it comes to extreme research cases. As the researcher can conduct a in-depth analysis of the area which is being studied. A case study can also be combined with other research methods to fur-ther develop the theory of the project [25]. A base has been set for this research project to use a case study as its framework. Several other methods have been chosen to strengthen the developed theory. A selection of three sub-methods has been chosen to perform the case study. As the project will consists of a use case with Husqvarna, the goal is to develop a user-friendly technical data management artefact for Husqvarna. A major part of the case study will be conducted through user studies. Within the user studies there will be specific methods, such as interviews, focus groups and observational study. A case study will help the project to strengthen the academical find-ings which will be produced from the case study results. The final result of the case study will be a high fidelity prototype of a technical data manage-ment system. Focusing the research project around a case study is the most sufficient for understanding the issue at hand. Studying the area where the problem is emerging, will provide a clear understanding of these issues [25]. 3.1.3. Interviews
To get a better and deeper understanding of a target group in a design project, interviews are often used to get qualitative data [25]. The intention of using interviews as a research method was to identify the issues Husq-varna are currently facing while using technical data management systems. Answering the question about how the usability guidelines can be established in a data management system will be answered partly through the interviews. Design of the Interviews
The design of the interviews was set as semi-structured. Interviews can be divided into di↵erent styles, such as structured, semi-structured and
unstruc-tured. Structured interviews give barely any freedom. All the interviewees would have been given the same questions without deviation. This leads to a very linear results, which is not appropriate for qualitative studies [25][26]. Unstructured interviews take the interview process to the complete oppo-site. The interview is more likely to be a conversation, which can lead the interview to a broader point of view. Which leads to the data being hard to compare between interviews [25] [26]. Since that would interfere with the intention of the interviews, semi-structured interviews were conducted. In total 10 interviews were held. There were two rounds of interview sessions conducted. The first round had the intention to gather the first data and to get the first insights. After the conduction of the first session, first patterns were discovered. With those in mind the second session was hold. Every interviewee was interviewed separately. To be able to gather and analyse data, the interviews were voice recorded. Every participant was asked before the interview for consent for the voice recording.
Participants of the Interviews
Interviews were conducted with employees of Husqvarna who worked closely with their in-house data management systems. The interviewees were anony-mously interviewed, only revealing the position within the research and de-velopment department. A total of ten interviews were held. They are seven potential user groups of the software: Test Operator, Test Responsible, Sys-tem Engineer, Test Method Owner, Project Manager, Lead Engineer and Design Engineer. These user groups were given by the responsible person of this project at Husqvarna, who started investigating in the project three years ago. Due to that reason, no further research was conducted considering the user groups. A further description of each role can be found in chapter 4.2.1. The contact with the participants was initiated by e-mail and meetings for the interviews were set. All of the participants were told that there is no need to prepare, since gathering the first impressions and thoughts of the potential users was wanted. All interviews were executed in the span of two weeks. Seven interviews were first conducted, with interviewees which represented the seven user groups. After the first seven interviews were conducted, the first analysis was performed on the data. The result of the analysis has been taking in consideration in the last three interviews to get them indirectly confirmed. During the last three interviews the user groups, Test Opera-tor, Project Manager and Test Method Owner were interviewed. These user groups were chosen to create reliability and validity of the collected data. As
all three of these user groups have related work tasks as some of the other user groups (see chapter 4.2.1).
Question Design of the Interviews
Due to the design of having semi-structured interviews, only a few questions were created. In total, six questions were asked during the interviews. The exact questions can be found in the appendix (A). One question was intended to introduce the participants to the general context and to slowly dive into the topic. Based on the answer the questions of the current characteristics he/she likes and dislike about them, allows to reveal positive and negative issues. The rest of the questions were figuring out what kind of work the user does, expect and wants in an TDMS. These questions were designed in a shallow way and not deep in detail. This allows the interviewee to answer as in-detail, as they thought they to need to. Therefore the researchers are able to get insights and several facets in di↵erent kinds of extent. For exam-ple one question which was asked during the interview session followed as, ”What do they expect from a test management system?”. This for example helped to give the interviewee a context and topic path but being able to talk about it freely. The rest of questions asked during the interviews can be found in A. In the end of the interviews, the already existing requirements from the supervisor at Husqvarna were shown. The interviewees were asked if they agree or disagree with them and if they are important for their daily work.
3.1.4. Focus Group
Focus group has been chosen as the second research method. The in-tention of using them in the case study is to find out if the interviews have been analysed in the right way. The results of the interviews is tested with the method of focus groups. Focus group is a suitable research method to produce a larger amount of qualitative data in a short amount of time [26]. Focus groups are especially suited for exploring peoples view on experiences, ideas and products [25]. With the interviews, the aim was to identify usabil-ity issues within technical data management systems on an individual level. Therefore asking them several questions about the topic will support the process of extracting the issues. First and foremost the focus group will be used to confirm how the artefact has addressed these issues. As the artefact was created based on two factors: the usability guidelines which were found through the literature review and the usability issues which were identified
during the interview sessions. Using the focus groups, a discussion will be created around the artefact. A semi-open discussion was hold which was not interrupted by the researchers. This was chosen to get an unbiased perspec-tive on the proposed solution to the issues within TDMS [4].
Secondly the focus groups will be used to confirm the findings and the analysis result from the interview sessions. Focus groups will also help with creat-ing a group scenario. This triggers the experts to discuss within the group where the needs and issues lies within the system. This could be potentially help within identifying further usability issues. Discussing about the topic as group will be more e↵ective as with individuals, since data management systems are mainly used by large amount of people. Both, interviews and focus groups are aiming to get a deep understanding about a topic and can be used in a complementary way [25]. Since focus groups are well suited follow-up technique for other qualitative techniques [25].
Design of the Focus Groups
Focus groups were used to discuss the topic within group setting. During the session, the researcher went through di↵erent sections of the artefact. In each of the sections the focus group participants were asked two to four questions regarding the section. The semi-open questions were able to steer the participants to focus on the discussion of the artefact. In the appendix B you will find the questions, with the assigned sections to them, which were asked during the two focus group. This is suitable as conditions and envi-ronments are very similar to the interviews [4]. Since the nature of focus groups, the discussions tends to spiral away. During the focus group ses-sions, in the same manner as the interviews, the sessions are voice-recorded. Voice-recording the session helps the researcher to focus on the asking the right questions and steering the session according to the outcome of it. Participants of the Focus Groups
The two groups will consist of both a mix of previous participants (biased) and new participants (unbiased). As most of the implemented issues in the artefact were stated by the biased interviewees. In the same time bringing in participant with a ”fresh pair of eyes” on the topic, enables to create an environment of discussion and to bring new thought on the stated issues. [25]. As the research is focused on testing the issues in TDMS through the company Husqvarna, we chose participants which matched with the
iden-tified user roles (see chapter 4.2.1). The thought behind it was that those kind of employees will have the most understanding and knowledge of the topic. This is a factor which is desired within a focus group [25] [4]. The participants were all contacted through email, being asked if they wanted to participate and when they would be available. The combination of the user roles were dependent on the availability of the participants.
3.1.5. Observational Study
Observational study is another qualitative research methods. The inten-tion of the research in this paper is inter alia, to see how the user interacts with the artefact. This will help to identify if the used usability guidelines were able to solve the usability issues. Observational study is usually used to study cultures or subcultures focusing on the social aspects of the culture and the setting of the culture [25]. Observational study can also be used to study specific kinds of group settings, for example within a work environment, to understand the interactions and behaviour within that setting [25] [2]. One of the intentions of conducting a observational study is as already men-tioned, to comprehend the interaction and behavioural actions of the user. With our work we are coinciding the aim of observational study of gather-ing and recordgather-ing information with the way of workgather-ing and thinkgather-ing of the user. This corresponds with the goal of translating the knowledge and ex-perience of insiders to outsiders [21]. This will help to increase the usability of the artefact. For the project, verbally isolated research techniques have been used. Verbal expression has its benefits as it can help the researchers have new concepts understood and explained in detail by the participants. It also has its drawbacks, as the participants can only discuss about what they actually perceive about the topic. Aspects which are obvious for them may slip by [25] [2]. Those obvious pieces of information may be crucial to the research. To complement the verbal research techniques, participant observation was chosen since the context of the case study has a naturalistic setting. It enables to observe the variety of actors interaction and behaviour within the setting of the researched system.
Conducting a observational study can be done in several ways since it is one of the most flexible research methods [25]. The general process of
implement-ing and adaptimplement-ing this method for the use case is to conduct an observation study. Being able to perform this kind of study, the kind of participant obser-vation was chosen. Participant obserobser-vation can combine several procedures like focus groups, questionnaire or interviews [25]. Since interviews and focus groups are used as individual methods in the papers case study, the technique of usability testing will be used for the observation study. One of the basic conditions for the method is to choose the way of observation. Due to the selected technique the ”observer as participant” was chosen. As being the observer like a participant, the observer is interacting in a limited way with the individual or group of the observation. Asking questions, giving them task or hinting the participants in the right directions, are ways of the lim-ited intercourse with the participants [25]. The chosen style of observation is focal [25]. The focal way of observing means to record all the behaviour as well as they physical properties of the participant in a selected time period. Another aspect which has to be taken in consideration for conducting a observational study is to gain the trust and permission of the participants. The case study in Husqvarna has been conducted over a time period which lasted for months and the observational research has been chosen for being the last method for data collection. Therefore all the participants have been used to the observers and they have been gotten familiar with the topic of the research. The consent of being recorded has been obtained in the beginning of the observation.
As important as it is to get the direct feedback from the user about the usability issues, the user can not always describe where the underlying prob-lem lies. With the observational study it is able to become the fly on the wall and see directly how the user use these systems (in this case the cre-ated artefact), without becoming influenced by the researchers questions and inputs. An observational approach will help the research project to receive the result about the usability issues from a subconscious level [2]. This will be achieved by testing the usability of the systems during the observational study. Since users tend towards executing tasks di↵erently than they are describing. The above mentioned ”fly on the wall” is necessary to identify if the usability issues have been solved with the created artefact.
Design of the Observational Study
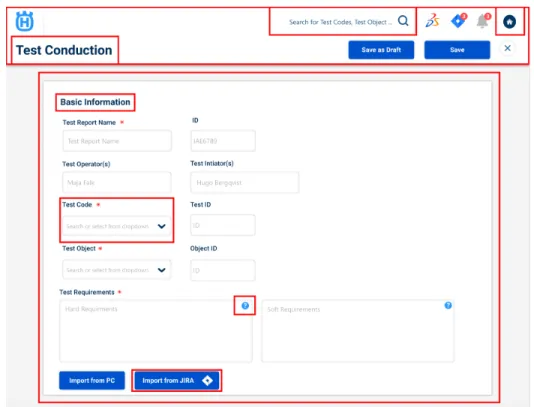
Sev-eral tasks, which required to use an artefact, were given to the participants. The artefact was created on the basis of the interviews and the focus groups. It is a clickable mock-up which imitates a technical data management sys-tem which is tailored to the needs of the case study’s company. Depending on what kind of user the individual participant was, di↵erent assignments have been given to him/her. The tasks were executed on the artefact in the software Figma. Figma is the software in which the artefact was created. The users executed the task in a ”viewing” mode. In this mode they were not able to change or edit factors in the artefact. While executing the tasks, the whole process of the user trying to achieve it has been voice and screen recorded. Each participant has been aware of the topic of the system and has been a participant in the interviews or/and focus groups. Before the observation started, the users have been asked for confirmation about the recording. They have been informed about the way the software in which the prototype has been implemented, works. One observation was scheduled to be two hours in conduction time. In this included, is the explanation of the tasks, the execution of them and the general retrospect feedback of the users. Participants of the Observational Study
For the observational study, participants were recruited. As mentioned in chapter 3.1.5 it is important to have the trust of the participants which are going to be observed. All attendees were part of the interviews or focus groups and did therefore knew the researchers. This eliminated the above mentioned risk of trust issues. Test Operator, Test Responsible, Project Man-ager and Test Method Owner were discovered as the potential main users of the system. The Test Responsible has the same activities in the system as the Test Operator (compare with chapter 4.2.1). Therefore an additional Test Responsible was recruited to validate the actions of the other Test Responsi-ble and Test Operator. This led in the end to five session. One representative of each user group (or two in the case of the test responsible) has been con-tacted through e-mail. They have been reminded about the interview or focus group they have been part of and been asked if they want to take part in testing the artefact. Di↵erent time periods for the sessions have been sug-gested and either accepted or changed by the participant. Each participant has been observed individually.
Tasks of the observational study
be-haviour while executing di↵erent actions, several tasks were given to the users. The detailed level of the tasks varied from general to specific. Having only too broad or too high-in-detail tasks would restrict the user to execute the tasks in the initial way or would allow him/her total uncontrollable free-dom. The tasks have been created to measure, if the usability issues have been solved. Therefore targets each task one or several issues. Table 1 shows which tasks is covering which issue. The main tasks, which every user has accomplished, were:
• Task 1: Find your last comment
• Task 2: How would you search for a specific test report?
• Task 3: How is the test result status for the test report “S˚agning DTEW675”?
• Task 4: Which versions of the completed test reports of the “Jordfr¨as TF325” has Nils Norberg created?
These tasks are user independent and focused on the usability issues of: ”Difficult to generate general overview”, ”Inefficient search”, ”Compromised highlighted important sections” and ”Lack of version control of the data”. The rest of the 16 tasks can be found in the appendix C. The Test Operator is one of the main users who are supposed to work in the system on a daily basis. This user gets assigned to tests by other users like the project man-ager. He/She executes tests and therefore has to enter measurement data and makes the first judgement of the result of the test. The tasks 5,6,7,8 and 9 were given to the Test Operator. Due to the work of the Test Operator and his needs for the systems the tasks were aiming to test if the usability issues of ”Lack of standards for manual data input”, ”Complicated process for manual data input”, ”Incompatible with other necessary systems”, ”Workflow flex-ibility”, ”Compromised highlighted important sections” and ”Complicated process for data input”. Since the tasks of this user are about editing or adding actual data, mainly the issues of the data input and workflow have been examined.
The Test Responsible acts in the same way as the Test Operator but has more rights and therefore has to capture the bigger picture of the test project/ management flow. Therefore this user got the same tasks as the Test Opera-tor but additionally tasks 10,11,12 and 13. The major di↵erence between the
task of the Test Operator and the Test Responsible is that the Test Respon-sible got tasks which are influencing the test projects in either the beginning phase, with e.g. importing requirements, and/or in the final phase like look-ing up the fail/pass rates of test results.
The Project Manager is also responsible for di↵erent actions before and after the test execution, test project progress and test analysis process. Due to that the Project Manager got a slightly di↵erent set of tasks than the Test Responsible. The manager’s tasks were targeted on a more abstracted level. The tasks 10, 12, 13, 14, 15 and 16 were given.
Three additional tasks, compared to the Test Responsible, have been exe-cuted from the Project Manager. Task 14-16 are targeting the issues of ”In-compatible with other necessary systems”, ”Difficult to generate overview”, ”Lack of data visualisation” and ”Workflow Flexibility”. The user role which is feeding the system with test codes and therefore delivers the base for the test executions, test analysis and test projects is the Test Method Owner. He/She provides the first layer of data in the artefact his/her tasks were an intersection of all tasks (e.g. tasks 5,6,9 and 13)
The following table (Table 1) is summarising which tasks were testing which usability issues. The first row represents the actual task with the comple-menting number. The issue of an intuitive user interface has been tested with 1 2 3 4 5 6 7 8 9 10 11 12 13 14 15 16 Lack of standards for manual data input x x
Incompatible withother necessary systems x x
Difficult to generate general overview x x x x
Complicated process for manual data input x x
Lack of version control of the data x x
Compromised highlighted important sections x x x x x
Workflow flexibility x x x x
Lack of data visualisation x x
Intuitive UI is needed x x x x x x x x x x x x x x x x
Inefficient search x
Table 1: Task Issue Overview
every tasks since the interface did not change between di↵erent users or tasks. Parameters of the observational study
fol-lowing measurements were used in the analysis to find out if the usability issues are still existing or not. These measurements/documentation factors were used:
• Time for executing the tasks
• Number and Description of confusion situations • Pass or fail of the task execution
• Path-Documentation of the execution • Amount of clicks
.
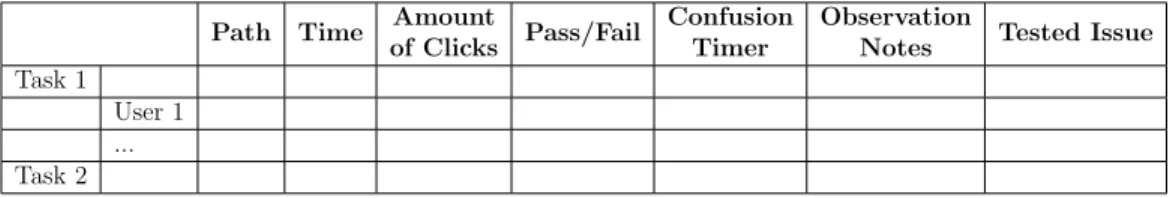
Not every measurement has been taken for every tasks. But for every tasks, the path the user took for executing the task (Path-Documentation) was documented. The situations were the user expressed confusion have been counted and written down for the analysis. How they have been analysed is reported in chapter 4.2.5. The time an user took for executing the task has been taken inter alia as an indicator on how fast the user is able to orientate himself/herself in the artefact. As well as how well the terms and the struc-ture of the system has been chosen. The amount of situations and the actual situation were confusion was expressed by the user, have been taken to iden-tify left usability issues and/or general issues with the concept. The users have been informed about that not they but the artefact is tested. The pass or fail of the execution of the task by the user is a valid factor of measuring if the concept is understandable for them. Since they were also several ways to pass a task a ”pass with remarks” has been implemented in the analysis as well. Since the most usability issues occur due to the misunderstanding of the users way of thinking, documenting the path they took is suppose to help to understand the user better. The last quantitative measurement which was taken in consideration, was the amount of clicks the user took while achieving the task. This measurement helps on account of compar-ing the users among each other and to get a sharper view on how complex the system seems to be for the users. During all those measurements which have been taken during the observation or while analysing the screen- and audio-recordings, the statements the user gave during the process, have been documented and analysed as well.
Path Time Amount
of Clicks Pass/Fail
Confusion Timer
Observation
Notes Tested Issue Task 1
User 1 ... Task 2
Table 2: Observation Schedule
Observation Schedule of the observational study
To create a base on the gathered data, as well as to provide and follow a structure an observation schedule for the observational study has been cre-ated (compare with table 2). Every measurement which was designed to be taken is in the observation schedule included. They serve to be the indica-tors on how well a usability issue has been solved. Since the issues are the main factors for the users, the guidelines which have been used to solve the issues are not included in the observation schedule. For the analysis of the observational study, they have been mapped out towards the issues. Besides the above mentioned measurements, notes which have been taken during the observation are included in the schedule as well. This helps to merge the recorded data with the actual observations from the researchers.
3.2. Data Analysis
In this sub chapter the methods which were used to analyse the collected data, gathered through the previously mentioned research method, will be presented. This will be done by introducing how the data has been analysed on each of the research methods. The techniques for analysing were chosen to fit to the methods which were used for the data collection. For every method which has been analysed, an inductive way has been used. The main idea behind using an inductive approach is to gather data and analyse it to examine the data, to find pattern and themes to follow up and focus on [2]. In general, the goal while analysing the data was to identify relations between the data and the research questions. Furthermore, possible theories should emerge from the collected and analysed data.
3.2.1. Analysis of Literature Review
From the first circle within the hermeneutic framework[3], search and acquisition, into the continuation of the second circle of ”Analysis and Inter-pretation” (see figure 2). The first step of analysis and interpretation starts with mapping and classifying the acquired literature. Afterwards critically assessing the mapped out classified literature followed. This was implemented through reviewing how far previous literature was able to answer the research questions. The short comings of previous literature were addressed, as well as where authors explicitly mentioned where future research can continue on. How arguments and theories has been established the former research has been set as the base for the result of the assessment. If further research problems/questions would be necessary to set, a transition back to the first workflow circle in the hermeneutic circle would have been triggered. By it-erating the whole process once again, sufficient arguments for the research area would be established.
During the analysis and interpretation of the acquired literature, was started with the mapping and classifying of the literature based on the set keywords (Usability issues, TDMS, usability guidelines etc. ). As the literature review was used for building the first level for answering the second research ques-tion, we critically assessed based it on that. This was performed, which was stated previously, by looking into how far the previous literature was able to answer the question based on the keyword classes.
3.2.2. Analysis of Interviews
The interviews were conducted to gather qualitative data. The intention was to get an deeper understanding about the test management process in Husqvarna and how the future users of the system work. To find the first needs of those users, the interviews have been conducted. As the inductive approach takes a red thread in the research of this paper, an inductively based analytically procedure has been used for the analysis of the interviews. The approach of the analysis method of ”Grounded Theory” has been used for analysing the interviews. Since the intention is to build a theory based on the data, the process of Grounded Theory is suitable for the analysis. The theories which are being build with the interviews are to state the functional and non-functional requirements within the Husqvarna company.
selective coding [2]. The first action which has been taking was to transcribe the interviews. All ten interviews were transcribed manually. The recorded sessions have been listed for each question section. The sections have been written down (word for word). Not only what the participants said, but also how they said it has been documented during the transcribing process. When an interviewee has enhanced a fact or put emphasise on it, the a↵ected section has been put in bold letters to highlight the statement. The distinc-tion between the interviewee and the interviewer has been made clear with adding the names in front of each the statements.
After the transcription, the process of open coding has been conducted. Open coding follows the structure as categorisation and unitisation [2]. First of all, the data has been categorised which includes the practice of developing cat-egories and assigning them to di↵erent chunks of the data. For creating the di↵erent labels of the categories, the main statements of the di↵erent chunks has been highlighted. This helped to emerge the terms for the categories from the actual data and actually ”copying” possible terms which have been used by the participants (”in vivo” codes) [2]. While implementing the sec-tioning, it has always been taken in consideration, to have meaningful terms. The terms have been chosen in the manner that they are meaningful for the data but also highly-valued for the relation to the other categories. For sim-plistic reasons the terms have been kept as precise as possible to be able to easily visualise the data. Visualising the data is another helpful technique for analysing qualitative data. It helps to be able to see and create relationships in a more efficient way [2]. Another reason for that, was to unitise the data in a visual way . Unitising data is the method of assigning the chunks of data to their categories [2]. The whole process of open coding enabled to indicate patterns and issues, which the interviewees had and helped the researchers to focus on them. After the open coding, the researchers concluded this part of the analysis with ten di↵erent categories. Under those categories the state-ments which overlapped and have been mentioned by every interviewee have been assigned to. These data chunks are detailed explained in Section 4.1.1. The result of the axial coding delivers the relation between the di↵erent cate-gories. Furthermore, it underlines the hierarchical order of the categories [2]. While applying the method, the question of why the categories (therefore the issues) have been mentioned, has been asked. As well as how they are a↵ecting the daily work life of the interviewee. This helped to find out the
axial relations and therefore which ones have to be higher in hierarchy. Since the evaluation and analysing of the interviews has taken several weeks the di↵erent priorities and relations have gone through several changes. This is described as selective coding in the grounded theory analysing method [2]. Even though the main intention of the analysis of qualitative data in the grounded theory is to emerge a theory from the collected data. We adapted the approach to our already existing research questions. The research ques-tions didn’t imply directly a theory and therefore this method of analysing has been chosen to create theories to be able to answer the research questions with it.
3.2.3. Analysis of Focus Groups
The focus group method was used to further collect qualitative data. The intention of using the focus groups method was to analyse if the artefact had solved the identified usability issues. This was a part of the second research question. Continuing the red thread through this paper an inductive ap-proach have been applied to analysing the focus group data; Same as in the interviews.
The analysis method of Grounded Theory has been applied again to analysis the focus group data results. The theories, which will be built from the data result, indicates how the artefact has solved the usability issues. A base of theories had been built during the analysis of the interviews. The analysis of the focus groups continues to develop those theories. Only open coding was used during the coding of the focus group data. As mentioned in chapter 3.1.4, the focus groups were voice-recorded. Unlike the interviews, the focus groups were not transcribed word by word. The reason for this were time constrains within the project. The two focus group sessions were transcribed with a data sampling transcription method. Data sampling transcription was conducted while listening to the recorded sessions. Only transcribing and highlighting in the recorded session is pertinent to the research [2]. This method comes with some potential problems. Certain things may be missed during the process and the recordings need to be listen at least twice [2]. This problem has been eliminated, as during the transcription each researcher lis-tened through the recording and transcribed the relevant sections. After both the researchers have transcribed the audio, the two transcriptions were compared and merged. Same as the in transcription the enhanced facts and
statements were put in bold to highlight the importance. Comments such as what the participants enjoyed and what they disliked about the artefact were highlighted for further analysis [4]. The distinction between the interviewee and the interviewer as been made clear with the process of putting the names in front of the statements. Highlighting enhanced facts and statements built the chunks of data.
3.2.4. Analysis of Observational Study
The observational study technique was used to test if the created arte-fact, which is based on usability guidelines, solves the usability issues within TDM systems. It is a technique where qualitative and quantitative data can be produced, depending on the execution of the research [25]. The data was gathered through voice and screen recording as well as taking notes during the user observation. As in the other two methods (interviews and focus groups) the voice recorded data was transcribed to be able to analyse it. Since the observation of the user was initiated through di↵erent tasks, which were given by the researchers, the analysis of the gathered data was focused on how the users perform these tasks. The analysis of the voice recorded data was conducted in the same process as the analysis of the focus groups (compare with chapter 3.2.3). The data was sampled during the transcrip-tion and to avoid the possibility of missing out content, the data sampling for each observation was conducted by both researchers. The transcription was conducted simultaneously with the screen recording. Since the participants expressed opinions about certain circumstances while using the artefact, the actual context with the comment of the user was important. The data sam-pling supported and commented the situation where the opinion and state-ments were raised.
After the data sampling part of the analysis the results were compared to find patterns. For this purpose the analysing method of open and axial coding were used [25]. This was di↵erently used than in the two other methods be-fore. The patterns were matched to the tasks which were given. The ideology of the coding was still follow but only matched to already existing categories. The screen recordings have been separately analysed as well. They were not only supportive for the qualitative analysis of the voice recording but also to create quantitative data. With the quantitative data the intention was to enable a quantitative way of evaluating if the artefact solved the usability issues or not. Therefore di↵erent measurement have been determined before