The intracellular lipid-binding domain of human
Na
+
/H
+
exchanger 1 forms a lipid-protein
co-structure essential for activity
Ruth Hendus-Altenburger
1,2
, Jens Vogensen
2
, Emilie Skotte Pedersen
1
, Alessandra Luchini
3
,
Raul Araya-Secchi
3
, Anne H. Bendsoe
1,2
, Nanditha Shyam Prasad
2
, Andreas Prestel
1
, Marité Cardenas
4
,
Elena Pedraz-Cuesta
2
, Lise Arleth
3
✉
, Stine F. Pedersen
2
✉
& Birthe B. Kragelund
1
✉
Dynamic interactions of proteins with lipid membranes are essential regulatory events in
biology, but remain rudimentarily understood and particularly overlooked in membrane
proteins. The ubiquitously expressed membrane protein Na
+/H
+-exchanger 1 (NHE1)
reg-ulates intracellular pH (pH
i) with dysregulation linked to e.g. cancer and cardiovascular
diseases. NHE1 has a long, regulatory cytosolic domain carrying a membrane-proximal region
described as a lipid-interacting domain (LID), yet, the LID structure and underlying molecular
mechanisms are unknown. Here we decompose these, combining structural and biophysical
methods, molecular dynamics simulations, cellular biotinylation- and immuno
fluorescence
analysis and exchanger activity assays. We
find that the NHE1-LID is intrinsically disordered
and, in presence of membrane mimetics, forms a helical
αα-hairpin co-structure with the
membrane, anchoring the regulatory domain vis-a-vis the transport domain. This co-structure
is fundamental for NHE1 activity, as its disintegration reduced steady-state pH
iand the rate of
pH
irecovery after acid loading. We propose that regulatory lipid-protein co-structures may
play equally important roles in other membrane proteins.
https://doi.org/10.1038/s42003-020-01455-6
OPEN
1Structural Biology and NMR Laboratory, Department of Biology, University of Copenhagen, Ole Maaløes Vej 5, DK-2200 Copenhagen N, Denmark.2Cell Biology and Physiology, Department of Biology, University of Copenhagen, Universitetsparken 13, DK-2100 Copenhagen Ø, Denmark.3Niels Bohr Institute, University of Copenhagen, Universitetsparken 5, 2100 Copenhagen Ø, Denmark.4Biofilms Research Center for Biointerfaces, Malmö University, Per Albin Hanssons Väg 35, 214 32 Malmö, Sweden. ✉email:arleth@nbi.ku.dk;SFPedersen@bio.ku.dk;bbk@bio.ku.dk
123456789
M
echanistic understanding of membrane proteins has
increased tremendously in recent years due to structural
insights facilitated by the improvements of cryoEM
resolution. In addition to the highly structured regions amenable
to such analyses, intrinsically disordered N- and C-terminals
appear frequently in the human transmembrane proteome
1. Such
intrinsically disordered regions (IDR) play key roles in membrane
protein function
2, thus adding an additional layer of complexity
to the mechanistic understanding of these proteins. IDR in
membrane proteins can be hundreds of residues long
1, but they
are absent or silent in most structure studies and generally
neglected in the understanding of function. While disordered
regions in isolation can be studied and understood at the atomic
level
3, recent studies have shown that IDRs in membrane proteins
engage in interactions with the membrane
4–7, often of dynamic
nature, constituting a huge methodological challenge.
Further-more, changes in membrane composition are emerging as
physiological and pathophysiological relevant mechanisms
mod-ulating membrane protein function
8–10. Collectively, this shows
the necessity of uncovering how disordered regions in membrane
proteins cross-talk with and engage in lipid:protein co-structures
relevant to function.
The Na
+/H
+-exchanger isoform 1 (NHE1, SoLute Carrier 9A1
(SLC9A1)) is a membrane protein with long IDRs, and is a major
regulator of intracellular pH (pH
i) in essentially all mammalian
cells studied. NHE1 is activated by intracellular acidification, as
well as by cytokines, growth factors, osmotic cell shrinkage, and
cell-matrix adhesion
11,12. NHE1 dysregulation has been linked to
several pathological conditions, with particularly important roles
in cardiovascular diseases and cancer
12–14. The transmembrane
domain of NHE1 is mandatory for ion transport, whereas its
∼300-residue long, regulatory C-terminal cytosolic tail (ct)
con-trols the pH
iset point of the transporter and is required for
allosteric NHE1 regulation
11,12,15. The tail serves as an interaction
hub for many binding partners including constitutively bound
calcineurin homologous proteins (CHPs)
16–18and harbors
sev-eral predicted and confirmed regulatory phosphorylation sites
11.
Deletion of most or all of the NHE1ct strongly reduces ion
transport activity, and shifts activation of NHE1 by protons to
more acidic values
15,19.
The NHE1ct can be divided into four structural subdomains
(subdomains A-D)
11largely corresponding to four previously
described functional domains
20. Subdomain A and C are
pre-dicted to be helical and to recruit most of the confirmed
interaction partners, whereas B and D, located between the two
folded domains and at the distal tail, respectively, have high
scores for intrinsic structural disorder, properties that were
confirmed experimentally for the distal 130 residues
21,22. The
proximal third of subdomain A corresponding to R516-G539 in
the human (h)NHE1, forms an
α-helix in complex with CHP1,
−2 or −3
16,17,23. However, molecular details of the structure,
dynamics and interactions of the remaining two-thirds of
subdomain A are lacking, hampering understanding of the
function of this domain.
The activity of NHE1 is dependent on different types of lipophilic
compounds, including ATP
24,25and various phosphoinositides
26,27.
In the hNHE1ct, two phosphatidylinositol-4,5-bisphosphate (PI
(4,5)P
2)-binding sites have been identified in subdomain A:
KKKQETKR
509-516(site I) and RFNKKYVKK
552–560(site II),
flanking the CHP binding site
27. The abundance of [KR]-residues
and the hydrophobic character of the surrounding residues bears
resemblance to other [KR]-motifs involved in phosphoinositide
binding
2,28. The functional importance of NHE1:PI(4,5)P
2inter-action was underscored by the
finding that in kidney glomerular
injury, accumulating amphipathic long-chain acyl-CoA (LC-CoA)
metabolites competed with PI(4,5)P
2for NHE1 binding, leading to
reduced NHE1 function and consequent increased susceptibility of
proximal tubule cells to apoptosis
8.
The reported lipid-binding portfolio of the hNHE1ct includes
several negatively charged membrane lipids, ranked here by their
apparent affinities: phosphatidylinositol (3,4,5)-trisphosphate (PI
(3,4,5)P
3) > phosphatidylinositol-bisphosphates
(PI(3,4)P
2,
PI
(4,5)P
2) > and -monophosphates (PI)
≈ phosphatidic acid (PA) >
phosphatidyl serine (PS)
26. The second PI(4,5)P
2-binding site
plus an additional 46 residues, G542–P598, interacts with phorbol
esters /diacylglycerol (PEs/DAG) in a transport regulatory
man-ner enhancing membrane interaction
29, and binds ATP in
com-petition with PI(4,5)P
230,31. This region was accordingly defined
as the lipid interaction domain of NHE1, i.e. the NHE1-LID. The
NHE1-LID-phospholipid interaction was shown to be pH
dependent in a manner relying on a cluster of histidine residues
between the PI(4,5)P
2binding sites
32, and membrane interaction
was suggested to be mainly electrostatically driven
26. The
C-terminal tail of the related isoform SLC9A3 (NHE3) also interacts
with membrane lipids
33,34, supporting a general role for
mem-brane interaction in the SLC9A family. However, the molecular
details of the membrane interaction, including its structure and
potential conformational changes in response to changes in
membrane composition and other local microenvironmental
changes, as well as the driving forces and sequence determinants
for the interaction, remain essentially unstudied.
Here, we decompose the structure of the hNHE1-LID
con-stituting residues G539-G593 (hereafter denoted NHE1-LID
539-593).
We delineate two structurally distinct but integrated sub-regions
of the NHE1-LID, which, in absence of negatively charged
membrane mimetics, are intrinsically disordered. In the presence
of negatively charged lipids, NHE1-LID forms a folded, helical
co-structure with the membrane, organizing itself in a dynamic
helix-hairpin-helix (αα-hairpin) conformation with the
hydro-phobic, most C-terminal part penetrating into the headgroup
region of the lipid bilayer. Disintegration of the NHE1-LID
structure strongly inhibits NHE1-mediated recovery of pH
iafter
an acid load. This structure and its sensitivity to membrane lipid
composition and to physico-chemical factors such as pH make
the NHE1-LID central to understanding NHE1 regulation. We
propose that such membrane:protein co-structures are likely to
be important for many other membrane proteins with IDRs and
relevant to their regulation.
Results
The NHE1-LID is intrinsically disordered with two transiently
populated
α-helices. Despite many investigations underscoring
the relevance of various lipids for NHE1 function, and the
pre-vious identification of the NHE1-LID as a key region for NHE1
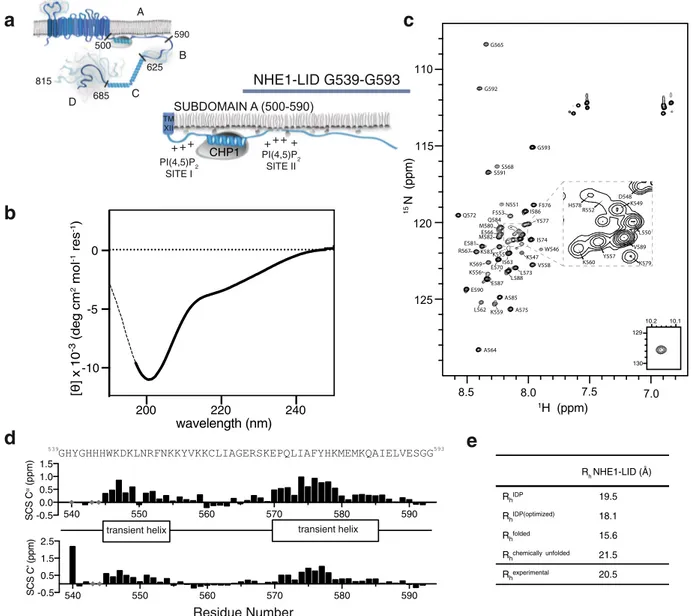
regulation, no structural data exist for this part of NHE1 (Fig.
1
).
To enable atomic resolution insight, we employed an ensemble of
biophysical methods to delineate the structural properties of the
55-residues long NHE1-LID from hNHE1, encompassing
resi-dues G539-G593 (NHE1-LID
539-593). The borders of the
NHE1-LID
539-593were chosen from a structural perspective, starting just
after the CHP1-binding helix (N-terminally), and ending before
the disordered subdomain B (C-terminally), Fig.
1
a.
Produced in isolation, NHE1-LID
539-593was highly prone to
aggregation in phosphate buffer, in the presence of salt, or at a pH
above 6.5. It only stayed in solution in 20 mM borate buffer, pH
≤6.4 or in pure water. Under these conditions, far-UV circular
dichroism (CD) spectroscopy analysis of NHE1-LID
539-593revealed a dominantly disordered chain with very low content
of helical structures, as evident from the negative molar
ellipticity at 200 nm and 222 nm (Fig.
1
b). Supporting this, the
NHE1-LID
539-593showed low dispersion of signals in the proton
dimension (Fig.
1
c), another characteristic of a disordered
protein.
To identify the location of transient secondary structures,
which can be extracted from an NMR chemical shift analysis
35,36,
the NMR resonances of the NHE1-LID
539-593backbone atoms
were assigned (86% coverage) and secondary chemical shifts
(SCSs) calculated for C
αand C’ nuclei using peptide-based
random coil shifts
35,36. From the consecutive positive SCSs
(Fig.
1
d), two regions of transient
α-helical structure, each
populated by 20–30%, were identified: H540-F554 and E570-I586
(Fig.
1
d). Finally, the hydrodynamic radius, R
hof NHE1-LID
539-593
was determined from NMR diffusion measurements.
Com-pared to theoretical values calculated for a chain of different
properties
37, NHE1-LID
539-593
had an expanded dimension
expected for an IDR (Fig.
1
e).
Taken together, these data show that the LID region of NHE1
is disordered in the absence of lipids and that its solubility is
highly sensitive to changes in ionic strength and pH. The
disordered region populates two transient
α-helices in an overall
largely extended chain.
Subdomain A of NHE1ct interacts with a broad range of lipids.
To determine if the NHE1-LID
539-593constitutes the major lipid
interaction region of NHE1ct and to address its lipid specificity,
we recombinantly produced two NHE1ct variants; NHE1
503–595(subdomain A) and NHE1
503–698(subdomain A-C). These
proteins were produced in complex with the obligatory
NHE1 binding partner CHP1 as this increased solubility. In lipid
overlay assays, CHP1/NHE1
503–595/698bound to essentially all
negatively charged lipids tested, including mono-, bis-, and
tri-phosphoinositides as well as to PS, PA, and lyso-PA (LPA),
Fig.
2
a, b. There were no apparent qualitative differences in lipid
binding between the two NHE1ct length variants, and although
subdomain B and C may also be able to bind the same lipids, the
complete lipid binding profile is fully represented by subdomain
A. Increasing pH from 7.2 to 8.2 abolished binding to PS and
10.1 10.2 129 130 G565 G592 G593 S568 S591 N551 Q572 F576 I586 Y577 W546 I574 V558 A585 A575 A564 E590 K559 L562 L573 L588 E587 K556 E581 R567 K583 K569 K555 M582E566 M580Q584 F553 E570I563 K547 K560 Y557 K579 V589 L550 D548 K549 R552 H578 15 N (ppm ) 1H (ppm) 7.0 7.5 8.0 8.5 125 120 115 110 200 220 240 -10 -5 0
wavelength (nm)
[ ] x 10 -3 (deg cm 2 mol -1 res -1)a
b
d
c
Rh NHE1-LID (Å) RhIDP 19.5 RhIDP(optimized) 18.1 Rhfolded 15.6 Rhchemically unfolded 21.5 Rhexperimental 20.5e
CHP1 PI(4,5)P2 SITE I PI(4,5)P2 SITE IINHE1-LID G539-G593
+ + + ++ ++ 685 625 500 590 TM XII A B C D SUBDOMAIN A (500-590) 815 GHYGHHHWKDKLNRFNKKYVKKCLIAGERSKEPQLIAFYHKMEMKQAIELVESGG 539 593 540 550 560 570 580 590 -0.5 0.0 0.5 1.0 1.5 SCS C α (ppm) 540 550 560 570 580 590 -0.5 0.5 1.5 2.5 S C S C’ (ppm )Residue Number
570 580 550transient helix transient helix
Fig. 1 The NHE1-LID is intrinsically disordered. a Schematic architecture of human NHE1 indicating the subdomains A-D in the tail and with a zoom on the lipid interaction domain (LID) within subdomain A.b Far-UV CD spectrum of the NHE1-LID539-593in H2O, pH 6.0.c15N,1H-HSQC spectrum of
NHE1-LID539-593in the absence of membrane mimetics (pH 6.4).d Secondary chemical shifts (SCS) of Cαand C’ from backbone assignments of NHE1-LID
showing two transient and lowly populated helices.e Radius of hydration,Rhof NHE1-LID539-593from different scaling laws37and experimentally
LPA LPC PI PI(3)P PI(4)P PI(5)P PEA PC S1P PI(3,4)P2 PI(3,5)P2 PI(4,5)P2 PI(3,4,5)P3 PA PS blank ---A--AA--AA--- -K--KKK---500RPLVDLLAVKKKQETKRSINE520 539GHYGHHHWKDKLNRFNKKYVKKCLIAG565 ---AAA---AA----
-Q--QQQ---PI(4,5)P2 - SITE I PI(4,5)P2 - SITE II
SITE I (A5) SITE II (A5) SITE I+II H4K H4Q ---AAA---AA---- --- ---A--AA--AA--- +++ ++ + +++ + ++ ++ LPA LPC PI PI(3)P PI(4)P PI(5)P PEA PC S1P PI(3,4)P2 PI(3,5)P2 PI(4,5)P2 PI(3,4,5)P3 PA PS blank LPA LPC PI PI(3)P PI(4)P PI(5)P PEA PC SITE I A5 SITE II A5 SITE I+II H4K H4Q CHP1/ NHE1503-698 WT CHP1/ NHE1503-595 CHP1/NHE1503-595 variants pH 7.2 pH 8.2 A A
a
b
c
d
e
f
g
h
GHYGHHHWKDKLNRFNKKYVKKCLIAGERSKEPQLIAFYHKMEMKQAIELVESGG
H1
H2
S1P PI(3,4)P2 PI(3,5)P2 PI(4,5)P2 PI(3,4,5)P3 PA PS blank-15
-5
[ ] x 10 -3 (deg cm 2 mol -1 res -1) LID LID:DHPC LID:DMPC:DHPC 200 220 240 wavelength (nm) 200 220 240 -15 -5 wavelength (nm) [ ] x 10 -3 (deg cm 2 mol -1 res -1) LID LID:LPPG LID:DMPG:DMPC:DHPC 15 N (ppm ) 1H (ppm) 7.0 7.5 8.0 8.5 105 110 115 120 125 10.3 10.4 129 130 G565 G542 G592 G539 G593 H578 S591 M580 K555 N554 R552 E581 I586 A575 A564 A585 L588 E587 E590 K583 Y541 Y577 Q584 F576 V589 F553 K579 M582540
550
560
570
580
590
-1
0
1
2
3
4
SC
S C
α(ppm)
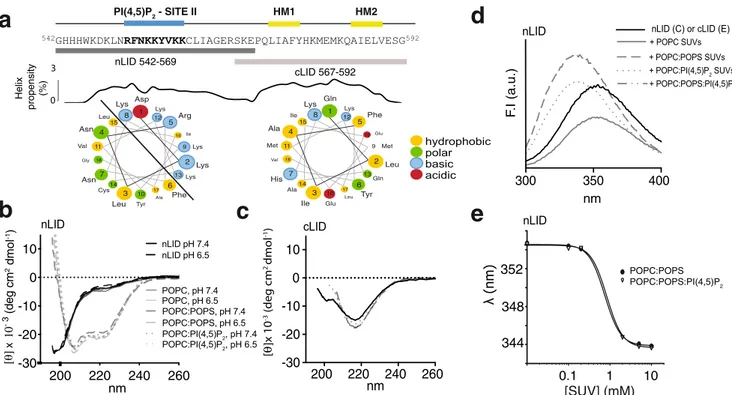
Fig. 2 The NHE1-LID binds different lipids with induction of helical structures. a Position of individual lipids on the dot blot membrane. b Lipid binding profile of the CHP1/NHE1503-595and CHP1/NHE1503-698at pH 7.4 and 8.4.c Variants of NHE1 used to test lipid binding specificity. d Effect of various
mutations on CHP1/NHE1503-595lipid binding.e Far-UV CD spectra of NHE1-LID539-593in DHPC detergent (color) and in DMPC:DHPC bicelles (dashed
color). The CD spectrum of NHE1-LID539-593in water is shown in black.f Far-UV CD spectra of the NHE1-LID in anionic bicelles consisting of DMPG:
DMPC:DHPC (dashed color) and in 2% LPPG (color). The CD spectrum of NHE1-LID539-593in water is shown in black.g15N,1H-HSQC spectrum of
LPA, but retained binding to all other tested lipids, suggesting a
low lipid specificity of the NHE1-LID and a pH sensitivity
towards only certain lipids (Fig.
2
b). Notably, given their pKa
values outside the tested pH range, the protonation state of PS
and LPA does not change, indicating that the observed change in
binding is to be found on the protein level. To delineate if the two
known PI(4,5)P
2-binding regions
27and the histidine rich stretch
(HYGHHH
540–545)
32were required for lipid binding, we prepared
five variants of NHE1
503–595in which each site was mutated
individually, using alanine substitution of the basic residues of the
two PI(4,5)P
2-binding sites and glutamine or lysine substitutions
of the histidines (Fig.
2
c). Neither mutations of the basic clusters
individually or in combination, nor mutations of the histidines,
abolished lipid binding. Yet, the mutations reduced the apparent
binding to phosphatidylinositol bis- and tri-phosphates, as well as
to PS, whereas binding to phosphatidylinositol mono-phosphates
was almost unaffected (Fig.
2
d). Thus, mutation of the positive
charges did not abolish binding, but changed lipid preference.
Furthermore, changing the charged state of the histidine cluster
by mutations to either lysine (H4K) or glutamine (H4Q) had the
same abolishing effect on the binding to LPA, PS and the
phos-phatidylinositol bis- and tri-phosphates, pointing towards a
spe-cific interaction (Fig.
2
d). As many differently charged lipid
species are recognized by NHE1-LID, with variable sensitivity to
changes in pH, charge, and mutations, this also suggests that
electrostatics alone cannot fully account for the interaction
profile.
These results confirm that the main lipid binding ability of
NHE1ct resides in subdomain A, i.e., residues 503–595. The
broad lipid specificity demonstrated here supports earlier findings
but further suggests that binding only partially depends on
electrostatics. Moreover, changes in pH as well as the protonation
state of the NHE1-LID modulated lipid species preference.
The NHE1-LID
539-593interacts with anionic membranes and
forms helical structures. We next used CD spectroscopy to
inves-tigate if and how various detergents, lipids and membrane mimetics
would affect the secondary structure of NHE1-LID
539-593. To allow
us to assess lipid/detergent sensitivity as well as impact on variations
in structural propensity, a variety of membrane mimetics were
employed. Addition of zwitterionic
1,2-dihexanoyl-sn-glycero-3-phosphocholine (DHPC) detergent micelles to NHE1-LID induced
the formation of distinct helical structure, populated on average
∼20% as judged from the increased negative ellipticity at 208 nm
and 222 nm (Fig.
2
e). A similar, albeit less populated helical
structure formed when zwitterionic bicelles composed of DHPC:
1,2-dimyristoyl-sn-glycero-3-phosphocholine (DMPC) mixtures
were used (Fig.
2
e). Introducing negatively charged lipids in
these bicelles in the form of
1,2-dimyristoyl-sn-glycero-3-phos-phorylglycerol (DMPG) (DMPC:DMPG at 70:30 mol%) further
changed the structure of the LID
539-593(Fig.
2
f). Compared to
the CD profile in Fig.
2
e, DMPG increased the helical
popula-tion to
∼40% and caused the θ
222nm/θ
208nmratio to become > 1.
The latter is indicative of formation of coiled-coil structure
38compatible with a helix-hairpin-helix (αα-hairpin) structure,
but could also reflect signals stemming from two aromatic
sides in a particular orientation (T-stack)
39, or a combination of
the two.
As bicelles are not readily compatible with optimal NMR
analyses, we next sought to identify a suitable detergent that
would induce the formation of similar helical content in
NHE1-LID. In 2% (w/v)
1-palmitoyl-2-hydroxy-sn-glycero-3-phospho-glycerol) (LPPG), a detergent used successfully for NMR analyses
of membrane proteins
40, the helicity of NHE1-LID was
compar-able to that in anionic bicelles, albeit the
θ
222nm/θ
208nmratio was
below one and less compatible with the coiled-coil structure
(Fig.
2
f). To optimize the resolution in the NMR spectra we
adjusted the temperature to 320 K. The NMR signals of the
NHE1-LID in the presence of LPPG were clearly upfield shifted
(lower ppm) compared to the absence of LPPG (Supplementary
Fig. S1) and were broader indicating dynamic helical structures
(Fig.
2
g). Although many of the signals in the triple resonance
spectra were very weak as a result of dynamics, we achieved
assignment of 49% of the backbone atoms in 2% LPPG (Fig.
2
h)
with SCSs of the C
αand C’ indicating strongly stabilized helical
structures in the membrane bound state of NHE1-LID (SCS > 3
ppm). Positive SCSs indicated a helical region spanning
H545-K579, but because of the lack of signals in the triple resonance
spectra, we were unable to determine the remaining helix borders.
Residues AG
563–564had a lower SCS of C
αof 0.8 ppm, suggesting
that they populate a turn structure
41. A smaller population (< 5%)
of lower helix propensity was observed for residues in the very
C-terminal end of the NHE1-LID (A584-E590).
Collectively, these results indicate that membrane association
induces a helical folded state of NHE1-LID
539-593and that the
helix population is increased by anionic lipids. More realistic
membrane model systems as bicelles further stabilized the
helicity, suggesting the formation of an
αα-hairpin structure that
remained dynamic on the membrane.
The NHE1-LID
539-593is an interdependent entity with
bipar-tite behavior. We next explored the individual contributions of
the identified N- and C-terminal helical regions to the properties
of the NHE1-LID
539–593. Two overlapping peptides were designed
and denoted nLID (G542-K569) and cLID (R567-G592) (Fig.
3
a).
Helical wheel representations predicted a strong amphipathic
character of nLID
542–569with basic residues localizing to one side,
in marked contrast to the overall hydrophobic cLID
567–592. The
nLID contains the basic residues involved in the site II PI(4,5)P
2binding site, while the cLID contains two hydrophobic motifs
LIAFY
573–577(HM1) and AIELV
585–589(HM2) (grand average for
hydropathy (GRAVY) score for the entire NHE1-LID
542–592:
−0.89; for LIAFY
573–577: 2.32 and for AIELV
585–589: 2.16
42(Fig.
3
a)).
In the absence of lipids, nLID
542–569was fully water soluble and
highly disordered with a minimum CD ellipticity at 190 nm and
no shoulder at 222 nm (Fig.
3
b). In marked contrast, cLID
567–592was only soluble at very low concentrations and displayed a
mixed CD profile of coil and β-strand conformation with a broad
minimum at 216 nm (Fig.
3
c). This points towards an aggregated
state of the isolated cLID
567–592, fully consistent with its overall
hydrophobic nature. This suggests that the NHE1-LID in its
entirety has an internal chaperone function such that the more
soluble nLID solubilizes the less soluble cLID, preventing
formation of non-native, aggregated structures.
We next addressed how nLID
542–569and cLID
567–592would
respond to the presence of membrane mimetics. The most
abundant cellular lipid,
1-palmitoyl-2-oleoyl-glycero-3-phospho-choline (POPC), was used as template to study the effect of less
abundant negatively charged lipids. Among the different lipids
seen to interact with NHE1-LID in the lipid overlay assays, we
chose two negatively charged and more abundant lipids in the
inner leaflet of mammalian plasma membranes,
1-palmitoyl-2-oleoyl-glycero-3-phosphoserine (POPS) and
phosphatidylinosi-tol-4,5-bisphosphate PI(4,5)P
2. No change in the CD profile of
nLID
542–569was observed upon addition of small unilamellar
vesicles (SUVs) made solely of POPC, as expected. Instead, the
presence of 20 mol% POPS, or/and 1 mol% PI(4,5)P
2, induced a
dominant
α-helical CD profile (Fig.
3
b). No distinct additive
effect was observed for SUVs containing both PI(4,5)P
2and
POPS. In the same samples, the intrinsic
fluorescence of W546 of
nLID increased in intensity and blue-shifted from 354 nm to 339
nm upon addition of SUVs containing either POPS or PI(4,5)P
2,
indicating transition of W546 into a less polar environment
(Fig.
3
d). The apparent affinity of nLID for POPC/POPS SUVs
was extracted from a titration series with an nLID concentration
of 30
μM and increasing lipid concentration (Fig.
3
d). We noted
strong clouding within the transition phase (from 0.5 to 5 mM
lipids) that resolved by further lipid addition, indicating
temporary aggregation. A global
fit of the fluorescence data gave
an apparent affinity (K
dapp) of 0.8 ± 0.1 mM of nLID for POPC/
POPS (Fig.
3
e). However, the affinity of the entire LID in cellular
context is most likely higher, given the additional hydrophobic
residues of the cLID, the anchoring of the LID to the membrane
by the TM domain, and the natural composition and curvature of
the plasma membrane.
As the pH range of NHE1 activation (<pH 7.0)
12is similar to
the range in which PI(4,5)P
2is known to titrate
43,44and the nLID
contains four histidines, the NHE1-LID could potentially serve as
a pH sensor via membrane constituents, as indeed previously
shown for the histidine cluster (HYGHHH
540–545) in a cellular
context
32. However, the CD spectra of nLID in the presence of
SUVs of various lipid-content were largely independent of
changes in pH from 4.7 to 8.4 with a slight decrease (∼10%) in
helicity below pH 6 (Fig.
3
b, Supplementary Fig. S2). This
indicates that the nLID
542–569stays dominantly helical
indepen-dent of the pH changes within the physiological range that would
normally activate NHE1
12.
When investigating the cLID
567–592in the presence of various
SUVs (Fig.
3
c) we observed no changes in average secondary
structure. In all cases the structural profile remained reminiscent
of an aggregated
β-structure, with a minimum at 218 nm which
became even more pronounced upon addition of negatively
charged lipids.
These results highlight the markedly different properties of the
two parts of NHE1-LID in vitro and show that the solubility,
structure and membrane interaction of the hydrophobic C-terminal
LID, cLID
567–592, are strongly dependent on the presence of the
amphipathic N-terminal region of the NHE1-LID
539-593.
Further-more, membrane interaction of the nLID
542–569is mediated by
negatively charged lipids and leads to the formation of a
pronounced helical structure, which is not detectably altered by
changes in pH.
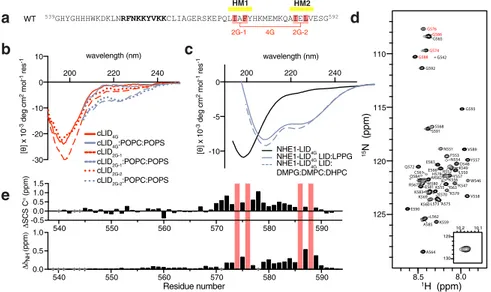
Hydrophobic residues drive membrane-induced structures of
the C-terminal part of the NHE1-LID. The presence of
β-structure in the cLID
567–592correlated with a localized high
aggregation propensity predicted by TANGO (LIAFY
573–577)
(Supplementary Fig. S3). To determine how to remove this
aggregation propensity while preserving helicity and
suppres-sing
β-strands, we scanned different combinations of residues
in silico. Based on this analysis, we chose the mutations I574 G,
F576G, I586G, L588G in HM1 and HM2 (hereafter 4G variants;
Fig.
4
a, Supplementary Fig. S3) and introduced them both in
the cLID
567–592(cLID
567–592–4G) and NHE1-LID
539-593(NHE1-LID
539-59-4G).
The cLID
567-592-4Gwas highly soluble and showed a typical
CD-profile of a mainly disordered peptide, which was completely
insensitive towards the addition of liposomes (Fig.
4
b). However,
in cLID
567–592variants with individually mutated hydrophobic
pairs, denoted cLID
567-592-2G-1(I574G, F576G) and cLID
567-592-2G-2(I586G, L588G), addition of anionic liposomes induced a
shoulder at 222 nm for both peptides (Fig.
4
b) meaning some
200
220
240
260
-30
-20
-10
0
10
nLID pH 7.4 nLID pH 6.5 POPC, pH 7.4 POPC, pH 6.5 POPC:POPS, pH 7.4 POPC:POPS, pH 6.5 POPC:PI(4,5)P2, pH 7.4 POPC:PI(4,5)P2, pH 6.5 [ ] x 10 -3 (deg cm 2 dmol -1)nm
nLID 542-569 cLID 567-592 542GHHHWKDKLNRFNKKYVKKCLIAGERSKEPQLIAFYHKMEMKQAIELVESG592 cLID 567-592 Helix propensity (%) 3 0200
220
240
260
-30
-20
-10
0
10
nm
[θ] x 10 -3 (deg cm 2 dmol -1)300
350
400
nLIDa
c
nLID (C) or cLID (E)
+ POPC:POPS:PI(4,5)P2 + POPC:POPS SUVs + POPC SUVs + POPC:PI(4,5)P2 SUVs F .I (a.u.)
[SUV] (mM)
0.1
1
10
λ (nm)
352
344
348
POPC:POPS POPC:POPS:PI(4,5)P2 nLIDb
d
e
nLID cLIDnm
HM1 HM2 PI(4,5)P2 - SITE II 2 1 3 4 5 6 7 8 9 10 11 12 13 14 15 16 17 18 Asp Lys Leu Asn Arg Phe Asn Lys Lys Tyr Val Lys Lys Leu Ile Cys Gly Ala 2 1 3 4 5 6 7 8 9 10 11 12 13 14 15 16 17 18 Gln Leu Ile Ala Phe Tyr His Lys Met Glu Met Lys Gln Ile Glu Ala Val Leu hydrophobic polar basic acidicFig. 3 A bipartite structure of the NHE1-LID. a Sequence of the NHE1-LID with indicated peptide regions corresponding to nLID542-569and cLID567-592and
with Agadir prediction of helicity and helical wheel representations94. The basic PI(4,5)P
2Site II (blue) and hydrophobic motifs (HM1, HM2) (yellow)
indicated above.b Far-UV CD spectra of nLID542-569alone and in the presence of various lipids and at two different pH values.c Far-UV CD spectra of
cLID567-592alone and in the presence of various lipids.d Fluorescence emission spectra of nLID542-569alone and upon addition of POPC/POPS and POPC/
POPS/PI(4,5)P2SUVs.e Center of spectral mass analysis of nLID542-569fluorescence emission spectra from a SUV titration series revealed an apparent
helix formation, and implying that these four residues are
essential for, and in concert drive, cLID
567–592interaction with
the membrane. The NHE1-LID
539-593-4Gwas expectedly
dis-ordered in the absence of a membrane mimetic and showed good
solubility in buffer. In the presence of membrane mimetics,
anionic lipids still induced helicity as judged by CD analyses, but
at much lower amplitude than for wild-type NHE1-LID
539-593(Fig.
4
c), compatible with helix formation only in the N-terminal
region upon membrane association. Furthermore, the
θ
222nm/
θ
208nmratio was distinctly below unity in contrast to what is
expected for a coiled-coil structure. NMR spectroscopy of
NHE1-LID
539-593-4Gconfirmed this observation and showed that in the
absence of a membrane mimetic, transient helicity was
com-pletely lost for residues in the C-terminal, with no large effects in
the N-terminal (Fig.
4
d, e). Adding LPPG to the NMR sample of
NHE1-LID
539-593-4Gfurther substantiated this conclusion, as
under these conditions, and at low temperatures to enhance
signal to noise, signals from the C-terminal region remained
compatible with a disordered, non-membrane bound state
(Supplementary Fig. S4).
Collectively, these results show that the non-amphipathic
character of the cLID
567–592with hydrophobic side chains of I574,
F576, I586, and L588 drives the membrane interaction of this part
of the NHE1-LID and that the CD signature of a coiled-coil in the
presence of membrane mimetics relies on these hydrophobic
residues. In contrast, the N-terminal part of the NHE1-LID
539-593,
i.e. the nLID
542-569,associates electrostatically with the negatively
charged membrane surface independently of the C-terminal part.
The NHE1-LID
539-593is constitutively membrane-bound and
embeds into the lipid head group layer. Because of the observed
indications of coiled-coil
αα-hairpin formation by CD analysis
using bicelles, we sought to obtain direct insight into the
NHE1-LID
539-593interaction using a more native-like membrane model
system in the form of a supported lipid bilayer through
Quartz-Crystal Microbalance with Dissipation monitoring (QCM-D)
45and Neutron Reflectometry (NR)
46experiments. By these
meth-ods we could characterize: i) NHE1-LID
539-593adsorption to a
more native-like lipid bilayer (QCM-D and NR), ii) the overall
structure of the NHE1-LID
539-593when bound to this bilayer
(NR), and iii) the impact of NHE1-LID
539-593on the membrane
structure (NR). Supported lipid bilayers composed of POPC and
POPS (70 mol%:30 mol%) were used for both the QCM-D and
NR experiments.
Initially, we monitored the interaction between the
NHE1-LID
539-593and the supported lipid bilayer by QCM-D (Fig.
5
a). In
this method, the sensor frequency shift (ΔF) for the different
sensor harmonics reports on the adsorption of molecules on the
sensor surface, while the dissipation factor (ΔD) indirectly reports
on the packing of molecules on the surface (Fig.
5
a).
ΔF and ΔD
were monitored as a function of time (Fig.
5
a). A decrease in
ΔF with a corresponding increase in ΔD indicates an
increase in adsorbed mass on the surface. The characteristic
ΔF
of ~
−25 Hz
47was
first recorded for the POPC:POPS bilayer in
buffer (area I, Fig.
5
a). To avoid salt-induced precipitation of the
NHE1-LID
539-593, the buffer was replaced with MQ water (area
II), the NHE1-LID
539-593was injected (area III) and after
∼30 min
of incubation, excess protein was removed by MQ water (area IV)
and buffer reintroduced (area V). By comparing region I and V,
we observed a decrease in
ΔF and increase in ΔD suggesting an
increase in adsorbed mass (Fig.
5
a). This shows that under these
conditions, the NHE1-LID
539-593is adsorbed onto the POPC:
POPS membrane and stays associated with it.
Similar experimental conditions were used to collect NR data.
Initially, the structure of the lipid membrane was characterized
(Supplementary Fig. S5a–c and Supplementary Table S1) and the
data
fitted to a three-layer model (head groups – acyl chains –
head groups). Subsequently, the NR measurements were repeated
upon injection of the NHE1-LID
539-593(Fig.
5
b). The obtained
scattering length density profile, ρ(z) (Fig.
5
c) indicated how the
different sample components, i.e. lipid head groups, lipid acyl
chains, and the NHE1-LID
539-593, were distributed in the
direction normal to the support surface. The best model to
describe the data consisted of four layers. Three layers described
the lipid bilayer structure as detailed above. An additional layer
was used to describe the NHE1-LID
539-593molecules and the
membrane surface (protein
– head groups). Inspection of the
e
d
8.0 8.5 10.1 10.2 129 130 G576 G565 G542 G592 G588 G574 G586 G593 S568 S591 N551 F553 V589 Y557 W546 V558 K559 L562 A585 A564 E590 D548 L550 K547 K579 I563 Y557 K555 L573 A575 K560 E570 K583 K569 E581 R567 M580 Q584 M582 C561 E587 E566 K556 H578 K549 R552 N554 Q572 15N (ppm ) 1H (ppm) 125 120 115 110 200 220 240 -30 -20 -10 0 10 wavelength (nm) [ ] x 10 -3 deg cm 2 mol -1 res -1 cLID4G cLID4G:POPC:POPS cLID2G-1 cLID2G-1:POPC:POPS cLID2G-2 cLID2G-2:POPC:POPS HM2 HM1 200 220 240 -10 -5 0 wavelength (nm) [ ] x 1 0 -3 deg cm 2 mol -1 res -1 NHE1-LID4G NHE1-LID4G LID:LPPG NHE1-LID4G LID: DMPG:DMPC:DHPCa
b
c
539GHYGHHHWKDKLNRFNKKYVKKCLIAGERSKEPQLIAFYHKMEMKQAIELVESG592 WT 2G-1 4G 2G-2 540 550 560 570 580 590 -0.5 0.0 0.5 1.0 1.5 S C S C α (ppm) 540 550 560 570 580 590 0.0 0.5 1.0 Residue number NH ( ppm )Fig. 4 Hydrophobicity in the H2 region drives membrane interaction of the NHE1-LID. a Three different variants of the NHE1-LID539-593were analyzed,
NHE1-LID539-593-2G-1(I574G, F576G in HM1), NHE1-LID539-593-2G-2(I586G, L588G in HM2) and NHE1-LID539-593-4G(I574G, F576G, I586G, L588G), as
indicated.b Far-UV CD spectra of cLID567-592peptides with glycine mutations in various lipids.c Far UV CD spectra of NHE1-LID LID539-593-4Galone
(black) and in the presence of 2% LPPG (color) and DMPG:DMPC:DHPC bicelles (dashed color).d15N,1H-HSQC spectrum of NHE1-LID LID
539-593-4Gin
H2O, pH 6.5.e Differences in SCS between NHE1-LID539-593and NHE1-LID539-593-4Gin the absence of membrane mimetics. Top:ΔSCSs of Cα, bottom:
HM2
HM1
HHHW PIP2 SITE II HM1 HM2
POPC
POPS
H1
nLID
H2
cLID
Protein-lipid contacts
d
e
f
a
b
c
50 ns
0 ns
250 ns
500 ns
750 ns
NR MD 38 ± 3 Å 34 ± 6 Åg
0.05
0.1
0.15
0.2
10
-610
-410
-210
010
210
4R
0 20 40 60 80 100
z[Å]
-1
0
1
2
3
4
5
6
7
SLD[Å
-2]
10-6q[Å
-1]
20
0
-20
-40
-60
-80
50
60
40
30
20
10
-10
0
-100
100
150
50
t [min]
Δ
F
n[Hz]
Δ
D
n[Hz]
ΔF3 ΔF5 ΔF7 ΔF9 ΔF11 ΔD3 ΔD5 ΔD7 ΔD9 POPC POPSfraction of contact time
0
0.2
0.4
0.6
0.8
1
residue number
540 550 560 570 580 590 600
time (ns)
0
200
400
600
800
HHHW PIP2 SITE II H1 nLID H2 cLIDresidue number
540
550
560
570
580
590
600
time (ns)
0
200
400
600
800
d-buffer x 102 SMW-buffer x 10 h-buffer d-buffer SMW-buffer h-buffer C P O P: S P O P DI L-1 E H N +in
out
in
out
in
out
in
out
N-helix
C-helix
Fig. 5 The membrane-bound structure of NHE1-LID. a QCM-D, with sensor frequency shift (ΔF) on the left y-axis (top lines) and the dissipation factor (ΔD) on the right y-axis (lower lines), colors represent different sensor harmonics reporting on the adsorption of molecules (i.e., lipids and subsequently NHE1-LID) on the sensor surface. Area I to V correspond to the supported lipid bilayer in contact with the sensor (I), injection of MQ water prior (II), injection of the protein solution and its incubation with the membrane (III), removal of excess protein with MQ water (IV) and re-introduction of the buffer (V).b Reflectivity vs. q measured in buffers of different degree of deuteration (see C). c Scattering length density (SLD) profiles obtained from the NR experiment; the experimental data were collected for the sample in contact with buffer prepared with different D2O content (d-buffer= 100% D2O,
smw-buffer= 38% D2O:62% H2O, h-buffer= 100% H2O).d Per-residue histogram of protein-lipid contacts observed during the MD simulation (blue-gray:
POPC, green: POPS).e Temporal evolution of protein-POPC and protein-POPS contacts from the MD simulation. f Snapshots from the MD simulation trajectory depicting the different bound orientations of NHE1-LID on the membrane. NHE1-LID shown in ribbon representation, lipids shown in van der Waals’ representation (hydrogens omitted for clarity), colors as in (D) (H1, blue; H2, red; POPC blue-gray; POPS, green). g Schematic representation of the NR experiment setup. Details on the right side depict the protein-layer thickness measured from NR compared to average thickness of the protein obtained from MD.
profile showed that the inner head group layer as well as the lipid
acyl chain region, were unaffected by NHE1-LID
539-593adsorp-tion (Supplementary Table S2). In contrast, the structure of the
outer head group layer appeared affected by the presence of
NHE1-LID
539-593,
suggesting
NHE1-LID
to
be
partially
embedded here. The thickness of the protein layer on the
membrane surface that produced the best
fit to the NR data was
38 ± 3 Å (Fig.
5
c). This is overall compatible with the expected
thickness of NHE1-LID in an
αα-hairpin structure with only one
of the helices penetrating into the lipid layer. As a fully folded
hairpin on the surface would be more compact (see below), this
suggests that the other helix is lying dynamically on top of the
first one. In addition, a fit assuming an extended helical
conformation of the NHE1-LID along the surface of the
membrane agrees poorly with the NR data (Supplementary Fig.
S6), arguing against such a model.
Finally, we repeated the QCM-D and NR measurements for the
nLID
542-569(Supplementary Fig. S7) and NHE1-LID
539-593-
4G(Supplementary Fig. S8, Supplementary Table S3). Alone,
nLID
542-569still interacted with the membrane, in agreement
with the CD data and the NMR data on the NHE1-LID
539-593-4G.
A less negative value of
ΔF (~-38 Hz) compared to that of
NHE1-LID
539-593(~
−42 Hz) was observed. This could be explained by
the lower molecular weight of nLID
542-569as compared to the
NHE1-LID
539-593, but could also reflect that a lower number of
molecules were interacting with the membrane. Importantly, for
NHE1-LID
539-593-4G, the NR measurements suggested that the
structure of the protein layer on the membrane surface differed
from that of NHE1-LID
539-593(Supplemenatry Fig. S6), with
NHE1-LID
539-593being located mainly outside the membrane
without substantially affecting the lipid bilayer structure, in
particular the outer headgroup layer. This, again, supports the
observations made by CD and NMR spectroscopy.
Taken together, these results show that the NHE1-LID
539-593is
partially embedded into the lipid head group layer and that the
C-terminal region of the NHE1-LID
539-593, with its overall
hydrophobic character, inserts deeper into the membrane than
the N-terminal region, which on its own, is associated on the
membrane surface without penetration.
A structural model of the NHE1-LID:membrane co-structure.
To provide further details about the structure and dynamics of
the membrane bound NHE1-LID
539-593, we used molecular
dynamics (MD) simulations. An atomistic model of the
NHE1-LID was built covering residues C538-T603 and containing two
predefined α-helices: H1 (H545-L562) and H2 (P571-E590). The
helical regions were defined taking into account the NMR data
both in the absence (Fig.
1
d), and presence of a membrane
mimetics (Fig.
2
h; Supplementary Fig. S1), as well as secondary
structure predictions (Supplementary Fig. S9a). A bilayer
con-sisting of POPC in one layer and POPC:POPS (70 mol%:30 mol
%) in the other, mimicking (and termed from here on) the outer
and inner leaflet, respectively, of the plasma membrane was
established, and the NHE1-LID538-603 model was placed near
(~7 Å) the inner leaflet. The system was solvated and simulated
for 860 ns. Analysis of the MD trajectory revealed that the
NHE1-LID
538-603readily bound to the inner leaflet and remained bound
for the duration of the simulation. Monitoring the frequency of
the protein
– lipid contacts (Fig.
5
d) showed that three
NHE1-LID regions mainly contributed to binding: (i) the most
N-terminal part (C538-K547), (ii) the C-N-terminal part of the linker
connecting H1 and H2 (mainly R567, S568 and K569), and (iii)
several residues spanning the length of H2 (P571, Q572, A575,
F576, K579, M582, K583, Q584, I586, E587, L588). Many of these
latter residues (underlined) are part of the two hydrophobic
motifs of H2. Plotting the time-evolution of the protein-lipid
contacts (Fig.
5
e) showed that most of the initial contacts were
formed by the N-terminal H1 followed after 100 ns by several
contacts by H2, most of which remained stable for the remainder
of the simulation. During the second half of the simulation (t
sim>
400 ns), only residues from H2 and the inter-helix region had
stable contacts with the inner leaflet. This suggests that the
binding modes are dynamic and adaptable, consistent with the
broad specificity indicated by the lipid-dot blots (Fig.
2
a-d) and
the lack of NMR signals in the 3D spectra in membrane mimetics.
Snapshots of the trajectory are presented in Fig.
5
f and Movie S1
(H1, blue
– H2, red). The dynamics and preferred regions of
contact to POPC and POPS were the same, except that that most
of the protein-POPS contacts involved mainly positively charged
residues (K569, K579, and K583), while a mixture of polar,
charged and hydrophobic residues formed most of the contacts
with POPC.
During the simulation, the NHE1-LID
538-603quickly adopted
an
αα-hairpin structure as shown by the immediate dramatic
decrease in the angle between H1 and H2 (Supplementary Fig.
S9b) and the abrupt increase in C
α-RMSDs (Supplementary Fig.
S9c) and also readily seen in the time course movie
(Supplemen-tary Movie S1). A series of structural accommodations followed,
including shortening of H2 on its C-terminal end from E590 to
Q584 (Supplementary Fig. S9d), in agreement with the SCSs
observed by NMR (Fig.
4
e). The
αα-hairpin was stabilized mainly
by contacts between residues from the C-terminal half of H1 and
residues from the N-terminal half of H2 (Supplementary Fig.
S9e). Interestingly, some of these H1-residues constitute the PI
(4,5)P
2binding site II (K556, K560) while some residues from H2
belong to the hydrophobic LIAFY motif (L573, I574, Y577). The
remaining two residues of this motif (A575, F576) contributed to
membrane binding (Supplementary Fig. S9e).
To estimate the extent of NHE1-LID
538-603penetration into the
lipid head group layer, allowing a more quantitative comparison
of the MD and NR results, normalized averaged density profiles
were obtained from the simulation, omitting the
first 100 ns (S9f
Fig). An overlap between the protein density and the densities of
the POPC:POPS headgroups indicated some degree of
penetra-tion as expected from the protein-lipid contact measurements. No
deeper penetration was observed, in agreement with the NR
results. The average thickness of the protein on the surface of the
membrane during the simulation was estimated to 34 ± 6 Å, in
good agreement with the thickness of 38 ± 3 Å obtained by NR
(Fig.
5
g). In contrast, a linear, extended model of NHE1-LID
538-603with both helices fully in contact with the membrane would
have a much smaller thickness of ~15 Å (Supplementary Fig. S6).
These estimations suggest that the simulation captures the
essential compactness of the NHE1-LID
538-603measured
experi-mentally on the surface.
Taken together, and in line with CD data and NR analyses, MD
simulations indicate that the NHE1-LID
538-603binds to an
anionic lipid surface, forming an
αα-hairpin structure of two
helices, H1 and H2. The binding and the hairpin configuration
are dynamic, with the most favorable and long-term stable
contacts to the membrane made by the hydrophobic C-terminal
residues of H2 (Fig.
5
f). The amphipathic N-terminal H1 of the
NHE1-LID
538-603forms the initial contacts with the bilayer and
the NHE1-LID
538-603structure penetrates the outer headgroup
layer of the lipid bilayer.
To address how the presence of PI(4,5)P
2in the membrane
would affect the structure of the membrane-bound NHE1-LID,
we performed a similar MD simulation placing the NHE1-LID
model near a POPC:PI(4,5)P
2(80 mol%:20 mol%) membrane. As
for the POPC:POPS (70 mol%:30 mol%) membrane, we observed
binding of the protein to the bilayer and formation of a
helix-helix hairpin. However, in the presence of PI(4,5)P
2, the pattern
of contacts between the NHE1-LID and the membrane was
different: In this case, most of the contacts with the lipid were
stablished by residues from H1, and highly specific interactions
were observed between residues known to form the PI(4,5)P
2binding site II (R552, K555 and K556) (Supplementary Fig. S10a,
b). Thus, lipid composition affects both the distribution of
membrane-bound states of the NHE1-LID and the dynamics
of the bound state. Furthermore, we observed that the
secondary structure of NHE1-LID in the POPC:PI(4,5)P
2(80
mol%:20 mol%) membrane evolved differently over the
simula-tion as compared to the POPC:POPS (70 mol%:30 mol%)
system. With POPC:PI(4,5)P
2,we observed a shortening of H1
due to unfolding and penetration into the membrane of the
first
seven N-terminal residues and a braking of H2 into two smaller
helices, keeping the overall helical content similar
(Supplemen-tary Fig. S10c, d). This also matches the observation of no
detectable difference in helical content by CD (Fig.
3
b).
Accordingly, the thickness of the protein outside the bilayer
was reduced to ~20 Å. Additionally, we observed that during the
simulation, PI(4,5)P
2accumulated around NHE1-LID as shown
in the average density maps (Supplementary Fig. S10e–g), which
explains the long lived contacts between residues from H1 and
these lipids.
These results show that the structure and dynamics of
NHE1-LID are affected differently by the presence of POPS or PI(4,5)P
2in the bilayer. The observed change in protein-lipid contact
profiles indicates that the NHE1-LID may respond to changes in
the membrane composition and change orientation or
conforma-tion upon binding to different charged lipids.
The overall folded structure of the NHE1-LID is essential for
exchanger activity. To understand the role of the NHE1-LID
membrane co-structure in NHE1 transport activity, we generated
a full length NHE1 with the LID
4G-mutations and expressed this
and the wild-type (wt) NHE1 in AP-1 cells - mammalian
epi-thelial cells lacking endogenous NHE activity
48. In the absence of
HCO
3−, native AP-1 cells have no pH
irecovery capacity and
hence all pH
irecovery can be attributed to the exogenously
expressed NHE1
48,49. To ensure that the observed effects were
not due to clonal variation, two stable AP-1 cell clones expressing
wt-NHE1, and two stable clones expressing the 4 G variant NHE1
(4G-NHE1) were generated and functionally investigated. While
there was some clone-to-clone variation in expression as assessed
by Western blot analysis, overall plasma membrane localization
of NHE1 was not compromised by the 4G-mutations, as seen by
the comparable NHE1 band intensity in the biotinylated fraction
for all variants (Fig.
6
a,b; Supplementary Fig. S12). Consistent
with this, immunofluorescence analysis indicated a similar
plasma membrane localization of wt- and 4G-NHE1 in AP-1 cells
(Fig.
6
c). Allosteric activation of NHE1 is dependent on dimer
formation
50, which could potentially be altered by mutations in
the LID region. However, Western blots to detect the existence of
NHE1 dimers in cell lysates did not indicate detectable differences
in dimer formation between wt- and 4G variants under these
conditions (Supplementary Fig. S11), consistent with previous
results indicating the involvement of other regions in NHE1 in
overall dimer formation
51,52. Figure
6
d shows that steady state
pH
iin the absence of HCO
3was significantly lower in cells
expressing the 4G variant compared to cells expressing wt NHE1.
To determine whether this reflected altered NHE1 activity, cells
were exposed to an NH
4Cl prepulse followed by NH
4Cl removal
to induce intracellular acidification
53, eliciting a phase of recovery
of pH
i, all in the absence of HCO
3−. Recovery rates were averaged
over the two cell clones for each condition, and pH
irecovery was
furthermore normalized to NHE1 surface expression to ensure
that recovery rates reflect regulation of activity rather than
pos-sible differences in expression. Figure
6
e shows representative
traces of pH
iover time, panels F and G show the pH
irecovery
rates at the time of maximal acidification (Fig.
6
f) and as a
function of pH
i(Fig.
6
g). Remarkably, in cells expressing the
4G-NHE1, steady state pH
iwas reduced from about 7.2 to about 6.8
(Fig.
6
d), and the rate of pH
irecovery from acidification was
reduced by about 80% compared to that of cells expressing wt
NHE1 (Fig.
6
e-g). The reduced recovery rate for the 4G-NHE1
variant was seen across all pH values, and the set-point for
detectable NHE1 activation was shifted to more acidic pH
ivalues
(Fig.
6
g).
Collectively, these results demonstrate that the 4G mutations
disrupting the NHE1-LID-membrane co-structure strongly
reduce NHE1 transport activity without detectably affecting
NHE1 membrane localization.
Discussion
Unraveling the dynamics in membrane proteins is essential for
understanding their functions
54. While dynamics in folded
regions can be determined and monitored using simulations and
experiments, a largely overlooked part of membrane proteins
come from their disordered regions, which are often removed for
structural studies or are neglected in models. Here, we show the
key importance of membrane interactions with a disordered
region of the ubiquitous Na
+/H
+exchanger NHE1. We propose
that such interactions are likely to play equally important roles in
many other membrane proteins, as many as 30% of which have
been estimated to contain disordered tail regions
1.
It is
firmly established that the proximal part of the C-terminal
tail of NHE1 interacts with the plasma membrane
26,27,31,32, yet a
structural understanding of this interaction has been lacking. In
the absence of a membrane, the NHE1-LID is intrinsically
dis-ordered. A key
finding of the present work is that upon contact
with anionic lipids, the NHE1-LID forms a structure consisting of
two
α-helices in an αα-hairpin structure, the most C-terminal of
which anchors the NHE1-LID to the membrane. In contrast, in
the absence of a membrane, the NHE1-LID is intrinsically
dis-ordered and highly sensitive to environmental changes. We show
that disruption of this co-structure between the membrane and
the two LID helices is associated with a profound reduction in
cellular NHE1 activity.
Our MD simulation showed that the NHE1-LID formed an
αα-hairpin structure on the membrane. Both helices formed by the
LID (H1 and H2) interact with the membrane bilayer, but H2
makes more stable contacts to the lipid head-group layer.
Con-sistent with the importance of H2 in membrane interaction, NR
data showed that NHE1-LID penetrates less deeply into the lipid
headgroup layer when H2 is disrupted and less hydrophobic (the
NHE1-LID
4Gvariant). Given the extreme aggregation properties
of H2 on its own, and its loss of membrane interaction when
mutating hydrophobic residues, this region of NHE1-LID is
suggested to be constitutively in contact with, and partially buried
by, the membrane, acting as a tether for membrane interaction of
the NHE1 C-tail. In contrast, H1, whether studied alone in the
form of the nLID
542-569peptide or by mutating H2
(NHE1-LID
4G), interacts electrostatically with the membrane without
visible penetration into the head-group layer, as seen by NR, and
forms a membrane-induced amphipathic helix independent of
H2 as shown by CD and NMR. The thickness of the protein layer
on the membrane as measured by NR and recapitulated by the
MD, suggests that within the
αα-hairpin structure, H1 partially
overlays H2 with contacts to the membrane mainly involving
residues in its N-terminal end. In this protein:membrane
co-structure, the hydrophobic motifs of H2, LIAFY
572-577and
AIELV
585-589are essential, both because they stabilize the
αα-hairpin structure, and because they interact directly with
the membrane. Indeed, it appears from the MD simulation that
the
first motif, LIAFY
572-577, forms inter-helical contacts to H1 as
well as with the membrane, whereas the second hydrophobic
motif, AIELV
585-589,forms more contacts with the membrane.
Furthermore, the aromatic residues of the LIAFY
572-577-motif,
either alone or in combination with W546 of H1, may
addi-tionally stabilize the co-structure by engaging in one or more
T-stacks. Interestingly, a similar hydrophobic cluster (VNDSILFL)
was recently identified in the hydrophobic kinase associated-1
AP-1 wt-1 wt-2 4G-1 4G-2 NHE1 -actin Input Biotinylated NHE1 NHE1 F-Actin DAPI Detail 10 μM 10 μM 10 μM