NATIONAL FOOD AGENCY, Sweden
LIVSMEDELS
VERKET
Rapport 21 - 2013
Risk and Benefit Assessment
of Herring and Salmonid
Fish from the Baltic Sea Area
by Anders Glynn, Salomon Sand and Wulf BeckerDocument version information
Version Date Corrections
1 28 October 2013 -
2 14 October 2014 Page 45, Table 19: 026 changed to 26 Page 47, Table 20: 0.003 changed to 0.3
0.02 changed to 2 0.05 changed to 5 0.02 changed to 2 0.005 changed to 0.5
Content
Short summary ... 3
Executive summary ... 5
Introduction ... 15
Fish consumption in Sweden ... 16
Introduction ... 16
Total fish consumption ... 17
Baltic Sea (BS) herring consumption ... 21
Salmon consumption ... 25
Consumption of fermented BS herring ... 26
Consumption of fish caught by anglers ... 26
Per capita consumption of BS herring and wild salmonids ... 28
Exposure assessment ... 30
Dioxin and PCB exposure in Sweden ... 30
Introduction ... 30
Intake from food ... 31
Intakes of dioxins and dl-PCBs – international perspective ... 34
Levels of dioxins and dl-PCBs in human tissue ... 36
Intake of n-3-fatty acids and vitamin D in Sweden ... 39
Hazard/positive health effect characterization ... 41
Tolerable intake of dioxins and dl-PCB ... 41
Girls and women in childbearing age ... 41
Boys, men and older women ... 41
Reference intake of n-3-fatty acids and vitamin D ... 41
Risk and benefit characterization ... 43
Introduction ... 43
Scenario calculations for BS herring ... 44
Scenario intake calculations adults ... 46
Scenario intake calculations children ... 47
Estimations of number of women/children at risk of exceeding TWI ... 49
Number of consumers with high BS herring intake ... 49
MHE 2003 and 2007 ... 49
Consumption of wild salmonids ... 52
Conclusion – risk and benefit characterization... 53
References ... 54
Appendix 1 - Fish consumption in Sweden - The Swedish Environmental Health Reports ... 57
Appendix 2 - Fish consumption in Sweden –the Riksmaten surveys ... 79
Appendix 3 - Exposure of Swedish consumers to dioxins and dioxin-like PCBs-an international perspective ... 92
Livsmedelsverkets rapportserie nr 21/2013 3
Short summary
This report is an English translation of a report published in Swedish 2011. The aim of this risk and benefit assessment of consumption of fish contaminated with dioxins and dioxinlike (dl-) PCBs is to determine the public health consequences of 2 different options: a continuation of the Swedish exemption from maximum limits of the contaminants for certain fish from the Baltic Sea area, or a cessation of the exemption. The assessment is focused on the two most important risk groups for negative health effects of dioxins and PCBs, children and women in childbearing age. Children are at risk because they are most likely more sensitive to these compounds than are adults. Women in childbearing age is a risk group because high levels of the contaminants in the body during pregnancy may be a health risk for the developing fetus. There are however also possible health
benefits with consumption of contaminated fish. The development of the fetus and infant may benefit from the mother´s intake of long-chain fatty acids EPA+DHA and vitamin D from the fish. Moreover, sufficient intake of these nutrients from fish is most likely important for normal development during childhood.
This risk and benefit assessment mainly deals with consumption of BS herring, which is the “exemption fish” that is most readily available on the food market in Sweden. Consumption of wild salmonids with high dioxin and dl-PCB levels is very low in Sweden, since these types of fish only are available locally in the few areas where the fish are landed by fishermen.
The consumption of BS herring appears not to have changed among adults during the last decade, and average consumption is in general low. There is however a proportion of the Swedish population that could be regarded as high consumers of BS herring. In the the population-based National Environmental Health Survey (MHE 2007) about 6 % of the women in childbearing age reported that they consumed BS herring twice a month or more. When scaled to the total Swedish population, this represents about 100,000 women in the ages of 18-45 with high consumption in 2007. This rate of consumption is strongly related to a dioxin and dl-PCB intake above the health-based tolerable weekly intake (TWI). Among children in the population-based MHE survey from 2003 4-5 % of the children consumed BS herring once a month or more, corresponding to about 45,000 children in Sweden in the year 2003 having a consumption that is strongly associated with an intake above the TWI.
Scenario calculations of dioxin and dl-PCB intake from BS herring were performed using consumption data from the nation-wide food consumption surveys Riksmaten. The calculations suggested that a continued exemption from the maximum limits for BS herring can, in the worst case, result in thousands of more children and young women exceeding the TWI than would be the case if Sweden had no exemption. With an exemption in place, BS herring with very high levels of dioxins and dl PCBs from the northern part of the Baltic Sea (Gulf of Bothnia) will be available for sale on the market. In this type of BS herring the weighted mean level of dioxins and dl-PCBs was estimated to 9 pg TEQ2005/g
Livsmedelsverkets rapportserie nr 21/2013 4
fresh weight, based on the catch statistics of commercially available BS herring and TEQ levels in BS herring from the contaminated areas in question. With no exemption this type of fish would not be for sale and the weighted mean level of dioxin and dl-PCBs in BS herring on the market would drop to about 3 pg TEQ/g fresh weight also in contaminated areas. In the case of wild salmonid fish from the Baltic Sea, and lakes Vänern and Vättern, intake calculations show that for
women in childbearing ages TWI is exceeded already at an average consumption of a few portions a month. Among young children the TWI is exceeded already at a regular consumption of less than once a month. A cessation of the exemption would not lead to any limitations of the beneficial intake of nutrients, since BS herring and salmon not complying with the maximum limits would be replaced by BS herring and salmon complying with the limits.
In conclusion, a cessation of the exemption from maximum limits would be more beneficial from a public health point-of view than a continued exemption. In the case of no exemption there would be a decreased exposure of the population to dioxins and dl-PCB without any limitation of the intake of beneficial nutrients.
Livsmedelsverkets rapportserie nr 21/2013 5
Executive summary
Background
This report is an English translation of a report published in Swedish 2011. The health risk and benefit assessment of fish with high dioxin and PCB levels was conducted as a scientific input to the negotiations on dioxin/PCB regulation for food within EU during 2011. At that time Sweden had a temporary exemption from the maximum limits of dioxins and dioxin-like (dl-) PCBs in certain fish from the Baltic Sea and Lakes Vänern and Vättern.
The aim of the assessment is to determine the health consequences of 2 different negotiations options; a continuation of the exemption from maximum limits for certain fish from the Baltic Sea area, or a cessation of the exemption.
Fish is a large source of the Swedish population’s exposure to dioxins and dl-PCBs, even though fish consumption is low in relation to consumption of staple foods such as dairy products, meat and meat products. Fish is also an important source of nutrients such as vitamin D and essential long-chain n-3-fatty acids (omega-3), especially eicosapentaeonic acid (EPA) and docosahexanoic acid (DHA).
The focus of this risk and benefit assessment is the two risk groups for negative health effects of dioxins and PCBs: children and women in childbearing age. Children are at risk because they are most likely more sensitive to these compounds than are adults. Women in childbearing years are a risk group because the developing fetus is sensitive to environmental pollutants. Dioxins and dl-PCBs are very persistent in the human body and the body burden of the compounds during pregnancy, which determines the exposure of the developing fetus, is a result of a long-term exposure before pregnancy. The development of the fetus also benefits from sufficient intake of EPA+DHA and vitamin D by the pregnant and nursing mother, and sufficient intake of these nutrients is also important for normal development during childhood.
Herring from the Baltic Sea is the “exemption fish” which is readily available in food stores. Wild-caught salmonid fish from the Baltic Sea (trout and salmon), Lake Vänern (trout and salmon) and Lake Vättern (trout, salmon and char), which up to the end of 2011 also were exempted from the maximum limits, are most likely mostly sold locally in the areas where they are caught. Knowledge about the consumption of Baltic Sea (BS) herring among Swedish consumers derives
mainly from population-based food consumption surveys, and the quality of data is relatively good. BS herring is a food product that the consumer fairly easily can distinguish from other herring products manufactured from herring caught in the Atlantic Ocean which has lower levels of dioxins and PCBs. The consumers have however a difficulty to distinguish between farmed salmon, which dominate the
Livsmedelsverkets rapportserie nr 21/2013 6
Swedish market, and wild-caught salmon and trout. This makes the data on consumption of wild-caught salmonids unreliable. Based on statistics for commercial fishing from the Swedish Board of Fisheries, the consumption of commercial BS herring is substantially higher than the consumption of commercially caught wild salmonid fish. For these reasons this risk-benefit assessment focuses on BS herring.
The present report consists of the following main sections:
-An update of the knowledge about fish consumption in Sweden, with special emphasis on BS herring.
-An update of the intakes of dioxins and dl-PCBs, vitamin D and EPA/DHA from food in Sweden.
-A characterization of the health risks and benefits of consumption of BS herring among Swedish consumers
Dioxins, dl-PCBs, EPA+DHA and vitamin D
Dioxins and dl-PCBs are organic chlorinated substances which are lipid-soluble and persistent in the environment. Food is the most important source of human exposure to the compounds in Sweden. Animal studies and studies of human populations exposed to high levels in accidents or occupational settings have shown that the compounds can cause cancer and negative effects on the immune system and reproduction. The fetal stage is the most sensitive period and high exposures early in life may negatively affect child health development later in life.
Fish is a large source of the population’s exposure to dioxins and dl-PCBs, since the levels of environmental contaminants in fish are much higher than in other kinds of foods. Fish is also an important source of nutrients such as vitamin D and essential long-chain n-3-fatty acids (omega-3), especially eicosapentaeonic acid (EPA) and docosahexanoic acid (DHA).
Fish consumtion in Sweden
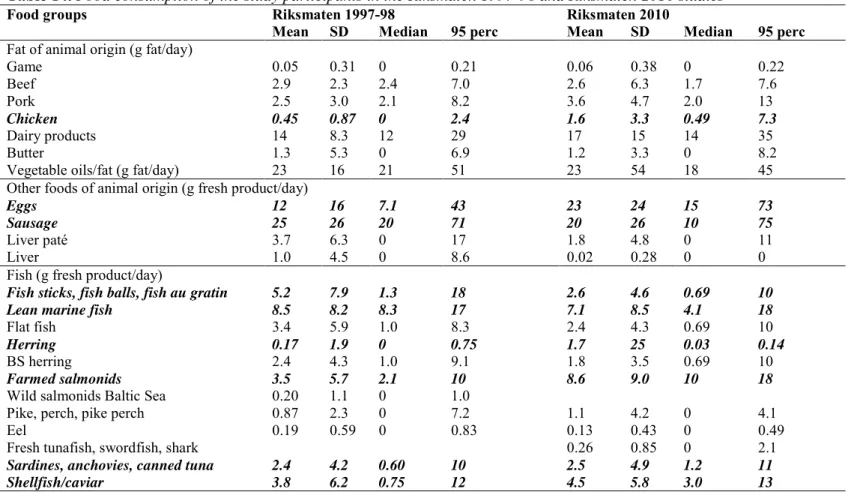
Data on fish consumption have mainly been taken from the population-based food consumption surveys performed by the Swedish National Food Agency (SNFA), Riksmaten 1997-98 (adults, N=1212) ) and Riksmaten 2003 (children (N=2463), and partly from the survey Riksmaten 2010 (adults, N=672). Data are based on the answers of the survey participants to questions about fish consumption, where the participants tell how frequently they consume fish.
A similar survey question regarding the consumption of BS herring, as in the Riksmaten studies, was posed in the population-based survey Miljöhälso-enkäten (MHE) 2003 (children) and MHE 2007 (adults). Results regarding the consump-tion of Baltic herring in the MHE surveys are in concordance with the results from the Riksmaten studies mentioned above, which suggest that con-sumers have a relatively clear idea of how to correctly separate consumption of
Livsmedelsverkets rapportserie nr 21/2013 7
BS herring from Atlantic herring consumption. The MHE studies cover the entire Swedish popu-lation with 15,000 children (2003) and 25,000 adults (2007) participating. These studies were conducted by the Swedish National Board of Health and Wellfare and the Institute of Environmental Medicine (IMM) at Karolinska Institutet, Stockholm.
Fish consumption in general
SNFA recommends consumers to eat fish 2-3 times a week and to choose different kinds of fish. In the SNFA surveys Riksmaten 1997-98 and Riksmaten 2010 about 30 % of the adult consumers followed the recommendations. In the MHE from 2007 the proportion of adults which followed the recommendations was about 20 %. The differences between the Riksmaten surveys and MHE probably, at least partially, depends the fact the questions about fish consumption was posed differently between the studies. For example, shellfish were included in the questions about fish consumption in the Riksmaten studies but not in the MHE. The Riksmaten studies do not suggest that the total fish consumption has decreased between the end of 1990’s and 2010 among adults in Sweden.
The SNFA study of fish consumption among over 400 young pregnant and nursing women in the Uppsala region between 1996 and 2008 (POPUP study) suggests that fish consumption has slowly increased in this group of women. If this increase is representative for the rest of the population of young women in Sweden is unclear. A large proportion of the increase among the young women in the Uppsala region depends on the increased consumption of farmed salmon. An increase of the salmon consumption among adult women in general is also indi-cated in the Riksmaten 1997-98 and 2010 studies. The average consumption in the Riksmaten 1997-1998 was about 1 g/day among women as well as men, whereas the average consumption among women was 10 g/day and among men 4 g/day in Riksmaten 2010. There has been a concern that the fish consumption has de-creased in Sweden because of consumer´s worries about the presence of environ-mental contaminants in fish. The data from the Riksmaten studies and the POPUP study indicates that the fish consumption has not decreased since the middle of the 1990’s. It seems that salmon consumption has dramatically increased.
There is no recent data on fish consumption by children in Sweden. The most recent Riksmaten study of children was conducted in 2003. The same year the MHE 2003 was finalized with a focus on children. In the Riksmaten 2003 fish and shellfish were on average consumed 1-2 times per week, and 4 yr old children consumed fish more often than children in school grade 2 (8 yr) and grade 5 (12 yr). Among the school children, 8 year old children consumed more fish than 12 year old children. This is in accordance with the results in the MHE 2003 study, where 28 % of 4 year old children consumed fish twice a week or more, whereas 21 % of children 12 years of age consumed fish that often.
Livsmedelsverkets rapportserie nr 21/2013 8
Consumption of Baltic Sea herring
The Riksmaten studies indicate that consumption of Baltic Sea (BS) herring among adults has not significantly changed between 1997-98 and 2010. Similar results have been observed in the POPUP study during the period 1996-2008. Consumption is generally low. Among adult consumers the consumption is on average 1 g/day, which corresponds to about 3 portions per year. In Riksmaten 1997-98 over 90 % of women between the ages of 17 and 45 reported that they consumed BS herring at most 6 times per year. Among the participating children in Riksmaten 2003 more than 50 % was reported not to consume BS herring at all.
There is however a proportion of the population that could be regarded as high consumers of BS herring. In the MHE 2007 study about 6 % of the women in childbearing age reported that they consumed herring twice a month or more. When scaled to the total Swedish population, this represents about 100,000
women between the ages of 18-45 during 2007. Approximately 2 % of the women consumed BS herring once a week or more, which corresponds to 35,000 women in the Swedish population. Among children in the MHE 2003 study 4-5 % of the children consumed herring once per month or more. Based on the population size in Sweden 2003, this proportion corresponds to about 4,000 4 year-olds and 6,600 12 year-olds. Assuming that there were on average 5,000 children who consumed herring once a month or more in each age group between the ages of 4 and 12 then we estimate that 45,000 children consumed herring once a month or more in the year 2003.
Consumption of fermeted BS herring
Fermented BS herring consumption is very low among consumers in Sweden. This traditional food is usually only eaten on special occasions. In 2010 the SNFA did a survey of fermented BS herring consumption in Sweden. Among families with small children (N=1000), which include the risk groups of children and women in their childbearing years, 84 % reported that they never consumed fer-mented BS herring, 6 % that they only consumed it once a year, and 9 % that they consumed fermented BS herring a few times per year. Among the general public (N=2000) only 5 % said that they consumed fermented BS herring more than 2 times per year. The highest consumption was found among professional fisher-men (N=200) where 13 % said that they consumed ferfisher-mented herring five times per year or more.
Consumption of fish caught by anglers
The consumption of fish that anglers catch has scarcely been studied in Sweden. In the ongoing Riksmaten 2010, however, the question of consumption of BS herring and wild salmon caught by the study participants themselves, a relative or an acquaintance, was addressed. The preliminary results indicate that consumption of these fish is low in relation to the consumption of commercially caught BS herring and farmed salmon. For instance, 92 % of the participating adults reported that they never or at most 1-3 times each year consumed angler-caught salmon.
Livsmedelsverkets rapportserie nr 21/2013 9
The corresponding percentage for the same frequency of salmon consumption in general (mostly farmed) was 15 %. Among professional fishermen (N=500), participating in the SNFA fish consumption survey in 2010, the consumption of herring and salmon from their own catch was reported to be high. About 60 % of the professional fishermen reported that they consumed BS herring or salmon once a week or more.
Per capita consumption of fish
The per capita consumption of fish gives a measure of the average consumption of fish that are sold on the Swedish market. Estimates for BS herring and
wild-caught salmonids from the Baltic Sea, and the lakes Vänern and Vättern, are based on the Swedish National Fisheries Board statistics on commercial fishing volumes during the period 2007-2009, as well as on the population size of Swedish
residents who were one year of age or older in 2009. The statistics is for whole fish and do not account for amounts actually consumed. The fact that some herring caught in the southern Baltic are exported to other countries is either not accounted for. In this context it is also important to remember that the consump-tion of fish varies greatly within the populaconsump-tion; many persons never or very seldom eat fish while a small number of persons consume the largest proportion of all fish on the Swedish market.
The per-capita consumption of BS herring is currently about 2.06 kg/year. The per capita consumption of BS herring on the Swedish market with dioxin and dl-PCB levels below the EU maximum level in fish is estimated to be approxi-mately 1.90 kg/ year. This fish consists of BS herring caught in the southern Baltic Sea proper and BS herring with a length of 17 cm or shorter caught in other areas of the Baltic Sea. Only 10 % of the per capita consumption consists of BS herring from the Baltic Sea which may have dioxin and dl-PCB levels above the maxi-mum limit. The per capita consumption of the wild-caught salmon and trout from the Baltic Sea and the lakes Vänern and Vättern, as well as char from Lake Vättern, is estimated to be about 30 g/year. This is to be compared with the per capita consumption of farmed Norwegian salmon, which was in 2007 estimated to be 3.5 kg/ year. A certain percentage of “re-exported” Norwegian salmon occurs from Sweden which means that the per capita consumption of farmed salmon is somewhat over-estimated.
Exposure assessment
Consumer exposure to dioxin and dioxin-like PCBs
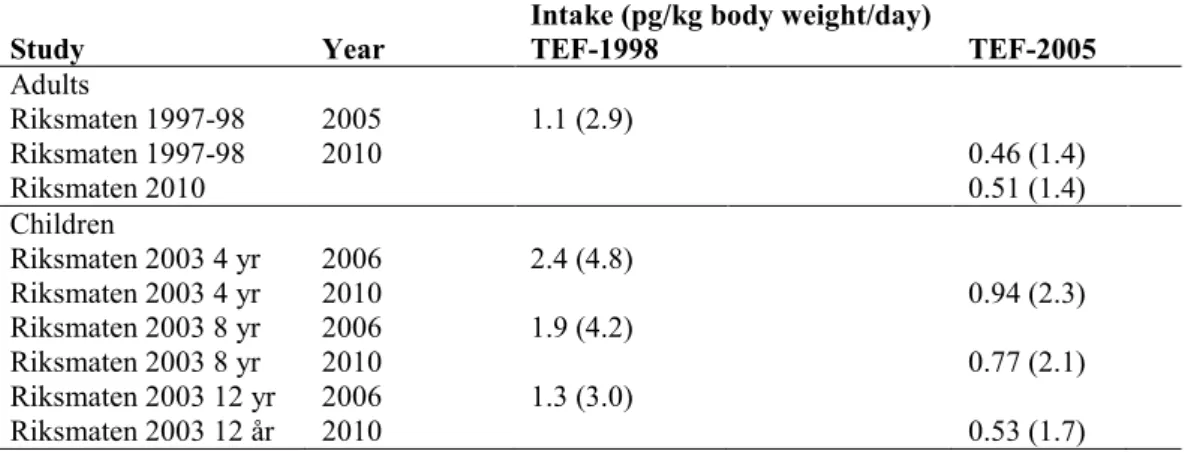
The Swedish National Food Administration’s intake estimates, based upon Riksmaten 1997-98 and on Riksmaten 2010 (adults), as well as on Riksmaten 2003 (children), indicate that the average intake of dioxins and dioxin-like PCBs among consumers in Sweden has dropped since the end of the 1990’s. Among adults the average intake of dioxins and dl-PCBs in the end of the 1990s was estimated to 1 pg/kg body weight/day, and around 2010 it was estimated to 0.5
Livsmedelsverkets rapportserie nr 21/2013 10
pg/kg body weight/day. Among 4 year old children corresponding average intakes were 2.4 and 0.94 pg/kg body weight/day. This conclusion about decreasing intakes is however preliminary since the recruitment of study participants in Riksmaten 2010 (adults) had not been terminated when the intake estimation was made and the estimates for children were only based on food consumption data from 2003 (Riksmaten 2003). An actual decrease in the intake is however supported by the results from the Swedish National Food Administration’s market-basket studies of per capita intake of dioxins and dl-PCBs from 1999 and 2005.
The lower intake can in part be explained by decreasing levels of dioxins in food on the Swedish market. Improvements in the analytical methods for
measuring dioxin and dl- PCBs in food could also have contributed to the
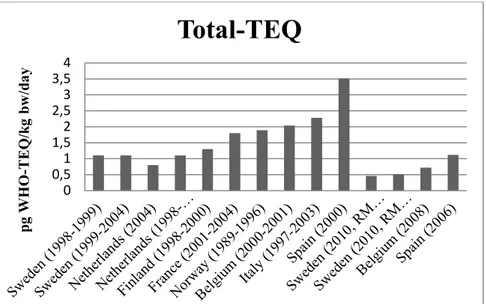
observed decrease in intake; better analysis methods lead to fewer samples falling below the limit of quantification (LOQ) of the analytical method. In the intake calculations, levels that were below the LOQ were set to one half of the LOQ. As a consequence, the use of analytical methods with high LOQs often causes over-estimations of dioxin and dl-PCB levels. Moreover, in 2005 there was a revision of the WHO toxicity equivalent system (WHO-TEF), which is used when esti-mating dioxin and dl-PCBs levels in food. This revision resulted in a decrease in total levels of dioxin and dl-PCB toxicity equivalents (TEQ) with 10-20 % in food. A comparison between the estimated average TEQ intake for consumers in Sweden and the average intake in other European countries indicates that the intake in Sweden is at the same level or somewhat lower than the average adult intake in other highly-industrialized countries in Europe.
Levels of dioxins and dl-PCBs in breast milk give a good measure of long-term exposure to these substances from food among young women. Studies of temporal trends of dioxins and dl-PCBs in breast milk in Sweden show that the long-term exposure is slowly decreasing by about 6% per year. Breast milk from Sweden has somewhat lower average levels of the contaminants than breast milk from more population-dense countries such as the Netherlands, Belgium, the Czech Republic, Germany and Italy.
Intake of n-3 fatty acids and vitamin D in Sweden
The average intake of n-3 fatty acids (omega 3) was estimated to be 1.6–2 g per day among adults and 1.1–1.3 g per day among children 4-12 years old. The intake of EPA and DHA is on average 320-340 mg per day for adults and 140 – 160 per day for children. Fish and shellfish contribute with about 80 % of the intake of EPA+ DHA among adults and about 60 % among children. The intake of vitamin D for adults and children is on average between 5-7 µg per day. The main source for vitamin D is enriched milk products, dietary fats and oils and fish.
Livsmedelsverkets rapportserie nr 21/2013 11
Hazard and positive health effect characterization
Tolerable intake of dioxin and dioxin-like PCBsThe EU and WHO tolerable weekly intake (TWI) of dioxins and dl-PCBs was used as a guideline for negative health effects of these substances in girls and women in childbearing years (TWI, 14 pg, TEQ/kg body weight/week). This TWI is based upon negative effects on male reproduction in offspring of female rats which were exposed for dioxins during gestation. The margin between the TWI and the levels where negative effects are measurable in experimental animals is relatively small (a factor of 10). The low margin makes it important for girls and young women not to exceed the TWI in the long-term perspective.
For boys, men and older women a range of TWI of 14 -70 pg TEQ/kg body weight/week was used. This TWI range has been proposed in a risk assessment of non-developmental exposure to dioxins and dl-PCBs made by experts from the SNFA and IMM at Karolinska Institutet. For men and older women a guideline TWI at the middle point of the range was used, at 35 pg TEQ/kg body
weight/week. This gives a margin of 25x to the lowest exposure levels where negative health effects have been detected (cancer). The guideline level for boys was established to 14 pg/kg/week since boys seem to be more sensitive for dioxins and dl-PCBs than are adult men. This gives a safety margin of 50x. Reference intake of the fatty acids EPA+DHA and vitamin D
Efsa, the European Agency for Food Security, has suggested a reference intake (adequate intake) for EPA+DHA of 250 mg/day for adults based upon the beneficial effects on heart disease. No reference levels have been established for younger children. A reference level for children was therefore estimated from Efsa’s level for adults with adjustments made for the reference levels established for the energy intake according to the Nordic (NNR) and the Swedish dietary recommendations (SNR). For 4 and 8 year old children a reference value of 150 mg EPA+DHA was used, whereas for 12 year old children it was set to 250 mg/d.
For vitamin D the recommended intake according to the NNR/SNR was used, which is 7-5 µg per day for adults and children over two years of age.
Risk and benefit characterization
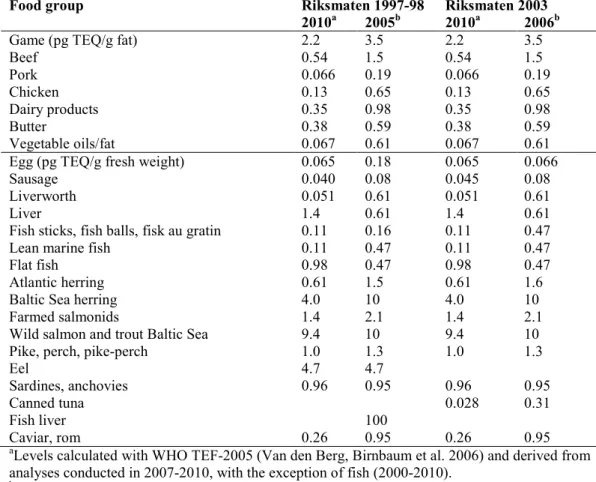
Consumption data and data on occurrence levels
For scenario intake calculations covering Swedish consumers, consumption data for adults from Riksmaten 1997 – 98 and 2010 were used, whereas consumption data for children were from Riksmaten 2003. Data on concentrations of dioxins and dl-PCBs in basic food stuffs, other than fish, were taken from the foods sampled between 2007 and 2010, while the concentrations in fish came from samples taken between 2000 and 2010. Concentration data for vitamin D and EPA + DHA were taken from the Swedish National Food Administration’s food
Livsmedelsverkets rapportserie nr 21/2013 12
Scenario intake estimates for consumption of BS herring
In the risk and benefit characterization of BS herring consumption it was assumed that availability of BS herring on the Swedish market for the consumer is inde-pendent of EU legal regulations, since most of the BS herring sold on the market currently have levels of dioxins and dl-PCBs below EU’s maximum limits for the contaminants. The herring on the Swedish market, with levels above the
maximum limits, would most certainly be replaced by herring with levels below the maximum limits, in the case of a decision that Sweden should not have an exemption from the maximum limits. As a consequence of this, the intake of vitamin D and EPA + DHA from BS herring was estimated to be the same in the different scenario estimations tested for BS herring.
Weighted means of dioxins and dl-PCB in BS herring from different
catchment areas were based upon catch statistics and average dioxin and dl-PCBs levels in BS herring. Three scenarios were assumed: (1) Consumption of BS herring with average dioxin and dl-PCB levels (4.2 TEQ/g fresh weight) estimated for the whole Swedish market in case of an exemption from the maximum limits; (2) Consumption of BS herring with average levels detected in BS herring caught in the Gulf of Bothnia (9.4 pg TEQ/fresh weight) in case of an exemption; (3) Consumption of BS herring with average levels estimated for the whole Swedish market in the case of no exemption (2.8 pg TEQ/g fresh weight).
Adults
The counties along the coast of the Norrland region is the area of Sweden where the locally caught BS herring has the highest dioxin and dl-PCB levels (weighted average concentration: 9.4 pg TEQ/g fresh weight). In the scenario 2 estimations of the consumption of “Norrland’s herring” there were 3 -5 times as many young women which were estimated to exceed the TWI than if consumption consisted only of BS herring with a mean level as estimated in scenario 3 (weighted mean level 2.8 pg TEQ/g fresh weight). The women exceeding the TWI in scenario 2 had an average BS herring consumption of 2-3 times per month. Counted in terms of number of women in the Norrland’s region, an exemption may in the worst case result in between 4000 and 5000 more young women exceeding TWI than if the exemption would be removed, assuming consumption of locally caught herring. There are however uncertainties in this estimation since the Riksmaten has few participants with high herring consumption. The uncertainty in this estimation is illustrated by the estimation of BS herring consumption among young women based on MHE 2007. Between 3,000 and 30,000 (95 % confin-dence interval) young women in the Norrland region eat BS herring 2-3 times per month. Even though this uncertainty exists, the scenario estimations indicates that a continued exemption in the worst case may result in thousands more young women in the Norrland region exceeding TWI than if the exemption would be removed.
Livsmedelsverkets rapportserie nr 21/2013 13
The scenario estimations for the rest of the adult population in Sweden as a whole indicate that about 1-2 % of women in their childbearing years exceed the TWI regardless if Sweden has an exemption for BS herring or not (scenarios 1 and 3). For men and older women there were none or a very small proportion which exceeded the TWI in the various scenarios.
In all three scenarios, based on consumption data from Riksmaten 2010, 70 % of the older women reached the reference intake for EPA + DHA of 250 mg/day. Among men and younger women about 55 and 44 % respectively reached the recommended intake of the fatty acids. Twenty-six percent of the men reached the recommended intake of vitamin D (7.5 µg/day). Among older women 15 % reached of the recommended intake and among younger women 6 %.
Children
The scenario intake estimations for children, based upon the Rikmaten 2003 survey, show that consumption of locally-caught herring from the Gulf of Bothnia (scenario 2) increase the proportion of 4 year-olds exceeding the TWI from 7% (scenario 3) to 9% (scenario 2). Among the 8 year-olds the proportion increased from 5 % (scenario 3) to 8 % (scenario 2), while for the 12 year-olds the
proportion which exceeded the TWI was not affected. Based on the number of children living in the Norrland counties, these increases in the proportion of children exceeding the TWI, if there is an exemption, would amount to 200 4 year old children and 400 8 year old children. In Riksmaten 2003 the average BS herring consumption among children exceeding the TWI was of 1 portion per month.
The MHE 2003 study shows that between 200 and 900 (95 % confidence interval) 4 year old children in the region of Norrland had high enough con-sumption of BS herring (once a month or more) that they were faced with a large risk of exceeding the TWI if there was a continued exemption. Among 12 year old children in this region there were between 300 and 1,900 children who consumed herring once a month or more and thereby were faced with the risk of exceeding the TWI. All in all, these estimations indicate that in the worst case, there are several thousand more children between the ages of 4-12 years in the region of Norrland that would exceed the TWI if the exemption is permanently granted than if it is removed. For most of the children in the rest of Sweden, there would be no great difference in intake of dioxins and dl-PCBs if Sweden gets a permanent exemption or not.
Among 4 year old children 30 % reached the estimated reference intake for EPA + DHA in all 3 scenarios. About 30 % of the 8 year old children and 24 % of 12 year old children reached the reference levels for these fatty acids. With regard to vitamin D intake, 35 % of four-year-olds reached the recommended intake of 7.5 µg/day. Among older children in the age groups of 8 and 12 years there were 14 % and 11% respectively who reached the recommended intake.
Livsmedelsverkets rapportserie nr 21/2013 14
Scenario intake estimates for consumption of wild salmonid fish
Similar scenario estimations are not possible to conduct for wild-caught salmonid fish from the Baltic Sea, or the lakes Vänern and Vättern, because there is no reliable consumption data for wild-caught salmon from these areas in the Riksmaten studies. The problem with the high levels of dioxins and dl-PCBs in these kinds of fish can however be illustrated by calculating how many portions that could be eaten by the consumers without exceeding the TWI. In these calcu-lations the dioxin and dl-PCB intake from other foods was set at the median level estimated in Riksmaten 2010 (adults) and Riksmaten 2003 (children). These cal-culations show that it is enough with a few portions each month for a woman in childbearing years in order to exceed the TWI. Among young children the TWI is exceeded even if the consumption is less that once per month.
Conclusion of risk/benefit characterization
In conclusion, the scenario calculations of dioxin and dl-PCB intake from fish suggest that a continued exemption can, in the worst case, result in thousands of children and women in childbearing years facing the risk of exceeding the TWI. Since the availability of BS herring and farmed salmon with relatively low levels of dioxins and dl-PCB on the Swedish market is high, there is no increased health benefit related to consumption of store-bought BS herring and wild salmononid fish that have high levels of dioxins and dl-PCB.
Livsmedelsverkets rapportserie nr 21/2013 15
Introduction
This risk-benefit assessment of fish with high dioxin and PCB levels was conducted as a scientific background to the negotiations about dioxin/PCB regulations of food in 2011. At the time of the assessment Sweden had an exemp-tion from the EU maximum limit of dioxins and dioxin-like (dl-) PCBs for certain fish from the Baltic Sea, and for the lakes Vänern and Vättern. This temporary exemption was due to expire January 1, 2012.
The current report contains Appendices used as background information when completing the assessment. Appendix 1 was authored by Anders Glynn (National Food Agency, NFA) and Thomas Lind (Institute of Environmental Medicine, Karolinska Institutet, Stockholm), Appendix 2 by Magnus Lundgren, Niclas Johansson, Anders Glynn, Helene Enghardt Barbieri and Wulf Becker at the NFA, and Appendix 3 by Niclas Johansson and Anders Glynn at the NFA.
The risk and benefit assessment focuses on children and women in their childbearing years. Children are a risk group since they are most likely more sensitive to dioxins and dl-PCBs than are adults. Women in their childbearing years are risk group because the developing foetus is sensitive for these contami-nants, and the body burden that pregnant women have is a result of a long-term exposure before pregnancy.
Besides being an important source of exposure to dioxins and dl-PCBs, fish is also an important source of vitamin D and the essential long-chained n-3-fatty acids (omega-3), eicosapentaenoic acid (EPA) och docosahexaenoic acid (DHA). Consumption of fish is therefore often beneficial for human health. In the present assessment the health risks of dioxin and dl-PCBs intake from fish is weighed against the health benefit of intake of vitamin D and EPA+DHA from fish.
Herring from the Baltic Sea and the Bothnian Bay, here called BS herring (in Swedish “strömming”), were included in the exemption from maximum limits. These fish are easily available for consumers in the food stores. BS herring is mostly sold as fillets (fresh or frozen), whereas most of the Atlantic herring is sold as pickled herring. It is therefore possible for the consumers to separate
consumption of BS herring from Atlantic herring consumption in food
consumption surveys. Wild-caught salmonid fish from the Baltic Sea (trout and salmon), Lake Vänern (salmon and trout) and Lake Vättern (trout, salmon and arctic char) were also exempted from the maximum limits of dioxins and dl-PCBs. These types of fish are most probably sold locally in the areas where they are caught. Consumers have a more difficult time to discern wild-caught salmonid fish from farmed salmon, mostly originating from Norway. The data for
consumption of wild-caught salmonid fish is therefore of poorer quality than the data regarding BS herring. Based upon commercial fishing statistics from the Swedish Board of Fisheries, the consumption of commercially caught BS herring is considerably higher than is the consumption of commercially caught salmonid fish. Thus, consumption of BS herring is the focus of this risk and benefit
Livsmedelsverkets rapportserie nr 21/2013 16
Fish consumption in Sweden
Introduction
The objective of this chapter is to describe the current knowledge on fish con-sumption in Sweden in general and concon-sumption of BS herring and salmonid fish in particular. Consumption data for fish comes mainly from the food consumption surveys conducted by the Swedish National Food Administration (SNFA), called Riksmaten. In the Riksmaten 1997-98 (adults 17-74 years of age; N = 1215) and Riksmaten 2003 (children of ages 4, 8 and 12 years; N = 2495) study participants answered a questionnaire with questions about how often they consumed different types of fish during the most recent year (Becker och Pearson 2002; Enghardt Barbieri, Pearson et al. 2006). The participation rate in the Riksmaten 1997-98 was 60 % and in Riksmaten 2003 80-89 % (Becker and Pearson 2002; Enghardt Barbieri, Pearson et al. 2006). Currently Riksmaten 2010 (adults) is ongoing, and 676 participants had completed the survey and answered questions about their fish consumption in the end of October 2010. Fish consumption data also comes from two other SNFA studies. Between 1996 and 2010 women from the Uppsala area, close to the Swedish capital Stockholm (POPUP-study, N=325), who gave birth to their first child, have answered the same questions about fish consumption as those found in the Riksmaten studies (Lignell, Glynn et al. 2006). Moreover, during 2010 SNFA conducted a study of the current knowledge among the consumers in Sweden about the SNFA fish consumption advisories (Knowledge 2010). In that study questions about fish consumption were posed to the parti-cipants, including families with small children (N=1000) and professional fishermen (N=400).
Data on fish consumption in general, and BS herring consumption in particular, also come from the Environmental Health Survey (Miljöhälsoenkät (MHE)) 2003 (children of ages 4 and 12) and 2007 (adults, ages 18-80),
conducted by the Swedish National Board of Health and Welfare and the Institute for Environmental Medicine, Karolinska institutet (IMM) (MHE 2005; MHE 2009). In these surveys there was a general question about how often the partici-pants consumed fish and a specific question about their consumption of BS herring. The result from these two surveys are considered to be more represent-tative for the Swedish population than are the results from the Riksmaten studies, since the number of participants was much greater in the MHE 2003 (N=17769) and MHE 2007 (N=25851). Moreover the data from MHE were adjusted for biases in study participation regarding certain key variables. In MHE 2003 the participation rate was 70 % and in MHE 2007 59 %.
There is uncertainty built into data obtained from food frequency question-naires, since different consumers can interpret a question in different ways. Questions about the consumption of BS herring can illustrate this problem. For example, some consumers might overestimate their consumption of this kind of fish by also including their consumption of Atlantic herring in their answers.
Livsmedelsverkets rapportserie nr 21/2013 17
Other consumers might underestimate their consumption of BS herring if they only report consumption of BS herring from the Baltic Sea proper and fail to include consumption of BS herring caught in the Gulf of Bothnia.
The results from the questionnaires regarding the consumption of BS herring in the MHE surveys are however in concordance with the results from the
Riksmaten studies (see below). This indicates that consumers have a relatively clear picture of how to distinguish between BS herring (mostly sold as fresh or frozen fillets in the stores) and Atlantic herring (mostly sold as pickled herring). In the SNFA surveys data on salmon consumption was regarded as representative for consumption of farmed salmon, which is what consumers find in the stores.
Table 1. Total fish consumption (g/day) and the proportion (%) of consumers that
consumed fish twice or more each week in the SNFA’s studies
Study Study group (N) Mean SD Median 95th perc >2-3/week
Riksmaten 1997-98 Women (618) 35 28 29 90 37 Men (597) 34 33 26 99 34 Riksmaten 2010 Women (375) 34 38 27 76 41 Men (297) 28 30 22 68 31 Riksmaten 2003 Children 4 yrs (584) 15 11 13 32
8 yrs (877) 21 22 17 57 12 yrs (1002) 23 28 18 70
POPUP (1996-2006) Women (325) 29 23 25 66 27 SD=standard deviation; perc= percentile
Total fish consumption
The total fish consumption among adults was at similar levels in the Riksmaten studies 1997-98 and 2010 (Table 1). The median consumption varied between 22 and 29 g/day, with a tendency of higher median consumption among women than among men. However, conclusions on possible sex differences in fish consump-tion in the Riksmaten 2010 study is not possible since the study was not com-pleted when data were analysed. Results for children in the Rikmaten 2003 showed that the four-year-olds had a lower consumption measured in g/day than children in the eight-year-old or 12-year-old age groups (Anova p<0.001). There was no significant difference between girls or boys (t-test, p=0.196-0.844).
An increased fish consumption with age was observed in the Riksmaten 1997-98 study, the median consumption ranged from 17 g/day for both women and men of the ages 17-24 years to 26-29 g/day for women and men in the age group of 65-74 years (Becker and Pearson 2002). SNFA recommends that consumers should eat fish 2-3 times per week and that the consumers should choose to eat several different kinds of fish (Livsmedelsverket 2010). Among the adult con-sumers in the SNFA studies there were between 27 % and 41 % who followed this advice using a serving size of 125 g. The most relevant comparison between the current recommendations and the consumption among adults can be
Livsmedelsverkets rapportserie nr 21/2013 18
made for the Riksmaten 2010 study. Preliminary results indicate that more women than men follow the recommendations (Table 1).
During 2008 an interview survey was conducted where 1000 randomly chosen adults between the ages of 16 and 80 were asked about their food habits during the most recent year (Becker 2009). The participation rate was 50 %. In this study about 30 % of the respondents reported that they ate fish/shellfish twice a week or more.
Table 2. Fish consumption of the adult population in Sweden
(18-80 year of age) during 2007, based on the MHE 2007 survey Fish consumption %(number) 95 % CIa
Lower Upper Seldom/ never 7.2 (1500) 6.7 7.7 1 time/month 11 (2300) 9.9 11 2-3 times/month 23 (5700) 22 24 1 time/week 39 (10300) 38 40 2-3 times/week 19 (4900) 18 19 ≥4 times/week 1.5 (350) 1.3 1.8 aConfidence interval
In the MHE 2007 study about 40 % of the participants reported that they consumed fish less than once per week whereas 39 % consumed fish about once per week (Table 2). Around 20 % of the respondents reported eating fish 2-3 times per week or more, which is lower lower than reported for Riksmaten 2010. The difference between the Riksmaten and the MHE surveys may depend on the fact that the questions on fish consumption were posed differently. For example, in the Riksmaten surveys shellfish was included in the questions, which was not the case in the MHE surveys.
Similarly as in the Riksmaten studies, fish consumption increased with increased age in the MHE surveys. Among women between the ages of 18-24, 15 % reported consumption of fish twice a week or more, whereas 31 % of the respondents between the ages of 65 and 80 reported this frequency of fish consumption. Similar results were reported for men.
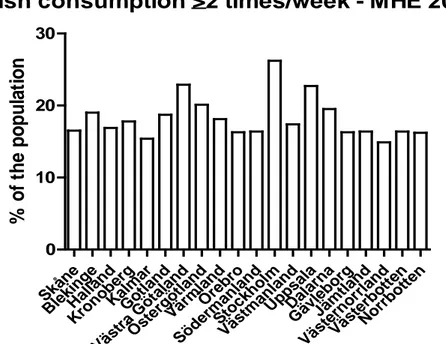
An analysis of the proportion which followed the SNFA fish recommend-dations in different regions of Sweden revealed that the Stockholm County had the largest proportion of consumers that consumed fish 2 times per week or more (Fig. 1).
Livsmedelsverkets rapportserie nr 21/2013 19
Fish consumption >2 times/week - MHE 2007
Skån e Bleki nge Hal lan d Kro nobe rg Kal mar Gotl and Väst ra G ötal and Öst ergö tland Värm land Öre bro Söde rman land Sto ckho lm Väst man lan d Upp sala Dal arna Gävl ebor g Jäm tlan d Väst ern orrla nd Väst erbo tten Nor rbot ten 0 10 20 30
%
of
t
he
popul
a
ti
on
Figure 1. The proportion of the population in different Swedish counties that followed
SNFA’s recommendations for fish consumption, based on data from the MHE 2007 study.
In the POPUP study of primiparous women in Uppsala the median consumption of fish during the year the women got pregnant was at the same level as in the Riksmaten studies (Table 1). In the POPUP study temporal trends in fish con-sumption were also studied (Fig. 2). Regression analysis of the results shows a significant increase of consumption between 1996 and 2006 (Fig. 2). If this result is representative for pregnant women from other parts of the country is however not known.
There is a concern that the fish consumption slowly has decreased due to the frequent news about the presence of environmental contaminants in fish. Data from the Riksmaten studies and the POPUP studies indicate that fish consumption has not decreased since the middle of the 1990’s. The POPUP study suggests an increased fish consumption among young women. With regard to salmon, the consumption has increased drastically (see the section “Salmon consumption” below).
Livsmedelsverkets rapportserie nr 21/2013 20
Fish consumption - POPUP study
1995 2000 2005 0 50 100 150 200 År g ram s/ d ay
Figure 2. Fish consumption among primaparous women in the POPUP study. The
positive association between year and fish consumption is statistically significant and implies an increase in average fish consumption of 2 grams/ day each year (regression analysis, p<0.001, N=293).
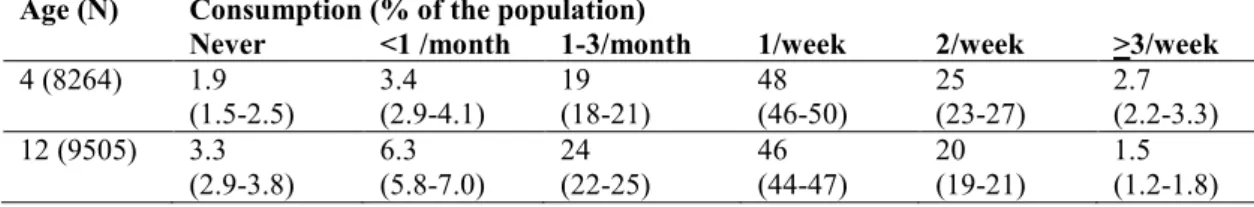
According to MHE 2003, 50 % of the children consumed fish once a week (Table 3). Twenty-eight percent of the four year old children ate fish twice or more each week, which is a larger proportion than that of younger women and men in the MHE 2007 study. However the proportion of children who ate fish twice or more often each week was lower among 12-year-olds (21 %), this was at that same level as for adult consumers in the MHE 2007 study (Tables 2 and 3).
Table 3. Fish consumption frequencies among children of different ages during the year
2003 (MHE 2003, mean and 95 % confidence interval) Age (N) Consumption (% of the population)
Never <1 /month 1-3/month 1/week 2/week >3/week
4 (8264) 1.9 3.4 19 48 25 2.7 (1.5-2.5) (2.9-4.1) (18-21) (46-50) (23-27) (2.2-3.3) 12 (9505) 3.3 6.3 24 46 20 1.5
Livsmedelsverkets rapportserie nr 21/2013 21
Baltic Sea (BS) herring consumption
All of SNFA’s investigations indicate that consumption of BS herring in general is low in Sweden (Table 4). The median consumption for adults is approximately 1 g/day which is about three servings per year (serving size 125 g). Over 50 % of the children in the Riksmaten 2003 study never ate herring (Table 4).
Table 4. Consumption of herring (g/day) in the SNFA studies
Study Study group (N) Mean SD Median 95th percentile
Riksmaten 1997-98 Women (618) 2.2 3.7 1.0 9.1 Men (597) 2.6 4.9 1.0 9.1 Riksmaten 2010 Women (375) 1.8 3.4 0.7 10 Men (297) 1.7 3.6 0.7 10 Riksmaten 2003 Children 4 yrs (584) 0.5 3.3 0 6.0 8 yrs (877) 0.6 1.6 0 3.2 12 yrs (1002) 0.2 0.5 0 1.1 POPUP (1996-2006) Women (325) 1.1 2.3 0 4.9 SD=standard deviation
The Riksmaten 1997-98 study revealed that there was a strong positive association between BS herring consumption and the age of the participant (linear regression p<0.001). The mean consumption increased from 0.4 g/day for women of ages 17-24 years to 5.2 g/day for women 65 years or older. Among men the mean consumption increased from 1.3 g/day to 7.7 g/day.
Women in childbearing age (17-45 yrs) in the Riksmaten 1997-98 study had a lower BS herring consumption than older women (46-75 yrs) (Table 5).
Seventy-nine percent of the younger women in the study ate herring at most three times per year, which is SNFA’s current recommendation for herring consump-tion for women in childbearing age. At the time of the investigaconsump-tion (1997-98) SNFA’s recommended that women in childbearing years should not to eat BS herring more than once a month. Seven percent of women in this group reported eating BS herring at this rate or more while one percent reported eating BS herring once per week. Since 1995 the SNFA has recommended that men and older women should not eat BS herring more than once per week. The majority of both men and older women in the Riksmaten 1997-98 study had a BS herring consumption which did not exceed this recommendation (Table 5).
Table 5. BS herring consumption frequencies among men and women during the year
1997-98 as reported in Riksmaten 1997-98
Age (N) Consumption (% of participants)
Never 3/yr 6/yr 1-3/month 1/week >1/week
Women 17-45 yr (347) 55 24 14 6 1 46-84 yr (268) 22 26 22 25 5
Livsmedelsverkets rapportserie nr 21/2013 22
In the MHE 2007 study about 80 % of the women in childbearing age (18-45 yrs) rarely or never consumed BS herring, which is in concordance with the data from the Riksmaten 1997-98 study (Table 5 and 6). In MHE 2007 5.8 % of the women in this age group consumed BS herring 2-3 times per month. This is a much higher consumption than currently recommended by SNFA as a measure to protect young women from high body burdens of dioxins and dl-PCBs at preg-nancy. Of a population of 1,647,000 women between the ages of 18-45 in Sweden in 2007 (SCB 2010), about 100,000 women ate BS herring 2-3 times or more often each month. About 2 % of these young women consumed BS herring once a week or more which corresponds to about 35,000 women in their childbearing years in the year 2007.
Table 6. BS herring consumption frequencies among men and women during the year
2007 (MHE 2007, mean and 95 % confidence interval) Age (N) Consumption (% of population)
Seldom/never 1/month 2-3/month 1/week 2-3/week ≥4/week
Women 18-45 yrs (5674) 83 (82-84) 11 (10-12) 3.7 (3.0-4.5) 1.5 (1.1-2.1) 0.5 (0.3-0.9) 0.1 (0.1-0.4) 46-65 yrs (5283) 63 (61-65) 21 (19-22) 9.7 (8.6-11) 5.0 (4.2-5.9) 1.2 (0.8-1.8) 0.5 (0.2-0.9) 66-80 yrs (2665) 36 (34-39) 26 (23-28) 16 (14-19) 18 (16-20) 3.6 (2.7-4.7) 0.2 (0.1-0.6) Men 18-45 yrs (4326) 73 (71-75) 18 (16-20) 5.4 (4.6-6.5) 3.3 (2.6-4.1) 0.1 (0.0-0.3) 0.1 (0.1-0.6) 46-65 yrs (4588) 55 (53-57) 25 (23-26) 12 (11-14) 7.2 (6.2-8.3) 0.9 (0.6-1.3) 0.2 (0.1-0.4) 66-80 yrs (2312) 33 (30-35) 27 (24-29) 20 (17-22) 18 (16-20) 2.9 (2.1-4.0) 0.6 (0.3-1.3)
Among women between the ages of 45 and 65 years, there were 1.7 % who consumed BS herring more often than once a week, which is more than the current recommendations set by the SNFA. Based upon a population of 1,186,912 women in this age group in the year 2007, about 20,000 women consumed BS herring more often than the SNFA recommendations. Using the same principles of estimation, MHE 2007 revealed that about 22,000 women between the ages of 66 and 80 years consumed BS herring more often than recommended, based upon a population of 590,100 women in this age group. The same calculations for men show that about 3,000 men between the ages of 18-45 consumed BS herring more often than the SNFA recommendation. For men between the ages of 46-65 years, the corresponding number was 13,000 and among men in the age group of 66-80 years there were about 18,000 who did not follow the recommendations.
Livsmedelsverkets rapportserie nr 21/2013 23
Table 7. BS herring consumption frequencies among women in childbearing age living in
the northernmost counties of Sweden during the year 2007 (MHE 2007, mean and 95 % confidence interval)
County (N) Consumption (% of population)
Seldom/never 1/month 2-3/month 1/week
Gävleborg 84 7.6 4.1 4.0 (67) (73-92) (3.1-17) (1.3-12) (1.0-15) Västernorrland 86 11 2.2 0.9 (215) (81-91) (6.8-16) (0.9-5.3) (0.2-3.8) Jämtland 83 11.4 4.0 1.7 (72) (72-90) (5.7-21) (1.3-12) (0.2-11) Västerbotten 87 11 1.3 2.8 (200) (79-89) (7.5-16) (0.4-4.0) (1.3-6.3) Norrbotten 86 11 1.5 2.5 (70) (75-92) (5.2-20) (0.2-10) (0.6-9.5)
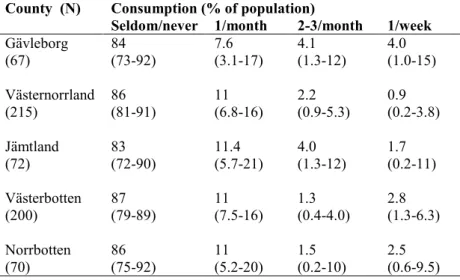
Since the levels of dioxins and dl-PCBs are higher in BS herring from the coast of northernmost part of Sweden than in the rest of the Baltic Sea, a more detailed analysis of BS herring consumption in the northernmost counties was conducted. This analysis shows that consumption of BS herring among women in their childbearing years was in general low (Table 7). However, a few percent of these women reported that they consumed BS herring 2-3 times a month or more, with the county of Gävleborg having the largest proportion of young women eating BS herring this often. The wide confidence intervals for the percentages show that the differences were not statistically significant (Table 7).
Table 8. BS herring consumption frequencies among children of different ages during the
year 2003 (MHE 2003, mean and 95 % confidence interval) Age (N) Consumption (% of population)
Never <1/month 1-3/month 1/week 2/week >3/week
4 yr 65 31 3.4 0.9 0.1 0.1 (8264) (63-66) (29-33) (2.8-4.0) (0.6-1.3) (0.1-0.3) (0.0-0.4) 12 yr 64 31.2 4.3 0.7 0.1 0.0 (9505) (62-65) (30-32) (3.8-4.9) (0.5-1.0) (0.1-0.3) (0.0-0.1)
Data for BS herring consumption among children in Sweden comes from the Riksmaten 2003 and the MHE 2003 study. More recent data is not available for children. However in the 2010 SNFA Knowledge study it was estimated that 93 % of families with small children consumed BS herring at the most a few times per year which is in line with the current recommendations. Six percent of the families with young children did however report a BS herring consumption of several times per month, which indicates that there is a group of children in
Livsmedelsverkets rapportserie nr 21/2013 24
Sweden who eat more BS herring than is recommended by SNFA. This is in concordance with data from the MHE 2003 study where 4-5 % of the children ate BS herring once a month or more (Table 8). Based upon the population in Sweden 2003 (SCB 2010), there were about 4,000 4 year old children who consumed more than is recommended. About 6,600 12 year old children consumed BS herring more often than recommended. Assuming that there are about 5000 children in each age group between 4 and 12 who do not follow the
recommendations, then there were approximately 45,000 children in total who did not follow the recommendations.
In the Riksmaten 2003 study about 70 % of the children in the ages of 4, 8 and 12 never consumed BS herring. About 90 % of the children had a
consumption which was within the limits of the current recommendations (2-3 times per year), which corresponds with the percentages for 4 and 12 year old children in the MHE 2003 study, as well as with the consumption among families with small children in the SNFA’s Knowledge study. In Riksmaten 2003,
consumption of BS herring more than once a month was reported for 2.3% of the 4 and 8 year old children and for 3.2 % of the 12 year old children.
In the MHE 2003 study it was reported that about 95 % of four year old children who lived in the northernmost counties of Sweden, consumed BS herring more seldom than once per month (Table 9). The county of Jämtland had the highest percentage of four-year-olds that did not eat herring while the county of Norrbotten that had the lowest percentage who never ate herring. The differences among 12 year old children were not as great, but the county of Jämtland still had the highest proportion of children who did not eat BS herring (Table 9). Between 3-5 % of four year old children consumed BS herring once per month or more often, while the corresponding proportion for 12 year old children was 2-7 %. The uncertainty of these data was however relatively large (Table 9).
Table 9. BS herring consumption frequencies among children of different ages living in
the northernmost counties of Sweden during the year 2003 (MHE 2003, mean and 95 % confidence interval)
County (N) Consumtion (% of population)
Never <1/month 1-3/month >1/week
4 yr Gävleborg (162) 59 (51-66) 37 (30-45) 3.4 (1.4-8.0) 0.5 (0.1-3.4) Västernorrland (244) 62 (56-68) 34 (29-41) 2.7 (1.2-6.1) 0.7 (0.1-4.8) Jämtland (189) 71 (64-77) 26 (20-33) 2.7 (1.1-6.5) 0.0 Västerbotten (173) 61 (54-68) 35 (28-42) 2.7 (1.1-6.4) 1.6 (0.5-4.9) Norrbotten (156) 47 (39-55) 49 (41-56) 4.6 (2.2-9.3) 0.0 12 yr Gävleborg (146) 60 (51-68) 33 (26-42) 5.8 (2.8-11.3) 1.0 (0.3-4.1) Västernorrland (223) 61 (54-68) 35 (29-42) 2.9 (1.2-6.9) 1.0 (0.2-4.0) Jämtland (174) 71 (63-77) 28 (21-35) 1.8 (0.6-5.6) 0.0 Västerbotten (175) 65 (58-72) 31 (24-38) 4.3 (2.0-8.7) 0.0 Norrbotten (167) 63 (55-70) 34 (27-42) 2.4 (0.9-6.6) 0.7 (0.1-4.9)
Livsmedelsverkets rapportserie nr 21/2013 25
Salmon consumption
The compilation of data on salmon consumption in Sweden shows a notable increase among adults since the end of the 1990’s (Table 10). Data on time trends for children is lacking but the situation is most likely similar for children and adults. In the Riksmaten 1997-98 study, the median salmon consumption was estimated to 1 gram per day (median value) for both men and women. The
preliminary data from the Riksmaten 2010 study indicate a ten-fold increase in the median consumption among women and a four-fold increase among men. The salmon that are consumed are mainly farmed (see the per capita calculations below). In the POPUP study there was a statistically significant increase in salmon consumption between the years of 1996 and 2006 (Fig. 3).
Table 10. Salmon consumption in SNFA’s studies (g/day)
Study Sex (N) Mean SD Median 95th percentile
Riksmaten 1997-98 Women (618) 2.7 4.8 1.0 9.4 Men (597) 2.6 4.2 1.0 9.4 Riksmaten 2010 Women (375) 9.4 9.8 10 18 Men (297) 7.6 7.9 4.1 18 Riksmaten 2003 Children 4 yr (584) 1.8 2.8 0.5 6.4 8 yr (877) 3.1 7.8 0.7 16 12 yr (1002) 3.1 6.4 0.7 14 POPUP (1996-2006) Women (325) 6.8 8.8 3.9 21 SD=standard deviation
POPUP - salmon consumption
1995 2000 2005 0 10 20 30 40 50 83 Year g/ da y
Figure 3. Salmon consumption among primaparous women in the Uppsala area
1996-2006 (POPUP-study). The increase is statistically significant and corresponds to an average increase in consumption of 0.7 grams/day and year (regression analysis, p<0,001, N=293).
Livsmedelsverkets rapportserie nr 21/2013 26
Consumption of fermented BS herring
Consumption of fermented BS herring is very low in Sweden. In the SNFA Knowledge 2010 it was reported that among families with small children, which include both risk groups of children and women in their childbearing years, 84 % reported never eating fermented herring, 6 % consumed the product only at the once-yearly fermented BS herring festivity, and 9 % a few times per year. Among the general population only 5 % reported eating fermented BS herring 3-5 times per year. Among professional fishermen 13 % consumed the product more than five times each year.
Consumption of fish caught by anglers
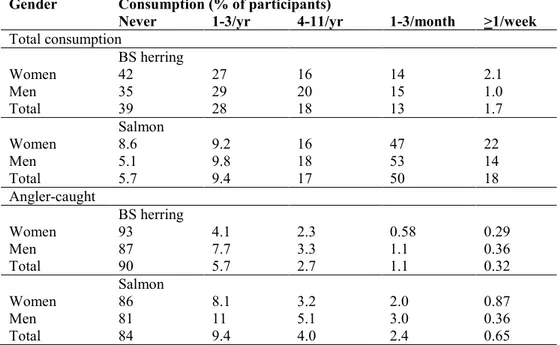
There is a lack of knowledge about consumption of BS herring and wild salmon from the Baltic Sea, Lake Vänern and Lake Vättern that are caught by the con-sumers themselves (“angler-caught”). In Riksmaten 2010 (adults), however, there is a question about consumption of angler-caught salmon and BS herring. In the end of October 2010 666 participants had answered this question and a complete data analysis cannot be done before the Riksmaten 2010 study is concluded. Preliminary results show that angler-caught salmon was eaten by 16 % of the participants, while 94% of them reported eating salmon in general (Table 11). Ninety-two percent responded that they never or at most 1-3 times each year ate angler-caught salmon. The corresponding percentage for consumption of salmon in general was 15 %. Only 0.65 % responded that they ate angler-caught salmon once a week or more. The consumption of salmon in general at the same rate was reported by 18 % of the participants. Overall the Riksmaten 2010 survey indicates that consumption of angler-caught salmon was very small in relation to the
consumption of salmon in general, the latter most probably mainly bought in the store.
If the participants in the Riksmaten 2010 are representative for the entire adult population in Sweden, then approximately 40,000 consumers consumed angler-caught salmon at least once a week. This number is uncertain since the number of participants in Riksmaten 2010 was low. If the consumption of angler-caught salmon in this group on average is about once per week, then about 300 tons of angler-caught salmon was consumed in 2010. This corresponds well with the 400 tons of wild salmon that the Swedish Board of Fisheries reports were caught by sport fishermen in the year 2006.
Ninety-six percent of the participants in the Riksmaten 2010 responded that they at most consumed angler-caught BS herring 1-3 times per year (Table 11). The corresponding percentage for the total herring consumption was 67 %. About 1.4 % reported that they consumed angler-caught herring once a month or more, while 15 % reported the same consumption frequency of BS herring in general. The results indicate that the consumption of angler-caught herring is small in relation to the total herring consumption.
Livsmedelsverkets rapportserie nr 21/2013 27
Table 11. BS herring and salmon consumption frequencies among adults participating in
Riksmaten 2010 divided into total consumption and consumption of fish caught by the consumers themselves (angler-caught, N=666, mean and 95 % confidence interval) Gender Consumption (% of participants)
Never 1-3/yr 4-11/yr 1-3/month >1/week
Total consumption BS herring Women 42 27 16 14 2.1 Men 35 29 20 15 1.0 Total 39 28 18 13 1.7 Salmon Women 8.6 9.2 16 47 22 Men 5.1 9.8 18 53 14 Total 5.7 9.4 17 50 18 Angler-caught BS herring Women 93 4.1 2.3 0.58 0.29 Men 87 7.7 3.3 1.1 0.36 Total 90 5.7 2.7 1.1 0.32 Salmon Women 86 8.1 3.2 2.0 0.87 Men 81 11 5.1 3.0 0.36 Total 84 9.4 4.0 2.4 0.65
The Swedish Board of Fisheries has estimated that 1,800 tons of Baltic herring/Atlantic herring was caught by sport fishermen in 2006. Between 2007 and 2009 about 20,000 tons of BS herring were caught commercially. Conse-quently, the annual catch of BS herring/Atlantic herring by sportfishers was less than 10 % of the annual commercial catch of BS herring. The Swedish Board of Fisheries did not give information about the proportion of BS herring in the annual catch of BS herring/Atlantic herring by sportfishers.
In SNFA’s Knowledge study 2010, 200 professional fishermen were asked about their consumption of BS herring and wild-caught salmonid fish from the Baltic Sea and the lakes Vänern and Vättern. It is assumed that a large proportion of the fish that the professional fishermen eat are from their own catches. Only 15 % of them reported that they never or seldom ate BS herring or salmonid fish. Sixty-three percent answered that they consumed BS herring or wild-caught salmonid fish once a week or more. This confirms the result from earlier studies of fish consumption among the professional fishermen, i.e. they consume much more BS herring and wild-caught salmon than other consumers in Sweden (Ankarberg, Aune et al. 2007).
Livsmedelsverkets rapportserie nr 21/2013 28
Per capita consumption of BS herring and wild salmonids
Per capita consumption of fish gives a measure of the average consumption of fish available on the market in Sweden. The calculations for BS herring and wild-caught salmonids from the Baltic Sea and the lakes Vänern and Vättern are based on the statistics from Swedish National Board of Fisheries on commercial catch volumes during 2007-2009 and on the number of inhabitants in Sweden who were one year or older in 2009. The per capita calculation is for whole, un-gutted fish and does not reflect the actual amount of fish that were eaten. Nor does it take into consideration that the consumption of the BS herring and wild-caught salmon most probably in reality is skewed; with many consumers who never or seldom eat these fish and a small proportion of the consumers who eat the great majority all fish consumed. The catch statistics for BS herring do not reveal information on how much of the fish that is exported to other countries.According to the Swedish National Board of Fisheries statistics a total of 18,932 tons of BS herring were caught for consumption during 2007, 22,244 tons during 2008 and 15,651 tons during 2009. On average about 19,000 tons of BS herring were caught for consumption in Sweden during the period 2007-2009. The per capita consumption BS herring is estimated to 2.06 kg/year if a population size of 9,228,562 consumers is used (population 2009 >1 yr of age) (SCB 2010). The per capita consumption of BS herring that is below 17 cm in size (catch of 13,800 tons/year) is 1.5 kg/year. BS herring below 17 cm in general have levels of dioxins and dl-PCBs below the maximum limits. The per capita consumption of herring that is over 17 cm is 0.55 kg/yr. Per capita consumption of BS herring with levels in general below the maximum limits is 1.9 kg/yr, including fish below 17 cm from all areas of the Baltic Sea and BS herring of all sizes in the southernmost part of the Baltic Sea (ICES areas 24 and 35). Consequently, only about 10 % of the per capita consumption consists of BS herring with dioxin and dl-PCB levels above the maximum limit. If the BS herring with the highest dioxin and dl-PCB levels from the northernmost ICES areas 30 and 31 consumes is assumed to be consumed only locally in in the northern counties then the per capita consumption of this kind of fish is about 1.4 kg/yr based upon a population of 1,164000 in the five northernmost counties county (age >1 yr) and a
consumption of 1,680,000 kg herring.
The average catch of wild-caught Baltic Sea salmon between 2007 and 2009 was about 300 tons/year according the Swedish National Board of Fisheries statis-tics. In Lake Vänern 16 tons and in Lake Vättern 1 ton were caught in 2009. With at population size of 9,228,562 this makes for a per capita consumption of wild caught commercial salmon of 30 grams per year. In this case no consideration was taken to the fact that the consumed amount of fish was lower due to the losses when the fish were cleaned. It is likely that the greatest consumption occurs locally which means that a small portion of the population can have significantly higher consumption than the per capita calculations indicate. The commercial catch of brown trout from the lakes Vänern and Vättern 2009 was 22 tons, resul-ting in a per capita consumption of about 2 grams per year. Also for this fish it
Livsmedelsverkets rapportserie nr 21/2013 29
may be that local consumption is most likely larger. The catch of arctic char from Lake Vättern during 2009 was 3 tons, which makes for a per-capita consumption of 0.3 gram per year. Once again the local consumption is likely to be much higher. According to the organisation ”Exportutvalget for fisk” in Norway, the farmed Norwegian salmon had 98 % of the Swedish market 2007 (Norsksjömat 2010). The export of salmon to Sweden was 32,000 tons which makes for a per capita consumption of about 3.5 kg/yr. A certain “re-export” of Norwegian salmon occurs from Sweden which means that the per capita consumption is somewhat overestimated.