Journal for Person-Oriented Research
2015, 1(3), 131-150Published by the Scandinavian Society for Person-Oriented Research Freely available at http://www.person-research.org
DOI: 10.17505/jpor.2015.15
131
Two Sides of the Same Coin:
Do the Dual ‘Types’ of Passion Describe
Distinct Subgroups of Individuals?
Julia Moeller
a, Melanie Keiner
b,
& Robert Grassinger
ca
Yale Center for Emotional Intelligence, 340 Edwards Street, P.O. Box 208376, New Haven, CT 06520-8376, U.S.A. b
University of Erfurt, Germany c
University of Augsburg, Germany
Email addresses:
julia.moeller@yale.edu; melanie.keiner@uni-erfurt.de; robert.grassinger@phil.uni-augsburg.de
To cite this article:
Moeller, J., Keiner, M., & Grassinger, R. (2015). Two sides of the same coin: Do the dual ‘types’ of passion describe distinct subgroups of individuals? Journal for Person-Oriented Research, 1(3), 131-150. doi: 10.17505/jpor.2015.15
Abstract: The fact that harmonious and obsessive passion are called ‘types of passion’ (Vallerand, 2012; Vallerand et al.,
2003) suggests that they describe subgroups of individuals. This study takes a person-oriented approach to examine groups of individuals with distinct profiles of harmonious passion (HP) and obsessive passion (OP). The aim of the study was to in-vestigate whether HP and OP describe types in the sense of distinct groups of individuals with different passion profiles (intra-individual constellations), or if HP and OP are instead two constructs with distinct outcomes but possible alignment within individuals. Toward this aim, we analyzed four different samples (Ntotal = 1149) of German and Brazilian adolescents and young adults. Using HP and OP as classification indicators, we compared three different classification procedures in terms of the resulting groups. We found that the previously applied classification based on z-scores of HP and OP was mis-leading, because it classified individuals as ‘obsessive’ who had reported higher HP than OP when responding to the original response scale. Alternative classification based on raw scores and cluster analyses revealed that most individuals experienced either co-occurring high HP and OP, or co-occurring low HP and OP, whereas the assumed mainly obsessive group was not found in any of our four samples. The general degree of passion rather than the distinction between harmonious and obsessive individuals accounted for inter-individual differences in passion, and related constructs such as dispositional approach mo-tivation, and affect. The findings were replicated in all four samples. This person-oriented approach gives novel and unique insights about inter-individual differences and intra-individual variation that can be easily overlooked or misunderstood in merely variable-oriented approaches, which prevail in prior research. Implications for the research on passion and pitfalls of z-scores in profile analyses are discussed.
Keywords:
passion, person-oriented approach, profiles, standardization, motivationMost passionate individuals strongly endorse the pas-sionate items from both subscales, making it impossi-ble to distinguish “pure” harmoniously passionate people (those who did not also endorse items from the obsessive subscale) from “pure” obsessively passion people without losing the majority of the sample to a mixed group. (Mageau et al., 2009, p. 613)
Introduction
Passion is a motivational construct that has been studied intensely during the last decade (for a review and for dis-cussion of related constructs, see Moeller & Grassinger, 2014a). The prior research is dominated by studies about differences between the adaptive ‘harmonious’ passion (HP) and the maladaptive ‘obsessive’ passion (OP; Vallerand et
Moeller et al.: Two sides of the same coin
132 al., 2003). HP and OP are often referred to as ‘types’ of passion. Previous studies have interpreted the differences between both types as differences between harmonious versus obsessive individuals, stating that harmoniously passionate individuals make adaptive experiences of their passionate activity whereas obsessively passionate individ-uals make maladaptive experiences of their passionate ac-tivity (Vallerand et al., 2003; Vallerand, 2012).
Since these assumptions relied mostly on variable- oriented analyses, this study adopted a person-oriented ap-proach to examine subgroups of individuals with distinct profiles of HP and OP. We apply different classification methods and discuss their advantages and disadvantages. Analyses of subgroups and intra-individual profiles lead to different conclusions than the variable-oriented approaches. Revising the classification methods applied in previous studies, we point out that group differences in regard to z-scores can be misleadingly interpreted, which has im-portant implications not only for the research on passion, but for many other fields.
The dual model of passion
Passion describes the inclination of a person towards an activity that the person likes, finds important, identifies with and spends a lot of time and energy with (Vallerand et al., 2003). Passion helps to explain why individuals persist committed in effortful courses of action, such as intensive and persistent training (Vallerand et al., 2007). Although many different definitions of passion have been suggested in the psychological literature (Cardon, Wincent, Singh, & Drnovsek, 2009; Fredricks, Alfeld, & Eccles, 2010; Frijda, 2007; Moeller & Grassinger, 2014a; Renzulli, Köhler, & Fogarty, 2006; Solomon, 1993; Sternberg, 1997), the dual model of passion from Vallerand et al. (2003) is the most pervasive in the field.
This model states that passionate individuals identify with their passionate activity, and that a voluntary, autono-mous internalization of the activity leads to harmonious passion, whereas the internalization due to internal or ex-ternal constraints leads to obsessive passion (Mageau et al., 2009). The previous research has mostly focused on the distinction between HP and OP and their differences re-garding predictors, correlates, and outcomes. The compo-nents of the dual model of passion are measured with the passion scale (Vallerand et al., 2003), which comprises one subscale tapping general criteria of passion to distinguish between non-passionate and passionate individuals (exam-ple item: “This activity is important for me”), a second subscale assessing HP (example item: “This activity is in harmony with the other activities in my life.”) and a third subscale assessing OP (example item: “The urge is so strong. I can’t help myself from doing this activity.”). HP typically predicts and correlates with positive experiences such as psychological and physical well-being (e.g, Valle-rand 2012), positive affect during and after activity
en-gagement (Philippe, Vallerand, Houlfort, Lavigne, & Donahue, 2010), and maintained control over the activity (Vallerand, et al., 2003; Mageau, Vallerand, Rousseau, Ratelle, & Provencher, 2005). In contrast, OP often corre-lates with maladaptive experiences such as loss of control, symptoms of dependency (Philippe & Vallerand, 2007), negative affect during activity engagement and when the individual is prevented from doing the activity (Vallerand et al., 2003), and ill-being (Rip, Fortin, & Vallerand, 2006; Vallerand et al., 2003).
Are ‘types of passion’ types in the sense of
subgroups of individuals?
Several researchers interpret these findings as differences between distinct groups/profiles in HP and OP, assuming that individuals are either predominantly harmoniously or predominantly obsessively passionate, as seen in statements like the following: “People with an HP are able to decide to terminate the relationship with the activity if they decide it has become a negative factor in their life.” (Vallerand et al., 2003, p. 758), and “people with an obsessive passion can thus find themselves in the position of experiencing an un-controllable urge to partake in the activity they view as important and enjoyable.” (Vallerand, 2012, p. 3). The statement that harmonious individuals were happier and better adapted (Vallerand et al., 2012) suggests that the findings regarding HP and OP not only describe co-variation among the studied population, but the experi-ences of particular individuals.
However, previous studies rarely examined differences between groups of harmonious versus obsessive individuals but rather analyzed correlations or regressions between HP, OP, and relevant predictors, correlates, and outcomes across individuals. While this helps to understand the overall rela-tion between the measures of HP, OP, and their different correlates, it has been criticized that the analyses of co-variation on the level of a population often does not describe the experiences of real individuals (Bergman & Magnusson, 1997; Molenaar, 2004; Reizle, 2013). A popu-lation might consist of distinct subgroups of individuals, in each of which the relation between the studied variables might be different than the overall correlation suggests. For instance, the negative correlation between school engage-ment and school burnout hides a substantial subgroup of individuals who experience high levels of both engagement and burnout (Tuominen-Soini & Salmela-Aro, 2014; Salmela-Aro, Moeller, Schneider, Spicer & Lavonen, 2015). Moreover, paths between multiple variables that seem sig-nificant and meaningful in path analyses do not necessarily describe the individual experience, because the individuals that drive the correlation between variable A and B are not necessarily the same that drive the correlation between variable B and C (see Reizle, 2013).
The conditions under which general trends like correla-tions hold true on the level of individuals (and not only on
Journal for Person-Oriented Research, 2015, 1(3), 131-150
133 the level of a population) are strict and rarely met (Mo-lenaar & Campbell, 2009). Consequently, the well-studied fact that HP and OP have different correlates, predictors and outcomes (despite their substantial correlation with each other) neither indicates that individuals experience either a predominantly harmonious or a predominantly ob-sessive passion, nor that experiencing OP is necessarily accompanied by low HP, low positive affect, low control over the activity, etc. Similarly, it might be that despite their different correlates, HP and OP are experienced together, rather than occurring in profiles of either predominating HP, or predominating OP. It might also be that the relation be-tween the items of HP and OP differs across subgroups of individuals (e.g., hobby gardeners versus Olympic athletes in intense pre-competition training), across time within individuals, or across activities that differ in how demand-ing or competitive they are. For instance, an activity might become more difficult to harmonize with other activities when the passionate individual has young children to take care of, or when a grant proposal deadline is approaching. Factors, correlations between factors, and item-factor load-ings, might change across time or across groups of inviduals (for a detailed discussion, see the concept of di-mensional identity; von Eye & Bergman, 2003).
The fact that HP and OP are called ‘types of passion’ (Vallerand, 2012; Vallerand et al., 2003) suggests that they describe subgroups of individuals. In the psychological literature, the term ‘types’ often describes homogeneous groups of individuals, which are characterized by a specific profile in the variables that are of interest for the current analysis. Individuals of the same type display similar pro-files and differ substantially from propro-files of individuals belonging to other types. Examples of psychological ty-pologies are the classification of criminal offenders into differrent homogeneous groups with different recidivism risk and different needs for treatment (e.g. Simourd et al., 1994), and the classification of individuals with psycho-pathological symptoms according to the onset of the prob-lems and the prognosis of their development (e.g. Millon et al., 1996). The classic methods to classify individuals with similar profiles into homogeneous groups and to identify the distinct groups within a sample are cluster analytical approaches.
Classification of passion types in the previous
literature
In contrast to classic typologies, few studies that labeled HP and OP ‘types’ really examined groups of individuals. Exceptions are the studies from Mageau et al. (2009), Philippe, Vallerand, & Lavigne (2009), and Vallerand and Houlfort (2003), who classified the individuals in their samples into three different groups: (1) non-passionate, (2) mainly harmonious and (3) mainly obsessive individuals. To distinguish passionate from non-passionate individuals, the authors used between three and four of the criteria for
general passion (liking, finding important, investing re-sources and labelling the activity as a passion). Individuals with a score above the scale midpoint were defined as pas-sionate, and all others as non-passionate. Then the passion-ate individuals were subdivided into the harmonious and the obsessive group by the following procedure: The sub-scales for HP and OP were z-standardized across all indi-viduals (including non-passionate), and passionate individ-uals with higher z-scores for HP than OP were classified as ‘harmonious’, while passionate individuals with higher z-scores in OP than HP were classified as ‘obsessive’. We will call this the z-score based grouping procedure below.
These studies found the expected group differences. For instance, individuals who experienced stronger autonomy were more likely to be classified at later time points as ‘harmonious’ than as ‘obsessive’, while in contrast indi-viduals who strongly valued activity specialization and strongly identified with the activity were more likely clas-sified as ‘obsessive’ at later time points (Mageau et al., 2009). Also, the ‘harmonious’ group reported higher well- being than the ‘obsessive’ group (Philippe et al., 2009).
To our knowledge, there is only one study using cluster analysis on the dual model passion scale, conducted by Wang, Khoo, Liu, and Divaharan (2008). The authors used the scores of HP and OP as indicators in a hierarchical cluster analysis and found unexpectedly that harmonious and obsessive levels were aligned in the resulting clusters, meaning that participants in the sample scored either both high, both moderate, or both low. There was no mainly obsessive group. The generalizability of these findings was limited because the study was conducted in only one activ-ity context (digital gaming). Therefore replications are re-quired.
Some reflections on differences and possible
misinterpretations of z-scores and raw-score
classifications
The z-score-based classification procedure applied by Mageau et al. (2009), Philippe et al. (2009), and Vallerand and Houlfort (2003), differs from classic cluster analyses in that it forces individuals into theoretically assumed groups using theory-based cut-offs, whereas cluster analyses esti-mate the number and variable profiles of the groups induc-tively, based on, for example, log likelihood or Euclidean distances between individual observations, and groups of observations. Unlike cluster analyses, the z-score-based classification procedure does not take into account the size of the difference between an individual’s HP and OP scores, meaning an individual with zHP=1.000 and zOP=0.999 would be classified as ‘harmonious’, even though the dif-ference of 0.001 between HP and OP might be uninforma-tive. Also, the classification into passionate and non- passionate individuals based on the scale midpoint of the passion criteria subscale is relatively arbitrary, given that this cut-off is not based on empirical group differences and
Moeller et al.: Two sides of the same coin
134 varied between previous studies (Mageau et al., 2009; Philippe et al., 2009).
Further, in contrast to cluster analyses, which may detect all relevant types in the data, the z-score based classifica-tion procedure risks overlooking groups of individuals with other than the expected profiles. For instances, there might be a group with high scores in both HP and OP (see e.g. Wang & Yang, 2007), which cannot be detected with the z-score based procedure unless an individual’s HP and OP z-scores are exactly the same. Moreover, the interpretation of the groups created with the z-score-based procedure might be misleading, given that both the ‘harmonious’ and the ‘obsessive’ group displayed higher raw scores of HP than OP (Mageau et al. 2009; Wang & Yang, 2007). One reason for that is the fact that the raw mean score of HP is generally higher than the raw mean score of OP (Mageau et al., 2009). Therefore, a high sample rank in OP (high OP z-score) can be at the same or lower level on the original response scale than a moderate rank (z-score) in HP.
There are several potential problems with z-scores: First, raw scores reflect the original frame of reference and an individual’s acceptance versus rejection of an item much better than z-scores do. Second, raw scores provide infor-mation about absolute distances between two measure-ments, whereas z-scores obfuscate this information. We explain these problems in the following:
Reference Frame. The typical instruction for the dual model passion scale is “While thinking of your favorite activity and using the scale below, please indicate your lev-el of agreement with each item” (Vallerand et al., 20031
). The response scale for both HP and OP is: 1 = not agree at all, 2 = very slightly agree, 3 = slightly agree, 4 = moder-ately agree, 5 = mostly agree, 6 = strongly agree, 7 = very strongly agree. The original response scale is the reference frame that an individual uses to report how strongly he or she agrees to a given passion item. The order of items of both scales is mixed, which suggests that individuals really used the same reference frame when rating their agreement to these items. It is important to notice that any score below the scale midpoint (= 4) probably means that an individual disagrees more than agrees with the item statement. Z-standardized scores reflect a different reference frame: A z-score reflects the rank of an individual’s answers in rela-tion to the answers of all other individuals in the same sample. If a variable has a very low acceptance among the sample (= high item difficulty), then a z-score above the mean can still reflect that the person rather denied most OP items, just less strongly than others denied these items (see e.g. the OP mean score in our studies 1 and 4 below).
Raw scores reflect the degree to which an individual af-firms or rejects item statements, whereas this information gets lost in z-scores. Therefore, it is of questionable validity
1
See also
http://www.er.uqam.ca/nobel/r26710/LRCS/echelles_en.htm
to interpret an OP score of 3.8 as “high OP”, because in the original frame of reference this score reflected more rejec-tion than acceptance of the OP items. However, because of the low mean score of OP (see Table 2), this low raw score would be interpreted as a comparably high z-score in many samples. In contrast, because of the rather high average of HP, an individual’s score of 5.0 would be rated as general acceptance of HP items based on raw scores, but as a “ra-ther low” score based on z-scores, because 5.0 is below the sample average (in all our four samples, see Table 2). Par-adoxically, the sample-level mean difference between over-all high HP and overover-all low OP has the consequence that an individual can rate most OP items with “slightly agree/ disagree”, and most HP items with “mostly agree”, and might still end up with a higher z-score for OP than for HP. Another person might rate all HP and OP items with “4” (meaning rather indecisive), and still get a higher z-score for OP than HP. This makes it impossible to interpret the psychological meaning of z-score based OP-HP-profiles.
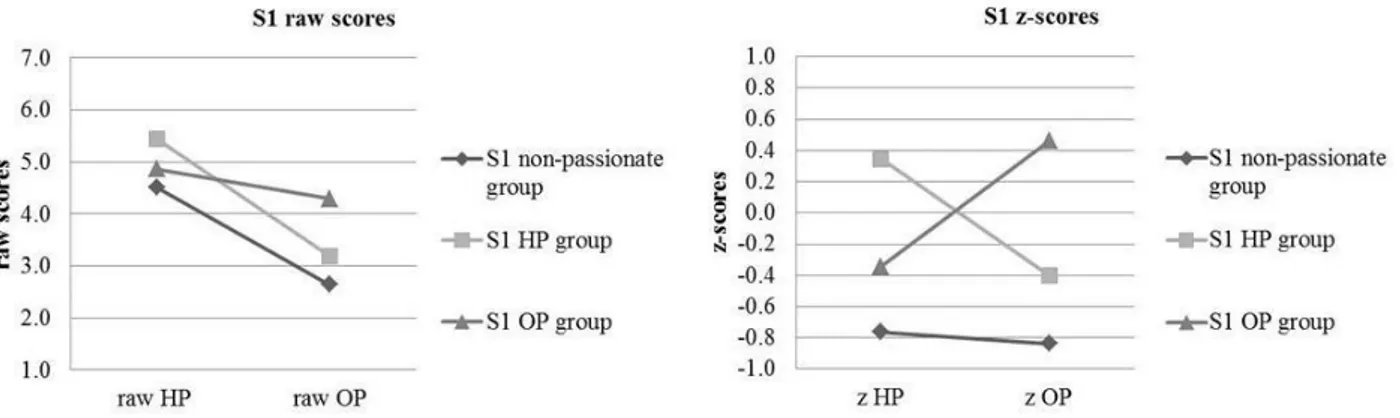
Absolute distances. Other information lost in z-scores is the absolute distance between two measurements. Imagine you want to plot the mean-level difference between two groups (see Figure 1). Using raw scores shows the absolute distance between the groups if the complete response scale is shown (and a truncated Y-axis should be avoided because it is considered misleading). In contrast, if z-scores are dis-played, then in most cases the resulting graph only shows the part of the range of possible answers where variance (= group differences) was found. That equals zooming into the picture, and makes eventually small differences look big. This is illustrated in Figure 1, which compares the raw and z-scores of the groups created with the z-score-based grouping procedure in sample 1.
In sum, very few studies on passion have tried to scribe subgroups of individuals. Most studies have de-scribed only the co-variation of HP, OP, and their correlates, predictors and outcomes on the population level. The few attempts to describe individual profiles of HP and OP so far have not supported the assumed duality of mainly harmo-niously passionate individuals versus mainly obsessively passionate individuals. However, this requires systematic replication.
The present research: Do the ‘types of passion’
describe distinct subgroups of individuals?
This present study investigated whether the well- established duality of HP versus OP describes distinct groups of mainly harmonious versus mainly obsessive in-dividuals. For this purpose we first examined with our own data the implications and possible interpretations of the z-score based grouping procedure that previous studies ap-plied to distinguish such groups. In a second step, across four samples we examined classifications based on raw scores and conducted cluster analyses to explore groups and their profiles of HP and OP.
Moeller et al.: Two sides of the same coin
135
Figure 1: Illustrating the loss of information about absolute distances through z-standardization: Raw scores (left) and z-scores (right) of HP and OP in study 1.
Research questions
1) What characterizes the groups created with the z-score-based classification procedure?
1a) Do individuals who are labeled “obsessive” accord-ing to the z-score-based procedure display higher raw-scores in OP than HP?
1b) Do individuals who are labeled “harmonious” ac-cording to the z-score-based procedure display higher raw-scores in HP than OP?
We expected to find some misleadingly classified indi-viduals (labeled ‘obsessive’ by the z-score-based proce-dure, but experiencing higher HP than OP according to their original answers in the questionnaire), because Mageau et al. (2009) and Wang and Yang (2007) had found the trend that individuals generally report higher HP than OP raw scores across all groups. Possible mis-interpretations were examined in more detail.
2) Do alternative classification procedures such as grouping based on raw scores and cluster analysis also produce the expected groups of mainly harmonious and mainly obses-sive individuals?
2a) The raw-score based classification procedure forces individuals into either the mainly harmonious or the mainly obsessive group. Because of the generally higher levels of raw HP than OP, we expected that this proce-dure leads to a large group of ‘mainly harmonious’ and a rather small group of ‘mainly obsessive’ individuals. 2b) With cluster analyses, we expected to find groups with generally high or low levels in both HP and OP, as found previously by Wang et al. (2008).
Methods
Samples
Passion and related constructs were assessed in four dif-ferent samples, which were analyzed separately in order to test the replicability of the findings. Two samples of indi-viduals responded to the passion items with reference to their most important favorite activity (sample one and two) and two samples responded with reference to particular leisure activities that they were practicing (sample three: leisure soccer; sample four: leisure dance and martial arts). These samples were selected because they resembled much the samples used in prior studies about the dual model of passion (in study 1 and 2, our assessment procedure was very similar to that of Vallerand et al., 2003; study 1, and in the studies 3 and 4, we used similar samples to those of Vallerand et al., 2003, study 2; Vallerand, Mageau, et al., 2008, study 1; and Mageau et al., 2009, study 2), so that our findings should be generalizable to what we would ex-pect to find in the populations studied before by other re-searchers. Moreover, we selected these samples to check whether our findings would be replicated across different domains of leisure activities, different age groups (adoles-cents to mainly young adults), and different nationalities (Germany in the studies one, three and four; Brazil in study two).
Table 1 gives an overview about the samples and applied measures, which are described in detail below. Detailed information about the measures’ reliabilities, validities, psychometric properties (item difficulty, skewness, curtosis, item-factor loadings, etc.), inter-correlations between sub-scales, and exact item wordings were documented by Moeller & Grassinger (2014b), and Moeller, Keiner, & Wächter (2014).
Moeller et al.: Two sides of the same coin
136 Table 1
Samples and Assessment
Sample Assessment N Instruments
1 German undergraduate students (Universities of Erfurt and Augsburg),
471 Dual model passion scale a, com.pass scale b,
Affect scalec 2 Brazilian adolescents in two private schools in Rio de
Janeiro
274 Dual model passion scale a, com.pass scale b,
sport commitment scaled 3 German adolescent soccer player, online survey and
paper-&-pencil questionnaires
278 Dual model passion scale, com.pass scale a,
sport commitment scaled, BASe,
Affect scale: PANASf 4 German leisure Dancers (149), martial arts practitioners
(95)
244 Dual model passion scalea, com.pass scale b, BASe,
Dependency measure EAIg
Note. a = Dual Model Passion Scale (Vallerand et al., 2003), b = com.pass scale (Moeller & Grassinger, 2014b); c = Affect Scale (Kessler & Staudinger, 2009); d = Sport Commitment Scale (Sousa et al., 2008); e = Behavioral Activation, subscale of the BIS/BAS scale (Carver & White, 1994; Strobel, Beauducel, Debener, & Brocke, 2001); f = Positive Negative Affect Schedule (Krohne, Egloff, Kohlmann, & Tausch, 1996); g = Exercise Addiction Inventory (Terry, Szabo, & Griffiths, 2004).
Participants of sample one
353 undergraduate students from the University of Erfurt (Germany) responded to questions in the lecture rooms between 2010 and 2013. Four participants were excluded from further analyses for not describing any passionate activity. The remaining 349 students were on average 23.63 years old (SD = 3.22), 67.0% were female. All participants studied psychology or a pedagogic major subject.
Participants of sample two
274 Brazilian private school students of two institutions were recruited in Rio de Janeiro in August 2012. The par-ticipants were on average 17.31 years old, 53.7% were fe-male. The schools in which the data collection took place were two affiliated institutes of the private school “Intel-lectus” in the districts Méier and Catete in Rio de Janeiro. The participants attended the ninth grade (10.6%), tenth grade (26.3%), eleventh grade (25.9%), or curses in prepa-ration for the university entrance exams (37.2%).
Participants of sample three
278 adolescent soccer players in the German federal state of Thuringia were surveyed in 2013. They were on average 14.87 years old. 99.1% were male. The sample was con-ducted in two steps. First, weblinks to the online survey were sent via mass e-mail to all soccer clubs in the German Fed-eral state of Thuringia by the Thuringian Soccer Association (Thüringer Fußball- Verband, TFV). Together with that
e-mail, the clubs also received flyers and posters for the announcement of the study. All trainers were asked to an-nounce the study with the help of these materials and to motivate all youth soccer players between 13 and 18 years to participate in the study. 48 individuals filled out the online questionnaires, two of them were excluded from further analyses because they were much older (> 27 years) than the target sample.
In order to achieve a larger sample size, we then contacted all Thuringian soccer clubs that trained competitive youth teams via telephone and e-mail for survey appointments. 17 clubs were then visited, and 234 participants filled out paper and pencil questionnaires during their soccer training les-sons.
Participants of sample four
Sample four consisted of 244 individuals (128 leisure dancers and 95 martial art practitioners), who were surveyed with paper and pencil questionnaires in their dancing schools and training gyms. The two groups were combined to one sample in order to allow for analyses that require larger sample sizes.
Among the dancers, 56.6% were females, the mean age was 26.85 years (SD = 13.0). On average, the participants had practiced dance for 7.75 years. Among the martial arts practitioners, 36.6 % were females, the mean age was 33.67 years (SD = 14.36). On average, the participants had prac-ticed martial arts for 9.33 years.
Moeller et al.: Two sides of the same coin
137 Table 2
Descriptive statistics and internal consistencies for the assessed scales
Sample 1 Sample 2 Sample 3 Sample 4
M SD α M SD α M SD α M SD α
Harmonious Passion a 5.15 .849 .73 5.29 .993 .69 5.48 .978 .89 5.35 .845 .73 Obsessive Passion a 3.70 1.266 .85 4.41 1.476 .87 4.34 1.540 .93 3.79 1.291 .85 General Passion criteria a 5.95 .722 .58 5.74 .905 .50 6.13 .876 .85 6.00 .991 .84 General Passion b 4.45 .734 .91 4.63 .745 .88 4.74 .715 .96 4.50 .662 .91
Commitment c 4.24 .595 .74 4.22 .699 .83
Dispositional approach
moti-vation d 3.30 .417 .86 3.10 .375 .76
Positive Affect e 4.00 .526 .75 4.16 .647 .91
Negative Affect e 1.47 .423 .75 2.35 .997 .92
Dependency f 3.14 .761 .73
Note. a = Dual Model Passion Scale (Vallerand et al., 2003), b =com.pass scale (Moeller & Grassinger, 2014b), c = Sport Commitment Scale (Sousa et al., 2008), d = BIS/BAS scale (Carver & White, 1994; Strobel, Beauducel, Debener, & Brocke, 2001), e = Positive Neg-ative Affect Schedule (Krohne, Egloff, Kohlmann, & Tausch, 1996), f = Exercise Addiction Inventory (Terry, Szabo, & Griffiths, 2004).
Measures and measurement properties
In all four studies we used two different passion scales (Moeller & Grassinger, 2014b; Vallerand et al., 2003) in order to ensure the generalizability of the findings across specific measures. The reliabilities and validities of the passion scales were found to be satisfying in all four studies (for details, see Table 2 for Cronbach’s α, and Moeller & Grassinger, 2014b, Moeller et al., 2014).
Measures of sample one
Passion was assessed with the Dual Model Passion Scale (Vallerand et al., 2003) and the com.pass scale (Moeller & Grassinger, 2014b). All constructs were measured with self-report questionnaires in German language. The students were instructed to name their three favorite activities, to rank these activities by importance, and to answer to all following questions in regard to the first ranked activity.
The Dual Model Passion Scale (Vallerand et al., 2003) consists of 18 items of which seven items are indicators for harmonious passion (α = .73), seven items are indicators of obsessive passion (α = .85), and four items are general pas-sion criteria (α = .58). The response scale ranged from 1 = do not agree at all to 7 = very strongly agree. The German version of the scale was obtained via iterative forth- and backwards translation and subsequent discussion.
The concurrent validity of the German version of the Dual model passion scale was confirmed in this sample by the findings of significant moderate correlations between the dual model subscales and other measures of passion and commitment, the positive correlation of HP with high arousal positive affect, and the negative correlation of HP with low arousal negative affect (Moeller & Grassinger, 2014b; see also Moeller et al., 2014). These analyses also revealed that the EFA showed the expected factor structure, but CFA indicated below-optimal model fit due to residual
correlations, which is in line with previous findings (e.g. Marsh et al., 2013).
To validate the findings, all participants filled out the second passion measure, the com.pass scale (Moeller & Grassinger, 2014b), comprising 21 items with the four subscales Continuous Intent to Engage (six items), Identi-fication (six items), Long-term Goals (five items), and De-sire (four items). All items were answered on a 6-point scale with a range from 1 = do not agree at all to 6 = very strongly agree. The passion score is computed as the means score of the subscales Desire and Commitment, the latter consisting of the subscales Intent, Identification, and Goals.
A subsample of 206 students from the University of Erfurt also filled out an affect scale (Kessler & Staudinger, 2009), which is an adaptation of the Positive Negative Affect Schedule (PANAS; Watson, Clark, & Tellegen, 1988). This affect scale assesses with four four-item subscales high arousal positive affect, low arousal positive affect, high arousal negative affect, and low arousal negative affect. To compare this measure with the PANAS affect measure ap-plied in study three, we disregarded the affective intensity and summarized the items to one subscale of positive affect (α = .75) and one subscale of negative affect (α = .75).
Measures of sample two
The Brazilian students were surveyed in classes with the same procedure applied in study 1. In this sample, we used Portuguese versions of the above-described two passion scales. Both passion scales were independently translated into Portuguese by two Brazilian translators (one junior and one senior lawyer, both fluent in English with TOEFL scores > 100 and German skills above level A2 of the European reference frame for languages). The translators were pre-sented with two equivalent versions of both passion scales (a German and an English version) and were asked to translate the scale into Portuguese. The first author then translated the scales back into German and discussed ambiguous
transla-Moeller et al.: Two sides of the same coin
138 tions with the translators in order to find the most equivalent Portuguese expression. The reliabilities of the dual model passion subscales were acceptable (see Table 2). Their va-lidity was indicated by the expected correlations to other measures of passion and commitment (see Moeller & Grassinger, 2014b).
To validate the findings, commitment was measured with the commitment subscale of the Sport Commitment Ques-tionnaire (SCQ; Scanlan et al., 2003), using the Portuguese version (Sousa et al., 2008), which according to our trans-lators did not require language changes for being applied in Brazil. The SCQ consists of six subscales, one for the as-sessment of sport commitment as such and five subscales for the assessment of predictors of sport commitment. Since we were not interested in the predictors, we only assessed the sport commitment subscale. This scale consists of six items all of which tap the commitment towards the relevant activ-ity, for example the Portuguese translation of the item “I am determined to play soccer in the next season”. The response scale ranges from 1 = not at all to 5 = very much. In order to assess the commitment towards the individuals’ favorite activities, the item wording was adapted to refer to activities in general (for Cronbach’s Alpha see table 2).
Measures of sample three
As before, passion was measured with the Dual Model Passion Scale (Vallerand et al. (2003) and with the com.pass scale. In contrast to the samples one and two, ten new items were added to the com.pass scale (for details regarding the new items, see Moeller & Grassinger, 2014b). The reliabil-ities of the dual model passion subscales were good for HP and OP (see Table 2). The subscales’ validity was indicated by the expected correlations between HP and OP to other measures of passion and commitment (see Moeller & Grassinger, 2014b).
As in sample two, sport commitment was assessed with the sport commitment scale. Since the latest publication of this scale was the Portuguese scale version from Sousa et al. (2008), we translated this version from Portuguese into Ger- man. The item wording was adapted to the activity ‘soccer‘.
Dispositional approach motivation was assessed with the BAS (behavioral activation system) subscale of the BIS/ BAS scale (Carver and White, 1994), using the German translation from Strobel et al. (2001). The response scale ranges from 1 = very true for me to 4 = very false for me, and was reversed to match the polarity of the other scales, with low scores reflecting low degrees in dispositional approach motivation. While the original English version of the BIS/ BAS distinguishes between three facets of BAS (reward, drive, and fun seeking), Strobel et al. (2001) found that a solution with a global BAS scale fitted their (German) data best. Therefore we report results for the global BAS score.
Dispositional affect in regard to soccer was assessed with the Positive Negative Affect Schedule (PANAS; German translation by Krohne et al., 1996), which taps positive
affect and negative affect each with ten items. The partici-pants were asked how they had felt when playing soccer during the previous year. The response scale ranged from 1 = not at all to 5 = very strongly.
Measures of sample four
Again, passion was measured with the Dual Model Pas-sion Scale and the com.pass scale (21 item verPas-sion). These two scales again were moderately to highly inter-correlated, which was interpreted as indicator of concurrent validity. The reliabilities of the dual model passion subscales were satisfying for HP and OP (see Table 2). Their validity was indicated for instance by the expected positive correlation of OP with symptoms of dependency (see Moeller et al., 2014). Behavioral approach motivation was assessed as in sam-ple three with the BAS subscale of the BIS/BAS scale (Strobel et al., 2001).
Feeling dependent of dance and martial arts was assessed with the 6-item Exercise Addiction Inventory (EAI, Terry et al., 2004). The scale was translated in a forth-and-back translation process by students of translation (5th semester) and by native English speakers. The response scale ranges from 1 = strongly disagree to 5 = strongly agree. The in-ternal consistency of this scale was acceptable (see Table 2).
Analyses
Research question 1: Do individuals who are
labelled “obsessive” according to the
z-score-based procedure display higher raw-
scores in OP than HP, and vice versa?
First, we applied the same procedure as Mageau et al. (2009); Philippe et al. (2009) and Vallerand and Houlfort (2003) to categorize the individuals of each sample into a non-passionate group, a ‘mainly harmonious’ group, and a ‘mainly obsessive’ group. For this purpose we first stand-ardized the variables HP and OP across all individuals within each sample. Then we used the scale midpoint of the general passion criteria scale to distinguish passionate viduals (mean score 4 or higher) from non-passionate indi-viduals (mean score below 4). 2 Finally, we classified the passionate individuals into ‘mainly harmonious’ (zHP > zOP) and ‘mainly obsessive’ (zOP > zHP), and examined whether there were individuals with similar levels of (standardized) HP and OP.
In a second step, we analyzed and compared the z-scores and raw scores on HP and OP of the groups created with the z-score-based grouping procedure. Third, we analyzed how many individuals were classified as ‘mainly obsessive’
2
This cut-off was used by Mageau et al. (2009) and Vallerand & Houlfort (2003), whereas Philippe et al. (2009) set the cut-off at a mean score of 5 on the same scale.
Journal for Person-Oriented Research, 2015, 1(3), 131-150
139 with the z-score-based classification procedure, despite higher raw scores on HP than OP.
Research question 2: Do alternative
classifica-tion procedures such as grouping based on raw
scores and cluster analysis also produce the
ex-pected groups of mainly harmonious and mainly
obsessive individuals?
Next, to examine how many individuals report higher HP than OP in their answers to the original response scale, we applied a similar classification procedure as described above, but used raw scores to classify individuals into a ‘mainly harmonious’ group (raw HP > raw OP), a ‘mainly obsessive’ group (raw OP > raw HP), and an equally har-monious and obsessive group (HP = OP). Then we com-pared how many individuals are classified as ‘mainly har-monious’ and ‘mainly obsessive’ with the z-score-based classification procedure versus the raw-score-based classi-fication procedure.
Then, in order to visualize the multivariate distribution of scores, we examined the scatter plots for the participants’ raw scores of HP and OP. Finally, to account for the size of distances between HP and OP, we examined subgroups in terms of each individual‘s profile of HP and OP by con-ducting cluster analyses. For this purpose we calculated in each of the four samples a two-step cluster analysis with SPSS (version 22). As indicators we used the scores of HP and OP3. This procedure suggests an optimal number of clusters based on Schwarz’ Bayesian Criterion (BIC), the ratio of change in BIC from one model to another, and the ratio of change in distance measures. The quality of this final solution is evaluated based on the silhouette measure of cohesion and separation. Since the indicators HP and OP were continuous variables, we had the choice between log likelihood and Euclidean distance measures. In this article, we report the results based on Euclidean distances. As sen-sitivity analysis, we checked whether the results and con-clusions remained the same with the use of (a) log likelihood distances in the two-step cluster analyses, and (b) Latent Profile Analyses (LPA). LPA were estimated using Mplus (version 7.1; Muthén & Muthén, 1998-2012), with log like-lihood distance measures, and the robust MLR estimator. In the LPA, HP and OP were allowed to correlate, with equal co-variances assumed across clusters. LPA Models with two and more clusters were estimated and compared in terms of
3
In the process of this cluster analysis, the indicators are z-standardized by default. We found that this leads to slightly different person-cluster assignments than conducting the cluster analysis with raw scores, because it makes a difference whether absolute or relative distances between observations are analyzed. While the conclusion remained the same in our data example, this is a different problem of z-standardization in person-oriented analyses, to be addressed in future studies.
AIC, BIC, entropy, Vuong-Lo-Mendell-Rubin Test, the Lo-Mendell-Rubin Adjusted LRT Test, and the bootstrap likelihood ratio difference test.
The clusters (resulting from the two-step cluster analysis with Euclidean distances) were interpreted based on their mean scores on the indicator variables HP and OP, and their mean scores in other validation criteria that are expected to be highly correlated with passion (commitment, the passion score of the com.pass scale, dispositional approach motiva-tion/BAS, positive and negative affect, and symptoms of dependency). Differences between clusters on the mean scores of these variables were tested with t-tests and effect size d (see Table 5).
Results
Descriptives for all measures are summarized in Table 2. The mean score of HP is higher than the mean score of OP in all four studies.
Research question 1: Do individuals who are
labeled “obsessive” according to the z-score-
based procedure display higher raw-scores in OP
than HP, and vice versa?
As the lower row of Figure 2 shows, the z-score based grouping procedure from Mageau et al. (2009); Philippe et al. (2009) and Vallerand and Houlfort (2003) created simi-lar groups as found in these previous studies. The non- passionate individuals displayed levels of HP and OP far below the sample averages. The ‘harmonious’ group was characterized by above-average levels of HP and below- average levels of OP, whereas the ‘obsessive’ group was characterized by above-average levels of OP and below- average levels of HP. There were no individuals with iden-tical levels of standardized HP and OP (see Table 4).
As the upper row of Figure 2 shows, we found that the group labels ‘mainly harmonious’ and mainly obsessive’ were misleading, because both the individuals in the ‘mainly harmonious’ group and the individuals in the ‘mainly obsessive’ group displayed higher HP mean raw scores than OP mean raw scores on the original response scale in sample one, three and four. In sample two, the ‘mainly obsessive group’ reported very similar levels of HP and OP (mean 5.1 for both HP and OP). In other words: The individuals which are called ‘mainly obsessive’ by the z-score-based procedure report on average higher HP than OP raw scores when answering to the original response scale.
Moeller et al.: Two sides of the same coin
140
Moeller et al.: Two sides of the same coin
141 Table 3
Percentages of misleadingly classified individuals
Sample 1 Sample 2 Sample 3 Sample 4 HPraw > OPraw, but labelled ‘obsessive’ with the z-score procedure 38.8% 21.6% 32.6% 40.2% OPraw > HPraw, but labelled ‘harmonious’ with the z-score procedure 0.0% 0.0% 0.0% 0.0% Note. The percentages refer to the whole sample.
Next, Table 3 shows how many individuals with higher raw scores on HP than OP were classified as ‘mainly ob-sessive’ with the z-score- based procedure, and how many individuals with higher raw scores on OP than HP were classified as ‘mainly harmonious’ based on their z scores. Between 22% and 40% of all individuals were classified as ‘mainly obsessive’ with the z-score procedure despite of having reported higher HP than OP on the original response scale. The opposite misclassification of being classified as harmonious despite of stronger OP raw scores did not occur in any sample.
Research question 2: Do alternative
classifica-tion procedures such as grouping based on raw
scores and cluster analysis also produce the
ex-pected groups of mainly harmonious and mainly
obsessive individuals?
Table 4 compares how many individuals are classified as non-passionate, harmonious, obsessive, and equally har-monious-obsessive with the z-score- based procedure versus the raw-score-based classification. While the z-score-based procedure suggest that each sample consisted of roughly as many harmonious as obsessive individuals (group sizes of 44.7% to 53.9%), the raw score based comparisons of HP and OP show that the vast majority of individuals (67.8% to 93.2%) reported higher HP than OP when answering to the original response scale.
In contrast to what we would expect based on the previ-ous literature and based on the results of the above men-tioned grouping procedures, the scatter plots indicated that it might not be too insightful to distinguish between differ-ent groups of individuals in terms of HP and OP, as both variables continually scattered around the regression line (see Figure 3). In most cases, HP and OP were either both low, or both moderate, or both high. HP generally tended to be higher than OP, in reference to the original response scale. Importantly, there were very few observations with low HP and high OP, as the empty right lower corners of the scatter plots indicate.
The two-step cluster analyses with Euclidean distances confirmed what the scatter plots had already indicated:
There were either no distinguishable groups (in samples 1 and 3), or two groups with one representing high passion, and the other representing low passion (in samples 2 and 4). Where a two-cluster-solution was found, the HP and OP levels within each cluster were aligned, meaning HP and OP were both relatively high in the ‘high passion cluster’, and both relatively low in the ‘low passion cluster’. RawHP was higher than rawOP in each cluster. Discrepancy clus-ters with higher OP than HP were not found in any sample. The cluster solution was evaluated to be on the lower mar-gin of “good”, according to the silhouette measure of cohe-sion and separation (average silhouette = .5). That individ-uals display aligned scores of either high HP and OP, or moderate HP and OP, or low HP and OP was also supported in our sensitivity analyses of two-step cluster analysis with log likelihood distances (SPSS), and latent profile analyses (using log likelihood and the robust MLR estimator, and accounting for correlations between HP and OP, in Mplus). These alternative clustering procedures indicated again that there were no clearly pronounced profiles, but alignment of HP and OP scores, which suggests that the distinction be-tween profiles was not more insightful than the concept of passion as a continuous phenomenon (for details see the appendix).
In the samples with a two-cluster solution, the two clus-ters differed in the general level of passion (generally high HP and OP versus generally low HP and OP), and these differences between clusters were significant and large ac-cording to the t-tests and effect sizes (see Table 5).
To validate the interpretation of these clusters, we exam-ined how the clusters identified with the two-step cluster analyses in samples 2 and 4 differed in other constructs known to be related to passion, namely commitment, dis-positional approach motivation, positive and negative affect and dependency. As expected, we found that the high pas-sion cluster was characterized by high levels of paspas-sion, commitment, and dispositional approach motivation, while these constructs were significantly lower in the low passion cluster, the effect sizes were mostly large (see Table 5). The difference in regard to feeling dependent of the activity was not significant (sample 4).
Moeller et al.: Two sides of the same coin
142 Table 4
Percentages of non-passionate, harmonious (HP > OP), obsessive (OP > HP) and equally harmonious and obsessive (HP = OP) indi-viduals: comparing the z-score-based classification with the raw score-based classification.
Sample 1 Sample 2 Sample 3 Sample 4
z-score Raw score
z-score Raw score
z-score Raw score z-score Raw score
Nonpassionate 1.5% 1.5% 5.9% 5.9% 2.7% 2.7% 3.7% 3.7%
HP > OP 53.9% 93.2% 46.2% 67.8% 44.7% 77.3% 49.2% 89.3%
OP > HP 44.7% 5.3% 48.0% 20.1% 52.7% 9.5% 47.1% 5.3%
HP = OP 0% 0% 0% 6.2% 0% 10.6% 0% 1.6%
Journal for Person-Oriented Research, 2015, 1(3), 131-150
143 Table 5
Comparing the high and low passion cluster in samples 2 and 4 (two-step cluster analyses, Euclidean distances)
High Passion Cluster Low Passion Cluster
t-tests of differences between
the high and low passion cluster Sample 2 N = 228 Sample 4 N = 233 Sample 2 N = 45 Sample 4 N = 11 Sample 2 Sample 4 M SD M SD M SD M SD p d p d Indicator HP a 5.61 0.674 5.46 0.694 3.66 0.709 3.16 0.799 .000 2.13 .000 1.37 Indicator OP a 4.72 1.358 3.85 1.267 2.85 0.980 2.49 1.135 .000 2.42 .001 0.45 General Passion criteria a 5.92 0.788 6.12 0.759 4.84 0.930 3.60 1.956 .000 0.99 .002 2.67 Passionb 4.78 0.663 4.53 0.642 3.88 0.685 3.62 0.586 .000 1.01 .000 0.53 Commitment 4.35 0.533 3.69 0.592 .000 0.90 Dispositional ap-proach motivation 3.11 0.369 2.77 0.394 .011 0.35 Dependency 3.16 0.758 2.74 0.816 .154 0.20
Note. This table reports differences between the two clusters which were found in the studies 2 and 4. In studies 1 and 3, no clusters were found. The t-tests require replication, due to the small sample size of the second cluster, particularly in study 4. a = Dual Model Passion Scale (Vallerand et al., 2003), b=com.pass scale (Moeller & Grassinger, 2014b).
Discussion
This study had two purposes: First, we investigated whether the two ‘types of passion’ describe distinct sub-groups of individuals, or rather two aspects that, while ex-plaining different outcomes, are experienced together by an individual. Second, we discussed why and when z-standardi- zation might be misleading in the analysis of subgroups.
We examined the z-score-based grouping procedure that was used to distinguish mainly harmonious from mainly obsessive individuals in previous studies (Mageau et al., 2009; Philippe et al., 2009; Vallerand & Houlfort, 2003). With this procedure we found similar groups as in previous studies. However, we found that the interpretation of these groups was misleading, because many individuals were classified as ‘obsessive’ despite higher HP than OP in their original answers, which was due to the different mean scores of HP and OP. On average, the individuals of each sample reported much higher HP than OP. Z-standardi- zation conceals these mean level differences, because the standardized mean score is always 0. The groups created with the z-score-based procedure do not reflect the indi-vidual’s response reference frame for ‘high’ versus ‘low’ passion, but the individual’s rank in reference to other indi-viduals in the same sample. This implies that an individual with a high OP z-score might have experienced higher OP than other individuals, but probably still lower OP than HP.
We then applied alternative classification procedures to identify groups of individuals, namely the classification into a harmonious and an obsessive group based of raw scores of HP and OP, and cluster analyses. These analyses and the scatter plots revealed that (1) HP and OP are aligned for most individuals, meaning either both relatively high, or both relatively low, (2) most individuals report higher levels
of HP than OP in terms of the original response scale, and (3) prototypical obsessive individuals with stronger OP than HP were rare in the raw-score-based grouping procedure, and not visible in the cluster analyses. These results were replicated in all four samples, despite the fact that the par-ticipants differed between the samples in regard to their passionate activity context, home country, and age.
We conclude that, in samples like ours of individuals who pursue activities on amateur level, the only useful dis-tinction of subgroups is the disdis-tinction between generally highly passionate individuals, and generally lowly passion-ate individuals. It seems more appropripassion-ate to conceptualize passion as a continuous variable, with beneficial and harmful aspects that occur together. In sum, our findings suggest that passion is a double-edged sword. Individuals who report strong passion seem to experience at the same time harmonious and obsessive aspects, positive and nega-tive affect, and voluntary commitment (see Tables 5 and 6). While the difference in dependency between the high and the low passion cluster was not significant in this study, this finding requires replication due to the small size of the second cluster in sample 4. Although obsessive experiences seem rare and not intense in individuals with low passion, they are more strongly pronounced in individuals with a strong passion. Nevertheless, the harmonious experiences prevail over the obsessive even for individuals with strong passions. The often assumed prototypical obsessed indi-viduals with high OP and low HP (e.g. Vallerand et al., 2003; 2012) were not found.
Harmonious and obsessive experiences as two
sides of the same coin
The dual model emphasizes the duality between HP and OP, while we found that most individuals experience either
Moeller et al.: Two sides of the same coin
144 high HP and high OP, or low HP and low OP. At first glance, the co-occurrence of HP and OP seems an oxymo-ron, as HP describes opposite experiences to OP (HP: main- tained control, positive emotions, well-being; versus OP: loss of control, negative emotions, ill-being). However, HP and OP are correlated with each other, with effect sizes rang- ing from small (Marsh et al., 2013) to moderate (Rip et al., 2006; Vallerand et al., 2007) to high (Séguin-Lévesque et al., 2003; Vallerand et al., 2003; Vallerand, Ntoumanis, et al., 2008, study 1). This indicates that HP and OP co-occur for at least some individuals in many previous studies. To understand that, it helps to reflect on the fact that the ratings of passion are based on the individual’s repeated experi-ences of an activity over time. Some individuals might ex-perience alternatingly intrinsic and aversive states while engaging in their passionate activity. Likewise, individuals might experience autonomous and constraint reasons to identify with an activity together or alternatingly, so that the autonomous reasons might then lead to harmonious expe-riences, and the controlled reasons to obsessive expeexpe-riences, within the same individual. Also, reasons to engage in an activity might develop and change over time, so that har-monious passions might become more obsessive or vice versa over time.
An important implication is that our findings do not support that a high level of HP was a generally desirable experience, as it often comes accompanied by high levels of OP. As Wang and Yang (2007, p. 297) put it: “high OP exists only when high HP occurs. This means that HP is a requirement of OP and HP and OP can be denoted as a se-quence of different degrees of passion.” It would be inter-esting to shed more light on the differences between highly and lowly passionate individuals, as these were rarely stud-ied before. The scatter plots (see Figure 3) and the fact that HP and OP are aligned within clusters indicate that it might not be very insightful at all to distinguish between separate subgroups of individuals in terms of HP and OP.
Our findings indicate that it can be misleading to claim that individuals with high OP were at risk, while individuals with high HP were well adapted, since HP is often at least as high, often higher, than the OP in any given person. Inter-estingly, there is a ‘positive bias’ in all measures of passion: Most individuals affirm the items for HP much stronger than the items for OP (see Mageau et al., 2009; and above). Furthermore, OP was found to correlate with positive affect and other positive experiences (e.g., Moeller et al., 2014). Moreover, the presumably neutral scale of general passion criteria of the dual model passion scale correlates moder-ately to strongly with positive affect (Moeller et al., 2014). In sum, these findings suggest that passion is generally a predominantly positive experience, despite the obsessed feelings that often accompany a strong passion, and disre-garding the different correlates of OP and HP.
Nevertheless, our findings corroborate the assumption that high motivation can have downsides, such as obsessive, risky and ill-advised persistence, and the risk of exhaustion.
Similar downsides of high motivation were described in recent studies on the relation of student engagement to stu-dent burnout, which showed that for a substantial subgroup of individuals, strong engagement comes accompanied by strong exhaustion and burnout symptoms (Tuominen-Soini & Salmela-Aro, 2014; Salmela-Aro et al., 2015), despite the fact that engagement has been described as optimal motivation and ‘flourishing’ experience in the previous research (e.g. Reschly, Huebner, Appleton, & Antaramian, 2008). The dual model of passion has helped us to perceive this “dark side of motivation”, and future studies should consider the up- and downsides of motivational constructs in more detail.
It might be the context that makes the difference: Envi-ronments where individuals face much pressure and con-straints, such as highly competitive sports, might produce or attract more mainly obsessive individuals than leisure sport teams where people drop out if they feel that their hobby interferes with their autonomy and well-being (Amiot, Vallerand & Blanchard, 2006). Possibly, highly competitive Olympic athletes might experience more obsession than harmonious passion in critical periods of intensive training. Future studies could shed light on the relation between contextual characteristics and the development of passion profiles. In any case, there are domains and samples where the assumed universal duality of passion in terms of pro-nounced profiles was not supported. Moreover, a recent study on young elite soccer players on the edge of entering the professional level found that even in such highly com-petitive situations, HP tends to be substantially higher than OP, across all individuals (Chamorro, Torregrosa, Sánchez-Oliva, León, & García Calvo, 2015).
Implications for the research on group
differ-ences
One implication of our study is that z-scores can be mis-leading in the analyses of profiles and groups. Z-standardi- zation is often applied to compare the level of individual responses in different variables. While this is unproblematic in cross-sectional inter-individual correlation analyses, it becomes problematic for instance when variables with dif-ferent distributions are first standardized, and then these standardized scores are used for the interpretation of dif-ferent profiles. A graph of profiles should show the infor-mation about (1) the absolute item expression: which group affirmed or rejected which variable on average (which var-iable mean score was above/below the scale midpoint on a likert rating scale); (2) the relative item expression: which variable score was higher in which profile/group, and how large were these profile differences; and (3) whether the same profiles were found in different samples. Z-scores obfuscate all of these pieces of information that usually are read from a graph of profiles because of the following rea-sons: