November 2006
The Support Organization: A Strategic
and Value Adding Force
- A Study of Maintenance of Rail Transit Vehicles
Håkan Borgström
Department of Industrial Management and Logistics
Division of Production Management
Lund Institute of Technology
Lund University
Supervisors:
Professor Hans Ahlmann, Lund Institute of Technology
Pär Sandin, Systecon AB
Preface
This master's thesis aims to provide a holistic approach to maintenance management. The maintenance organization has such great influence on the company's ability to achieve its corporate mission, and must therefore have a central strategic role in the company. The ambition is to relate the most widely used maintenance theories to the mission statement, the market, and the value drivers of the organization. The theories are not explained in full detail, so the readers are encouraged to further explore areas that are of particular interest.
A large part of the study was carried out during the hot Swedish summer of 2006 at Systecon's office in downtown Malmö. I want to thank all the colleagues at Systecon for their support and pleasant company, and special thanks to Pär Sandin for initiating this interesting master's project and for taking on the role as my company supervisor.
Finally, my greatest thanks to my supervisor and mentor Professor Hans Ahlmann who has always been available for feedback and challenging discussions, even during the finest summer days at his summer residence at Sladö in the Västervik archipelago. Hans has been a pioneer in market and profit driven maintenance management, and he is the founder of the widely spread Life Cycle Profit (LCP) concept. Hans’ vast knowledge within the field of maintenance management and his large repertory of funny stories from a long and prominent career has made it a true joy to write this thesis.
I hope you will enjoy reading this thesis as much as I enjoyed researching and writing it, and that it will raise many new thoughts on maintenance management.
Håkan Borgström November 2006
Abstract
Title: The Support Organization: A Strategic and Value Adding Force - A Study of Maintenance of Rail Transit Vehicles
Author: Håkan Borgström
Supervisors: Professor Hans Ahlmann, Department of Industrial Management and Logistics, Lund Institute of Technology
Pär Sandin, Systecon AB
Background: Systecon is a leading European consultancy and software company within system logistics, system reliability, maintenance and Life Cycle Cost (LCC) analysis. Historically the military and military suppliers have accounted for the majority of the commissions, but over time other industries have realized that effective maintenance and logistic support can greatly enhance the overall effectiveness of a system and at the same time lower the costs. Hence, more and more companies outside the military are requesting Systecon’s expertise and software tools. One of the industries that consult Systecon on support issues is the railway sector. Although the basic support theories are general, every industry has special prerequisites and requirements. Systecon initiated this master’s project to analyze and identify improvements to the company’s current practices for developing support strategies for public transport companies.
Purpose: The purpose of this master’s thesis is to thoroughly analyze the support situation for rail transit vehicles. This includes a description of a typical public transport case and Systecon’s engagement. The analyses should result in the development of a structured approach that improves and extends Systecon’s current practice. The thesis also describes how Systecon’s software should be integrated with the suggested approach.
Methodology: The study is based on a typical public transport case. The case is developed from public transport cases that Systecon is engaged in, but it is not referring to a specific real-life case. Simulation studies are performed in order to gain understanding of complex interrelationships and to study the consequence of various proposed solutions. The result is presented in a framework that systematically describes the concepts required to achieve a
The Support Organization: A Strategic and Value Adding Force
strategic and value driven support organization. The framework embraces concepts from many different theories, where each theory contributes with a different perspective. The ambition is to create a general framework, since it should apply to any type of public transport system.
Conclusions: The public transport case described in this thesis shows that the maintenance function has a large impact on the public transport company’s profitability and ability to achieve its corporate mission. This means that the maintenance function has a crucial strategic role in the organization, which calls for a market and value driven management. Hence the traditional cost focused approach based on LCC and logistic support concepts is not sufficient when designing the support organization for a public transport system. This approach must be extended to embrace the support organization’s full potential as a strategic and value adding force. This thesis presents a framework for developing a strategic and value driven support organization. The framework relies on established maintenance management theories such as Life Cycle Profit (LCP) and Value Driven Maintenance (VDM). In addition to this the framework also takes inspiration from production management theories, which provides a strong strategic focus. Systecon’s software suite has proven to have most of the necessary functionalities required to facilitate the development of a strategic and value driven support organization. However, what must be improved is the integrated use of the tools.
Keywords: LCC, LCP, life cycle cost, life cycle profit, maintenance management, maintenance strategy, public transport, railway maintenance, value driven maintenance, VDM.
Abbreviations
ADL : Administrative Delay Time ATC : Automatic Train Control
BSC : Balanced Scorecard
CBM : Condition Based Maintenance CBS : Cost Breakdown Structure CM : Corrective Maintenance
CMMS : Computerized Maintenance Management System CSI : Customer Satisfaction Index
EBSOM : European Benchmark Study On Maintenance FBS : Function Breakdown Structure
FMECA : Failure Mode Effectiveness and Criticality Analysis ILS : Integrated Logistic Support
KPI : Key Performance Indicator KPP : Key Performance Parameter LBS : Location Breakdown Structure LAC : Life Acquisition Cost
LCC : Life Cycle Cost LCL : Life Cycle Loss LCP : Life Cycle Profit LCR : Life Cycle Revenue LDC : Life Disposal Cost LOC : Life Operational Cost LORA : Level Of Repair Analysis LSC : Life Support Cost
MDT : Mean Downtime
MDBF : Mean Distance Between Failure MDTF : Mean Distance To Failure MLDT : Mean Logistics Down Time
The Support Organization: A Strategic and Value Adding Force MTBF : Mean Time Between Failure
MTBM : Mean Time Between Maintenance MTTF : Mean Time To Failure
MTTR : Mean Time To Repair MWT : Mean Waiting Time OMAX : Objectives Matrix PDSA : Plan Do Study Act PM : Preventive Maintenance
RAM : Reliability, Availability, Maintainability RBS : Revenue Breakdown Structure
RCM : Reliability Centered Maintenance SHE : Safety, Health and Environment TPM : Total Productive Maintenance VDM : Value Driven Maintenance
Contents
1 Introduction ... 13 1.1 Background... 13 1.2 Purpose ... 13 1.3 Delimitations ... 14 2 About Systecon... 15 2.1 The Company ... 152.2 The ILS Toolbox ... 15
2.2.1 Opus10... 15 2.2.2 Simlox... 15 2.2.3 Catloc... 16 2.2.4 Madcat ... 16 3 Methodology... 17 3.1 Research Classification... 17 3.1.1 Explorative Research ... 17 3.1.2 Explanatory Research ... 17 3.1.3 Normative Research... 17 3.2 Research Methodology ... 17 3.2.1 Qualitative Method ... 17 3.2.2 Quantitative Method ... 17 3.2.3 Preparatory Study ... 17 3.2.4 Survey Study... 18 3.2.5 Case Study ... 18 3.2.6 Experimental Study... 18 3.3 Research Quality... 18 3.3.1 Reliability ... 18 3.3.2 Validity ... 19 3.4 Proposed Methodology... 19 3.4.1 Literature Review ... 19 3.4.2 Interview ... 19 3.4.3 Data Collection ... 19 3.4.4 Case Description ... 20 3.4.5 Simulation Study ... 20 3.4.6 Framework Design... 20 4 Theory... 21
4.1 The Life Cycle Concept... 21
4.1.1 Life Cycle Cost ... 21
4.1.2 Life Cycle Profit ... 22
4.1.3 Cost/Revenue Breakdown Structure ... 23
4.1.4 When to Use LCC and LCP? ... 24
4.2 Value Driven Maintenance ... 25
4.3 Maintenance Context ... 26
4.3.1 Availability ... 27
The Support Organization: A Strategic and Value Adding Force 4.3.3 Maintainability... 28 4.3.4 Supportability ... 28 4.3.5 Corrective Maintenance ... 28 4.3.6 Preventive Maintenance... 29 4.3.7 Balanced Maintenance... 29
4.3.8 Integrated Logistic Support ... 29
5 The Public Transport Case and Systecon’s Engagement ... 31
5.1 Background... 31
5.2 The Scope of Systecon's Engagement ... 31
5.3 Review of Maintenance Related Agreements... 32
5.4 Preparation of Maintenance Data ... 33
5.5 Definition of Maintenance Concept... 36
5.6 Development and Implementation of Maintenance Plan ... 37
5.7 RAM Verification... 38
6 Linking Strategic and Value Driven Theories to the Public Transport Case ... 39
6.1 Public Transport Maintenance from a Manufacturing Strategy Perspective ... 39
6.2 Life Cycle Cost/Revenue Elements in the Public Transport System ... 41
6.3 The Commuter Vehicles’ Life Cycle Phases ... 42
7 Framework for Developing a Strategic and Value Driven Support Organization ... 43
7.1 Mission Statement ... 46
7.2 Understand the Market Place... 46
7.3 Identify Value Drivers ... 47
7.4 Define Maintenance Strategy... 49
7.5 Increased Reliability through Robustness... 50
7.6 Adaptable Solutions... 51
7.7 Risk Analysis... 52
7.8 Trade-off Analysis ... 53
7.9 Focused Maintenance ... 54
7.10 Maintenance Outsourcing ... 56
7.11 Optimize Resources to Maximize Profit... 59
7.12 Strategic and Profit Driven Incentive Program... 61
7.13 Continuous Improvements... 64
8 Implementing Strategic and Value Driven Concepts in the ILS Toolbox ... 65
8.1 Systematic Integration of the ILS Tools ... 65
8.2 Bal: Preventive Maintenance Analysis and Packaging... 67
8.3 Opus10: Calculate Optimal Stock Levels and Corrective Maintenance Cost... 68
8.4 Simlox: Simulate Operational Availability and Resource Utilization ... 70
8.5 Catloc: Compile the LCP Model and Identify Value Drivers... 71
8.6 Madcat: Follow-up Analysis and Verification... 75
8.7 Summary of Suggested Improvements ... 76
9 Findings and Recommendations ... 77
9.1 Findings ... 77
9.2 Recommendations ... 78
9.3 For Future Research... 79
References... 81 Appendix I – SINTEF Cost Breakdown Structure ... I
Appendix II – The 10 KPIs Used in the VDM Control Panel ... III Appendix III – Simulation with Simlox ...V Appendix IV – Simulation with Simul8... IX
1 Introduction
1.1 Background
Systecon is a leading European consultancy and software company within system logistics, system reliability, maintenance and Life Cycle Cost (LCC) analysis.
The software development at Systecon started about 30 years ago with a spares optimization tool. Today the company offers a complete suite of software tools including:
• Opus10 (spares optimization) • Simlox (simulation)
• Catloc (LCC analysis)
• Madcat (maintenance data categorization and analysis)
Historically the military and military suppliers have accounted for the majority of the commissions, but over time other industries have realized that effective maintenance and logistic support can greatly enhance the overall effectiveness of a system and at the same time lower the costs. Hence, more and more companies outside the military are requesting Systecon’s expertise and software tools.
One of the industries that consult Systecon on support issues is the railway sector. Although the basic support theories are general, every industry has special prerequisites and requirements. Systecon initiated this master’s project to:
• analyze the support situation for rail transit vehicles
• present a solution for how the development of a maintenance organization should be performed
• evaluate and describe how Systecon’s software suite should be integrated as a decision support tool in this process, and identify necessary improvements to the software
1.2 Purpose
The objective is to thoroughly analyze the support situation for rail transit vehicles. This includes a description of a typical public transport case and Systecon’s engagement. The analysis will rely on a combination of conventional maintenance theories and production management theories. Production management thinking implies a different perspective to the project, which hopefully will extend and challenge the traditional approach.
The result is presented as a framework of concepts that facilitate a successful development of a strategic and profit driven support solution for public transport systems. These concepts should identify areas where Systecon can improve and extend the current practice.
The thesis also describes how the concepts presented in the framework should be integrated with Systecon’s ILS toolbox. This includes a detailed evaluation of Systecon’s simulation tool Simlox. An evaluation of Systecon’s other software tools is also part of the study, but the focus is on Simlox, since it is a relatively new and versatile tool that has a large potential for
The Support Organization: A Strategic and Value Adding Force
improvements. Simlox is also the software that is most frequently used by Systecon in the train maintenance case.
1.3 Delimitations
The thesis is limited to the support analysis that follows after the design process is completed. Hence, all maintenance data specified by the manufacturer is considered as fixed input to the analysis. From a Life Cycle Profit (LCP) point of view the design process is the phase in a system’s life cycle where improvements will have the largest impact on the total cost of the system over its lifetime (e.g. robust design, design for maintainability etc.). The reason this important process is disregarded in this project is that this phase has typically already been completed in the type of case that the thesis is intended to analyze.
The evaluation of Systecon’s software tools is limited to the functionality of the tools (i.e. what they can achieve), and other aspects will not be considered.
2 About
Systecon
2.1 The
Company
Systecon is an independent, employee-owned consultant firm that offers services in Integrated Logistic Support (ILS). The company helps clients to increase reliability, achieve more efficient resource utilization, and take control of the support costs of large complex systems.
For almost four decades, Systecon has been working with ILS projects within both the military and the civil sector. Among the clients are: Boeing, Bombardier, British Aerospace, Ericsson, FMV, Lockheed-Martin, SAAB, SAS, SL, SPP, Statoil, Tetra Pak, Vattenfall and Volvo Cars. Besides Sweden (Stockholm, Gothenburg, Malmö), Systecon is also present in the UK market through the partly owned subsidiary, Systecon UK. The international network also includes partners in, among other countries, Norway, Germany, Italy, Greece, Turkey, USA, Australia, Singapore, China, South Korea, Taiwan and South Africa.
2.2 The ILS Toolbox
2.2.1 Opus10
The first version of Opus was released in the 1970s, and today’s version is the result of 30 years of continuous development. The software offers state-of-the-art optimization methods that solve complex support scenarios. With Opus10 it is possible to perform spare part optimization on scenarios with unlimited sites and systems including both repairable and discardable items. Some of the main features in Opus10 are:
• Full system breakdown capability without indenture level constraints • Full commonality capability for systems and items
• Full logistics support modeling capability without echelon constraints • LSC optimization of repairable, partly reparable and discardable items • LORA – Level of Repair (and Resources) Analysis
Results from Opus10 are presented as the optimal KPI value per invested capital. This is illustrated in a cost/effectiveness diagram where the effectiveness KPI is plotted against the Life Support Cost (LSC).
2.2.2 Simlox
Opus10 is limited to analyze spares optimization problems. Simlox is a simulation tool that complements Opus10 with detailed analysis of other resources in the support organization, for example, personnel and tools. The software is using a stochastic simulation approach (based on Monte Carlo technique). Simlox offers:
• Possibility to include operational profiles in the model • Extended flexibility in the analysis of resources
The Support Organization: A Strategic and Value Adding Force • Time dependent results
With these features Simlox can be used to extend and verify the Opus10 model. Results from Simlox are typically presented in graphs showing the state of a system or a resource over time. Other valuable information obtained from Simlox is graphs showing the reasons for unavailability over time. These results should give a good indication of how the system will perform in a real-life situation.
2.2.3 Catloc
Most computer LCC models today are created in some spreadsheet software. A spreadsheet software could with success be used to calculate the total LCC and perform some basic analysis of the cost distribution. However more complex scenarios could be difficult to model, analyze and maintain with this type of software. Catloc is a specialized LCC tool that allows for detailed cost distribution analysis of LCC models. In Catloc, cost atoms are linked to a set of domains (material, station, task, resource, and time). The general idea is that once the model is created it is possible to obtain detailed information on, for example, the cost of material distributed over time, or the cost of resources per station etc. Catloc is designed to:
• Handle any type of LCC model • Produce different cost breakdowns • Perform sensitivity analysis
In addition to finding the total LCC, Catloc is also used to identify cost drivers and perform sensitivity analyses in order to analyze what-if scenarios, and thus understand how robust the system is.
2.2.4 Madcat
Madcat (Maintenance Data Categorization and Analysis Tool) is a software tool designed for the analysis of reliability development over time. The software uses system structures and defined cost elements to categorize and analyze experience data regarding flow of cost and events, cost profiles, trends and prognoses. Madcat can also be used for warranty evaluation, component life-length analysis and optimization of maintenance intervals. Key features in Madcat are:
• Multi-dimensional categorization • Trend analysis
• Reliability data estimation • Consequence analysis
• Maintenance optimization support • Verification functions
3 Methodology
3.1 Research
Classification
3.1.1 Explorative Research
The purpose of an explorative research is to obtain fundamental knowledge and understanding of the field of study. This method is valuable in the early stages of the research process when the insight in the problem is vague. The explorative research aims to form a clear picture of the problem and how the succeeding analysis should be carried out(20).
3.1.2 Explanatory Research
The explanatory research intends to clarify cause-effect interrelationships. This method focuses on variables that are central to the analysis. The interrelationships could be simple or complex, and are usually explained through logic reasoning based on established theories and declarative knowledge(20).
3.1.3 Normative Research
The target of normative research is to predict how proposed concepts and changes will influence the system and the organization. The central cause-effect interrelationships identified in the explanatory research are fundamental input to this analysis(20).
3.2 Research
Methodology
3.2.1 Qualitative Method
Qualitative investigations concern the gathering and analysis of data that cannot be quantified in a meaningful way (i.e. numerically). These studies are usually not structured beforehand, and therefore call for an explorative approach(20).
3.2.2 Quantitative Method
Quantitative studies regard the gathering and analysis of data that can be expressed numerically. In a quantitative study there are many possible arrangements for how the investigation is carried out and how the data is being expressed(20).
3.2.3 Preparatory Study
Most research projects begin with a preparatory study, which aims to develop a deeper understanding of the problem. This includes reviewing literature and analyzing available data and previous research projects within the same field. The preparatory study is a great way of learning more about the research field and it often generates many ideas for the proceeding
The Support Organization: A Strategic and Value Adding Force
analysis. An elaborate problem description could provide much of the information that is necessary for the analysis, and thus reduce the need for additional data gathering(20).
3.2.4 Survey Study
The survey study is used to obtain information about a larger population. The survey is given to a sample population that is selected to represent the population the study is targeting. The conclusions that can be drawn from a survey study depend on the size of the sample population, how the sample population was selected, and the response rate. The survey usually compares things against each other, and the results are of statistical nature and are presented in tables and graphs(20).
3.2.5 Case Study
A case study is a thorough and detailed analysis of one specific case. The focus allows the analyzer to gain deeper insight in areas that are of specific interest. The approach also makes it possible to discover conditions that were not known beforehand. The selection of a case is based on some predefined criteria, which could be, for example, a typical case or an extreme case(20).
3.2.6 Experimental Study
The experimental study gives information about the behavior of a process or customer group etc. The experiment is carried out either as a field study or in a laboratory. The technique provides experimental data that can be used for further analysis. A special type of experimental study is simulation, where the experiment is performed on a computer model of the real-life scenario. In a simulation study, the modeling process requires a thorough understanding of the situation that is being analyzed(20).
3.3 Research
Quality
3.3.1 Reliability
Reliability regards the accuracy of the information that is used in the research study. This concerns all the methods and measuring tools that are used for collecting the data, as well as how the data is handled by the researcher. Every research study should strive for the highest possible reliability. When gathering subjective information through questionnaires or interviews, the outcome is highly dependent on how the questions are formulated. The quality of objective quantifiable data mainly depends on the reliability of the measuring process. Statistical methods must be used when it is too expensive and time consuming to collect data about every single entity of a large selection. In this case the choice of statistical method is important for the reliability of the study(15).
3.3.2 Validity
Validity regards whether the information that is used in the research study actually measures what it is intended to measure. This means that even if the information is accurate it may still be useless if it does not measure the right things. Hence high reliability and high validity must both be satisfied in order to guarantee high research quality. To achieve high validity it is important to carefully investigate and clearly specify, in the problem formulation, the type of information required for the research and how it should be obtained(15).
3.4 Proposed
Methodology
3.4.1 Literature Review
Established life cycle cost, logistic support, and production management theories will constitute the foundation for the framework design. The initial phase of this thesis is dedicated to a desk
study review of the current literature within the above mentioned fields, as well as related
master’s thesis and disputations. The aim is to understand how the different fields are interrelated and to distinguish the theories that best apply to the train maintenance scenario. Throughout the project it may be necessary to conduct further literature reviews to follow-up on topics identified in the interviews, or other issues that arise.
3.4.2 Interview
Qualitative data is collected from interviews and meetings with involved parties. A first round
of interviews will be conducted during the early stages of the project to gain a deeper knowledge of the specific requirements for train maintenance. This involves internal interviews with consultants at Systecon, as well as attending external meetings with maintenance suppliers and traffic owners.
A second round of internal interviews is planned later in the project during the analysis of Systecon’s current approach to the train maintenance problem. The interviews will be conducted as open discussions rather than following a strict set of questions.
3.4.3 Data Collection
Quantitative data is collected from various sources. All maintenance related data such as failure
rates and preventive maintenance (PM) intervals is provided by the train manufacturer. Primary cost data such as cost of spares and man-hour cost is collected from the companies that are associated with the specific costs (e.g. the maintenance supplier, the manufacturer, and the traffic owner). Estimates based on expert opinion and secondary data is used if primary data is not available. All data gathered for the study will be used to describe a typical real-life case, but it will not refer to a specific real-life case.
The Support Organization: A Strategic and Value Adding Force
3.4.4 Case Description
The case description is developed from a mix of qualitative and quantitative data. The case opens up for detailed explorative study, where processes that have large potential for improvements are identified. These processes are then subject to further research that will eventually result in the framework design.
3.4.5 Simulation Study
Some concepts will be evaluated from simulation studies. Simulation is a special type of
experimental study, where a computer model is created to reflect the real situation. This
experimental approach is often the only possible way to gain understanding of complex interrelationships and to study the consequence of various proposed solutions.
3.4.6 Framework Design
The framework systematically describes the concepts required to achieve a strategic and value driven support organization. It is important that the concepts are general, since they should apply to any type of public transport system. The concepts are developed from explanatory and
normative reasoning.
Established theories along with the collected maintenance data and the information gathered from the interviews will constitute the key input for the analysis. The framework will embrace concepts from many different theories, where each theory contributes with a different perspective. Manufacturing Strategy S tr a te g ic p e rs p e c tiv e 20
Figure 3-1: Theories making up the framework.
Value Driven Maintenance Life Cycle Profit Value perspective Value perspective C o st aw ar e ness per specti v e Framework
Life Cycle Cost and Maintenance Management Theories
4 Theory
4.1 The Life Cycle Concept
The idea of the life cycle concept is that any long-term decision should be made with a whole life perspective. This means that the decision maker cannot make long-term decisions solely based on the current situation, but must also consider the future implication of the decision. The life cycle concept is traditionally used in the acquisition of complex and expensive systems. However the whole life perspective applies to a wider field of application, for example the development of a maintenance organization.
4.1.1 Life Cycle Cost
The objective of the LCC analysis is to not only look at the acquisition cost of a system, but take into consideration the total cost of ownership of a system throughout its lifetime. The LCC theory was developed by the US military already in the late 1960s, and can be seen as the first investment theory that emphasizes the importance of a whole life perspective(19).
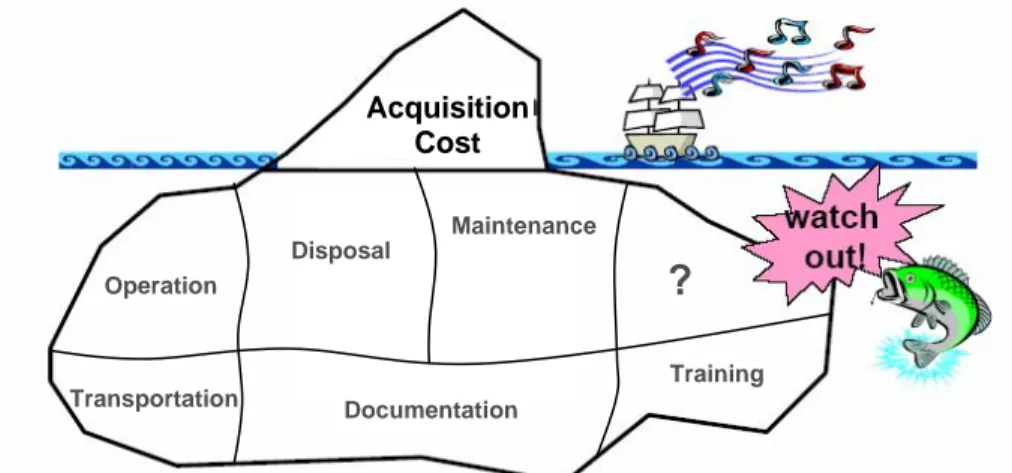
The acquisition of a complex system will of course entail large ownership costs. The LCC concept illustrates this with a ship approaching an iceberg, where the tip of the iceberg corresponds to the visible acquisition cost, while the large cost of ownership is invisible beneath the water surface. The cost of ownership typically involves:
• research and development costs
• operational costs - energy consumption, operators etc. • training of personnel
• maintenance costs – spare parts, maintenance personnel, facilities and equipment etc. • documentation of systems and processes
21
Figure 4-1: Iceberg illustrating the LCC concept (developed from Kawauchi et al, 1999).
Operation Documentation Training
?
Acquisition Cost Maintenance Disposal TransportationThe Support Organization: A Strategic and Value Adding Force
The general LCC formula is written as: LCC = LAC + LOC + LSC + LDC
LCC is a very comprehensive theory that expresses the overall objective of finding the most cost effective solution over a life cycle. The LCC concept embraces a large set of underlying theories that provide the means to meet this objective. A complete LCC analysis will likely include analyses such as, Integrated Logistic Support analysis (ILS), Reliability-Availability-Maintainability (RAM) analysis, economic analysis, risk analysis etc(5,6,19).
4.1.2 Life Cycle Profit
When the LCC theory was transferred from the military context to an industrial application it was evident that the theory is shortcoming on one important matter, namely that the purpose of industrial acquisitions is to support the business concept. In this case the LCC analysis will only reveal information on one side of the business – the cost side. Thus the Life Cycle Profit (LCP) theory was developed to extend the original LCC concept to also include the revenue generating activities in the analysis.
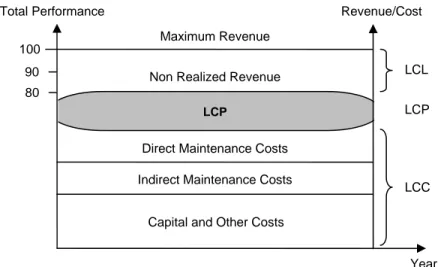
In the LCP analysis, the contribution from revenue generating activities is often represented as non realized revenue. This is illustrated in the cigar curve where asset utilization is plotted against time and cost, and 100% asset utilization means that there is no non realized revenue. Since the organization’s profitability is depending on both what is coming into and what is going out of the organization in terms of capital and resources, the decision maker must find the optimal balance between asset utilization and cost.
Total Performance Revenue/Cost
Maximum Revenue 100
22
Figure 4-2: The LCP cigar curve (Ahlmann, 2002).
LCP
LCL
90 Non Realized Revenue
LCC LCP Direct Maintenance Costs
Indirect Maintenance Costs
Capital and Other Costs 80
The general LCP formula is written as:
LCP = LCR - LAC - LOC - LSC - LDC
LCP, just like LCC, is comprehensive and includes a set of theories aimed to facilitate the analysis of revenue generating businesses, for example, the du Pont scheme and the Balanced Scorecard (BSC). The du Pont scheme is used to analyze how asset utilization, maintenance costs, and operational costs influence the profitability. The Balanced Scorecard links internal efficiency to external efficiency, and shows how they both contribute to the realization of the business concept(1,3,11).
4.1.3 Cost/Revenue Breakdown Structure
The purpose of performing a Cost Breakdown Structure (CBS) is to identify and structure all elements that should be included in the LCC analysis. Cost elements that have a negligible impact on the final LCC result should be disregarded in the CBS in order to simplify the analysis. When performing an LCP analysis, the breakdown process must also consider revenue elements, i.e. a Revenue Breakdown Structure (RBS).
The exact content of the breakdown structure will vary from case to case depending on the purpose of the analysis and the properties of the system, but the elements in the highest CBS level are the same in most cases. These elements are: acquisition costs, operating costs, maintenance costs, and disposal costs.
In order to facilitate and standardize the LCC analysis, most industries have developed CBS templates tailored to specific LCC cases. The Foundation for Scientific and Industrial Research at the Norwegian Institute of Technology (SINTEF) has designed a CBS template for railway maintenance (Appendix I). The template includes all the significant cost elements for a railway LCC analysis, but it does not incorporate any revenue elements. A modified version of SINTEF’s CBS template is recommended in this thesis. This modified version uses LCP terminology and includes the major revenue elements(6,19).
The Support Organization: A Strategic and Value Adding Force
24 LCP (Life Cycle Profit)
LCC (Life Cycle Cost)
LAC (Life Acquisition Cost)
INV (Investment costs of the system or equipment/product: primary investment)
- Equipment and material purchase cost - Engineering cost
- Installation cost - Initial spares cost - Initial training cost LSC (Life Support Costs)
AMC (Annual maintenance costs) - Corrective Maintenance cost - Calendar based PM cost - Condition based PM cost LOC (Life Operating Cost)
AOC (Annual operating costs) - Operating cost
- Energy consumption cost ADC (Annual delay-time costs)
- Short-term delay cost - Long-term delay cost AHC (Annual hazard costs)
- Human safety cost - Environmental threat cost - Cleaning cost
- Rebuilding cost LDC (Life Disposal Costs)
- Disposal and reinvestment cost LCR (Life Cycle Revenue)
LSR (Life Sales Revenue)
ASR (Annual sales revenue)
- Revenue from Single Trip Tickets - Revenue from Monthly Passes
Figure 4-3: Cost/revenue breakdown structure for railway maintenance (developed from SINTEF).
4.1.4 When to Use LCC and LCP?
The LCP approach is clearly better suited for revenue generating organizations, and will never be insufficient (compared to LCC) since it encompasses everything in the LCC concept. On the other hand it includes more parameters, and thus requires more work and input information. Hence if the LCC analysis provides enough information for the decision making, it would be a waste of both time and resources to do a complete LCP analysis. Ahlmann (2002) suggests a
model for when to use LCC and LCP based on the environment the organization is acting in. If the environment is stable and predictable, the organization should focus on internal efficiency and cost, which calls for the LCC approach. If the environment is dynamic and complex, the organization should focus on external efficiency and revenue, which calls for the LCP approach(1).
25
Complex and Dynamic Environment Stable Environment
Normative and Predictable Demand Specifications
Uncertain and Changing Demand Specifications
Figure 4-4: Situation linked life cycle models (developed from Ahlmann, 2002).
4.2 Value
Driven
Maintenance
Value Driven Maintenance (VDM) provides a view on maintenance that is similar to that of LCP. Central to VDM is that maintenance is value adding and that the maintenance management should change focus from cost to value. VDM identifies four main value drives in a maintenance organization: asset utilization, cost control, resource allocation, and Safety, Health and Environment (SHE).
Increased asset utilization is a substantial value driver, since it reduces the non-realized revenue resulting from lost ticket sales and penalty fees to passengers.
Cost control is considered an important value driver, since decreased maintenance costs will raise the profit margin, and thus create more value to the organization.
Better resource allocation has a twofold value adding effect. Firstly it cuts the costs by eliminating superfluous resources, for example, oversized inventory, unnecessary personnel and tools. Secondly it supports higher asset utilization since higher resource availability will reduce the time waiting for resources, and thus increase the asset utilization.
Function Capacity MWT MTTR MDT Internal Efficiency Focus on Cost Function Adaption Capacity Flexibility Maintenance Function Supports Business External Efficiency Focus on Revenue LCP LCC
The Support Organization: A Strategic and Value Adding Force
Safety, health and environment issues are usually connected to industry, political or judicial regulations and laws. This means that not meeting the SHE regulations may jeopardize the survival of the organization, and with that its possibility to create any value whatsoever.
26
Figure 4-5: Value Drivers in Maintenance (Haarman et al, 2004)
While the LCP concept is derived from an engineering perspective, VDM uses more of a business approach to maintenance management. The VDM formula corresponding to the LCP formula is written as:
NPVmaintenance = ∑ {(-ACFAU,t - ACFCC,t - ACFRA,t - ACFSHE,t) + ∑ FSHE,t * (CFAU,t + CFcc,t + CFRA,t + CFSHE,t) / (1+r)t}
In the VDM formula CF and ACF stands for Cash Flow and Additional Cash Flow. AU, CC, RA and SHE are short forms of the four main value drivers.
In addition to the value driver concept, VDM also covers the identification of core maintenance competencies and significant KPIs, as well as a structured system for benchmarking against other similar organizations(10).
4.3 Maintenance
Context
One of the most important performance indicators of a system is its operational availability, which measures the systems ability to accomplish its operational plan. Operational availability is expressed as a function of reliability, maintainability and supportability. Reliability and maintainability are parameters that refer to properties of the system, while supportability regards the capability of the maintenance organization.
Value Value
Safety, Health & Environment
Asset Cost
Value Utilization Control Value
Resource Allocation
Operational Availability (Ao)
27
Figure 4-6: Fundamental maintenance concepts.
4.3.1 Availability
Availability measures the probability that the system will be ready or available for operation when required. There are three commonly used measures of the availability: inherent availability, achieved availability, and operational availability.
Inherent availability (Ai) is the probability that the system will be ready or available for
operation when required, assuming an ideal support environment. In this scenario the maintenance downtime only includes the repair time for corrective maintenance. The inherent availability is expressed as:
ct M MTBF MTBF i A + =
where Mct is the corrective maintenance time.
Achieved availability (Aa) is the probability that the system will be ready or available for
operation when required, including all active maintenance time (corrective and preventive). The achieved availability is expressed as:
M MTBM MTBM a A + =
where M is the mean active maintenance time.
Operational availability (Ao) is the probability that the system will be ready or available for
operation in a real-life environment. This availability measure considers the total maintenance downtime, i.e. both the active maintenance time and the time waiting for maintenance. Ao is the preferred availability measure when assessing a system in a realistic operational environment. The operational availability is expressed as:
MDT MTBM MTBM o A + =
where MDT is the Mean Down Time (MDT = MTTR + MWT) (6,18).
Reliability (MTBF) Maintainability (MTTR) Supportability (MWT) System Organization
The Support Organization: A Strategic and Value Adding Force
4.3.2 Reliability
Reliability concerns the inherent properties of the equipment. It measures the failure frequency of the equipment, which is often expressed as the Mean Time Between Failure (MTBF) or Mean Time To Failure (MTTF). Equipment on vehicles often has a failure rate related to the distance the vehicle has traveled. In this case the failure rate is expressed as the Mean Distance Between Failure (MDBF) or the Mean Distance To Failure (MDTF) (6,18).
Reliability has a large impact on the systems overall profitability, and it is extremely important to consider this aspect already in the early stages of the design process. Designing equipment with high failure resistance will greatly reduce the corrective maintenance costs and also increase the overall asset utilization. Robust design is one concept that stresses the importance of designing equipment with high failure resistance.
Preventive maintenance can for some equipment have a positive effect on the reliability. Although introducing preventive maintenance should be carefully considered, since preventive maintenance on functioning equipment may induce new failures.
4.3.3 Maintainability
Maintainability concerns the possibility to perform maintenance on the equipment. This is measured as the Mean Time To Repair (MTTR). A system with high maintainability will have shorter repair times and probably require less specialized tools and personnel. It is important to consider maintainability in the design process, and the concept “design for maintainability” emphasizes this(6,18).
4.3.4 Supportability
Supportability regards the maintenance organizations’ ability to perform maintenance. This is measured as the Mean Waiting Time (MWT). MWT can be broken down into the Mean Logistics Down Time (MLDT) and the Administrative Delay Time (ADL). MLDT is the queue time waiting for required maintenance resources, and ADL is the time necessary for administrative procedures, for example, failure registration. Increasing the supportability should be a main focus for the maintenance management. This is achieved with effective administration procedures and optimal planning and allocation of the maintenance resources(6,18).
4.3.5 Corrective Maintenance
Corrective Maintenance (CM) is carried out to restore the system functionality when failures occur. Failures are usually categorized as critical or non-critical. In case of a critical failure, the system is not allowed to continue operating, and corrective maintenance must be performed without any scheduling possibilities. In case of a non-critical failure, the system is allowed to complete its current operation and the maintenance planner have some possibilities to schedule the corrective maintenance and make sure that all necessary resources are available. Activities in the corrective maintenance cycle are failure localization, removal of the faulty component, repair or replacement, checkout and verification of functionality(6).
4.3.6 Preventive Maintenance
The purpose of Preventive Maintenance (PM) is to retain the system’s condition, in order to prevent failures from happening. This includes component replacements, calibrations etc. Preventive maintenance is scheduled on fixed intervals or condition based. The intervals could either be time based or based on some other parameter, such as, for example, distance traveled. The condition of a component is either measured through human inspections or monitored by sensors(6).
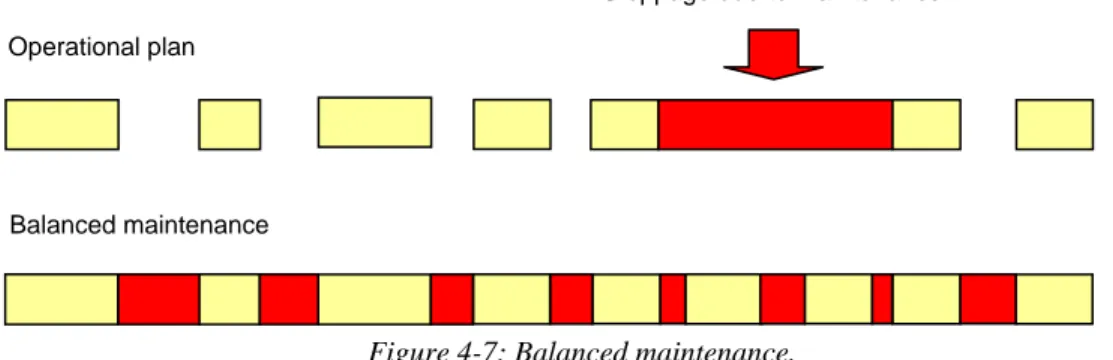
4.3.7 Balanced Maintenance
Systems that do not operate continuously will have periods when maintenance can be performed without affecting the operational availability, and accordingly the asset utilization. The idea with balanced maintenance is to plan the maintenance activities within these non-operational periods. Balanced maintenance is an effective way of increasing the system availability, but it may not always be possible to realize it due to other concerns, for example, union agreements on the maintenance staffs’ working hours.
Stoppage due to maintenance Operational plan
Balanced maintenance
Figure 4-7: Balanced maintenance.
4.3.8 Integrated Logistic Support
Integrated Logistic Support (ILS) is a management view that focuses on controlling the planning, development and operation of a system. The purpose of ILS is to ensure that the end customer is provided with a system that meets the performance requirements, and can efficiently be supported throughout its life cycle. The integration of support elements and other system requirements is an important aspect of the ILS concept. The ILS focus is shifting with the life cycle phases of the system (i.e. evaluation of alternative systems, acquisition, and operation). During the evaluation of alternative systems the focus is to influence the manufacturer to consider aspects like reliability and maintainability in the design process. As the acquisition decision is taken, the focus changes to evaluation of the support needs and provisioning of the necessary support elements. Finally when the system is operating the focus is to plan and provide the support(6).
5
The Public Transport Case and Systecon’s
Engagement
5.1 Background
A transit authority has acquired 30 new commuter trains to gradually replace the current train fleet. The new trains will be delivered over a period of two years.
The new vehicles must meet demands for high reliability and low operational cost. This entails high expectations on the manufacturer to meet the performance requirements and on the maintenance organization to achieve the required availability.
The transit authority has the exclusive right and responsibility to provide public transport in the area. The company owns all the vehicles, maintenance facilities, tools etc, and a private contractor is hired to operate the traffic and maintain the vehicles.
31
Transit
Systecon authority
Figure 5-1: Organizational set-up and flow of resources.
5.2 The Scope of Systecon's Engagement
Systecon is engaged to assist the transit authority in developing and implementing a support strategy for the new trains. Systecon is also involved in the verification of the requirements stated in the contract. The undertaking includes:
• Review of maintenance related agreements
Manufacturer Operator Maintenance
contractor Passenger Traffic Money - Vehicles - Maintenance data - Maintenance intructions - Money - Vehicles - Infrastructure Money Verify - Maintenance plan - Resource optimization
The Support Organization: A Strategic and Value Adding Force • Review of maintenance data
• Definition of a maintenance concept
• Development and implementation of a maintenance plan • RAM verification
The documentation in an acquisition of complex systems, like transit vehicles, is very extensive, and describes in great detail each of the stakeholder’s duties and obligations. The public transport case described in this chapter summarizes the parts of the agreement that are most central to the development of the support organization, as well as how the maintenance data is derived, and how the maintenance guidelines have been drawn up.
Systecon's Engagement ILS Toolbox Processes
Review of maintenance data and LSC.
Catloc
Define the maintenance concept and develop a maintenance plan.
Bal
Resource allocation and implementation of the maintenance plan.
Opus10, Simlox
RAM verification. Madcat
System Documentation Maintenance Depots RAM Verification Contract Operational Profile Development of a Maintenance Plan Define Maintenance Concept Life Cycle Cost
RAM Programme Plan Production Resource Allocation Maintenance Plan Maintenance Tasks (PM,CM) CMMS Maintenance Concept
Figure 5-2: Systecon’s engagement.
5.3 Review of Maintenance Related Agreements
All the responsibilities that the transit authority and the supplier have agreed to fulfill are specified in the contract. Some important areas covered in the contract are price, time and place of delivery, reliability and support costs.
The guaranteed reliability is expressed in the contract as the maximum allowed number of
stopping faults and non-stopping faults per vehicle per million operating kilometers. Stopping
faults are defined as faults that cause a delay of more that 10 minutes, or faults where the vehicle must be taken out of operation after the passengers have been evacuated. Non-stopping faults are defined as faults that occur during operation and cause a delay of between 2 and 10 minutes.
The contract also states the guaranteed upper limit for the life support cost calculated over the entire train fleet. Part of the supplier’s contractual obligations is to produce a detailed LSC analysis that specifies the cost distribution between components and over time. A fine is imposed on the supplier in case the operational availability is not fulfilled or the LSC target is exceeded. The guaranteed reliability and LSC target is only valid if the trains are operated according to the agreed operational rules.
The supplier has also agreed to provide a consignment stock during the first two years of operation. The consignment stock should include all the components that the supplier considers necessary to achieve the operational availability.
Finally the transit authority has a contract option to purchase up to 25 additional trains. Hence, when developing the support strategy, it is important to take into consideration that this option could be realized.
Systecon is engaged in this process to assist in the verification of these very central performance requirements, and to determine the appropriate consignment stock levels.
5.4 Preparation of Maintenance Data
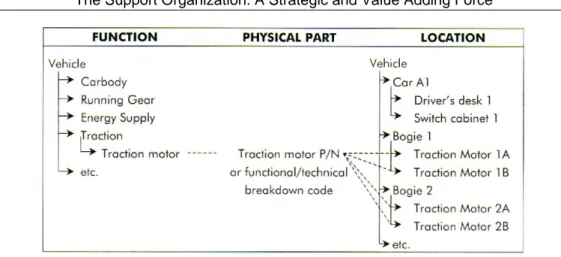
In the acquisition contract it is agreed that the supplier is responsible for the preparation of maintenance data. This includes a detailed description of the system and all the maintenance activities that should be carried out in order to maintain the vehicle’s reliability. In addition to this the supplier should perform a life support cost analysis based on the maintenance data. Systecon is engaged in this process to ensure that the supplier is fulfilling these obligations, and to review the maintenance data so that it is reasonable and useful in the maintenance planning. The system is described in two different structures with respect to function and location of equipment. Each structure provides the following valuable information to the maintenance planning:
• The functional breakdown structure (FBS) describes the functionalities of the vehicle from its main function down to the lowest level of detail
• The location breakdown structure (LBS) indicates each item’s physical location on the vehicle
The Support Organization: A Strategic and Value Adding Force
Figure 5-3: Relationship between functional and location breakdown.
The maintenance data is derived from a reliability analysis, which begins with a Failure Mode, Effects, and Criticality Analysis (FMECA) to identify failures that have significant consequences on the system’s or subsystem’s performance. FMECA intends to identify:
1. Failure mode 2. Failure cause
3. Failure effect on the system/subsystem 4. Criticality
5. Failure rate
6. Failure detection method
7. Required corrective action / preventive or compensation action
Subsequent analyses are carried out to determine the maintenance procedures for each type of failure. These analyses consider:
• If corrective or preventive maintenance is preferred (possible preventive maintenance intervals)
• Maintenance tasks (possible preceding maintenance tasks) • Maintenance level (e.g. vehicle, workshop)
• Personnel and skill requirement • Spare parts
• Support equipment
In this case, the reliability analysis recognized about 900 preventive maintenance tasks and 1000 corrective maintenance tasks. The PM tasks are distributed over about 600 types of components. About 100 of these tasks are expected to take more than 1 hour, and 25 tasks are expected to take more than 4 hours. The PM interval is one year or less for 350 of the tasks, the remaining 550 tasks have a PM interval between 1.5 and 20 years.
35
Figure 5-4: Preventive Maintenance Interval plotted against Task Duration.
Preventive Maintenance - Distribution
0 5 10 15 20 25 30 0 5 10 15 20 25
Task Duration (Hours)
P M I n te rv a l ( Y ears)
The CM tasks are distributed over about 1000 types of components. About 250 of these tasks are expected to take more than 1 hour, and 50 tasks are expected to take more than 4 hours.
Corrective Maintenance - Distribution
0 2 4 6 8 10 12 0 5 10 15 20 25 30
Task Duration (Hours)
Fa il ur e P e r Mi ll io n K il o m e te rs ( F P M K )
Corrective Maintenance - Unavailability
0 0.00002 0.00004 0.00006 0.00008 0.0001 0.00012 0.00014 4. 2 .1-01 -0 1-0 1 4. 2 .1-01 -0 1-0 3 6. 3. 1 -0 1 6. 3. 1 -0 2 4. 3 .2-02 -0 2 7. 2 .1-01 -0 1 6. 1 .1-01 -0 1 4. 3 .2-02 -0 1 1. 5 .1-01 -0 1 7. 2 .1-01 -1 6 7. 2 .1-01 -1 7 7. 2 .1-01 -1 8 8. 3 .2-01 -0 1 1. 5 .1-01 -0 2 8. 1. 2 -0 2 7. 2 .1-01 -0 9 7. 2 .1-01 -3 6-0 3 1. 5 .1-01 -0 3-0 3 6. 3. 1 -0 1 6. 3. 1 -0 2 4. 3 .1-01 -0 3-0 3 4. 3 .1-01 -0 4-0 3 7. 2 .1-01 -0 3 4. 2 .1-01 -0 1-0 2 1. 5. 2 -0 2 6. 1 .1-01 -0 4 5. 2 .1-02 -0 2 7. 2 .1-01 -0 8 7. 2 .1-01 -3 6-0 1 7. 2 .1-01 -1 0 Item FBS Code U n a v a ila b ility (% )
Figure 5-5: Failure Rate plotted against Task Duration.
Figure 5-6: Items with high unavailability.
The supplier’s life support cost analysis is conducted based on the corrective and preventive maintenance tasks identified in the reliability analysis. Maintenance costs that could not directly be connected to the inherent design properties of the vehicle are excluded from the analysis (e.g. costs due to vandalism, maloperation etc.).
The system description along with the FMECA and the subsequent analyses constitute a major input to developing the maintenance plan.
The Support Organization: A Strategic and Value Adding Force
5.5 Definition
of
Maintenance
Concept
The initial maintenance plan suggested by the supplier was composed of fairly large packages of maintenance tasks. This solution was shown through simulation to be incompatible with the operational profile of the vehicle, and therefore not able to meet the availability demands. To facilitate the development of a new improved maintenance plan, Systecon has defined a maintenance concept that includes:
• Classification of maintenance tasks • A balanced maintenance strategy
• Guidelines for the packaging of preventive maintenance tasks
• Regulations on how the maintenance work should be divided up between the depots • Handling of preventive maintenance peaks
Maintenance tasks are classified as light or heavy maintenance depending on the resources required to perform the tasks. Maintenance is permitted during certain predefined periods based on the operational profile of the vehicle. This allows for the definition of a balanced maintenance strategy, where the preventive maintenance tasks are scheduled when the vehicle is not in operation. Heavy maintenance that requires much time should be carried out in the summer, when traffic is usually low.
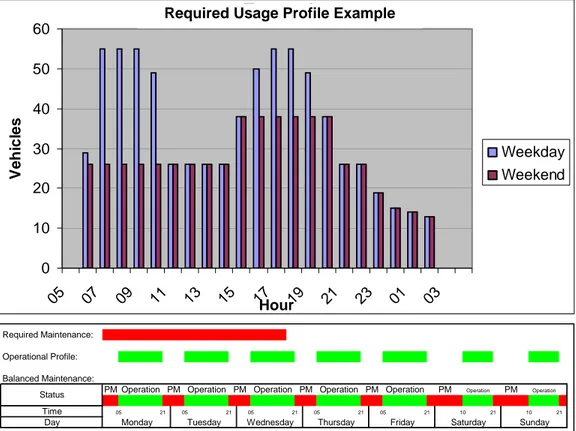
36 Required Maintenance: Operational Profile: Balanced Maintenance: Time Day 10 21 05 21 10 21 Operation PM Operation PM PM Operation PM 05 21 Operation 05 21 05 21 05 21 Status
Thursday Friday Saturday
Operation PM Operation PM Operation PM
Sunday
Monday Tuesday Wednesday
Example
0 10 20 30 40 50 60 05 07 09 11 13 15 17 21 23 01 03 Ve hi c le sFigure 5-7: Operational profile and the corresponding balanced maintenance strategy.
19
Weekday Weekend
Required Usage Profile Example
In order to make the packaging of preventive maintenance tasks flexible, it is important that each specific maintenance task is independent and can be carried out in a relatively short time. The guideline is that it should be possible to complete 98 % of the maintenance tasks in less than 4 hours, and 90 % of the maintenance tasks in less than 1 hour.
Important considerations when creating packages are: • The time it takes to complete the maintenance task • The preventive maintenance interval
• The item’s location on the vehicle • If special tools or skills are required
The maintenance packages should fall into one of the following categories:
• Maintenance packages that can be completed by 4 maintenance technicians in less than 4 hours. These packages are short enough to be carried out on weekdays between morning and evening rush hour.
• Maintenance packages that can be completed by 4 maintenance technicians in less than 8 hours. These packages should be scheduled on nights and weekends.
• Maintenance packages that can be completed by 4 maintenance technicians in between 8 and 16 hours. These packages should be scheduled on weekends.
The maintenance work is divided up between two depots. Light maintenance can if necessary be redirected to a third depot. Systecon has been engaged to analyze both how the vehicles should be distributed between the depots, and how many maintenance tracks that are needed at each depot to handle the workload.
A large part of the heavy preventive maintenance tasks have the same interval. This means that during some periods the workload in the maintenance organization will increase significantly. The maintenance organization will not to be able to handle the workload during these peak periods, unless the organization is temporarily expanded or the preventive maintenance peaks are smoothed out over time.
5.6 Development and Implementation of Maintenance Plan
The objective when developing a maintenance plan is to arrange the maintenance tasks in packages that can be carried out with minimal effect on the operational availability.
The preventive maintenance tasks should be packaged in accordance with the guidelines stated in the maintenance concept. The objective of the packaging process is to create 30-40 maintenance packages out of the 900 PM tasks. The number of maintenance tasks and the parameters that must be considered makes packaging process very complex and difficult to overview.
The maintenance plan is used for resource allocation and maintenance planning, and consists of the maintenance concept along with the maintenance packages and the corrective maintenance. A computerized maintenance management system (CMMS) is used to apply the generic maintenance plan to each individual vehicle. Information on when the vehicle was first put into operation and the total travel distance of the vehicle is used to decide when in time the
The Support Organization: A Strategic and Value Adding Force
preventive maintenance should take place. It is the maintenance supplier’s responsibility to do the detailed maintenance planning based on the information available in the CMMS.
Physical resources should be allocated before the maintenance plan is implemented in the support organization. The objective of the resource allocation is to achieve the desired availability at the lowest possible cost. Important resources considered in the analysis are number of maintenance tracks at the depots, spare stock levels, and maintenance personnel.
5.7 RAM
Verification
Continuous follow-up on maintenance and performance data is carried out during the first two years of operation. The verification intends to ensure that the trains meet the availability and life cycle cost requirement stated in the contract. The verification concerns failure rates, repair times, and costs.
The transit authority and the supplier have agreed on the following regulations for the verification process:
• The verification of the reliability and LSC should be limited to 15 vehicles (delivery number 6 to 20).
• The follow-up procedure should be identical for all vehicles to ensure a consistent verification.
• The verification period is 2 years or 360,000 operating kilometers per vehicle, but only the last 12 months are included in the formal verification. Hence the whole verification process will last for about 32 months.
• The verification should start after 1.5 months (20,000 kilometers) of operation. However the follow-up should start immediately after the vehicles have been put into operation.
Data is collected from various sources and stored in the CMMS. The operators report traffic interruptions. The maintenance personnel register failures and completed maintenance. Delays are verified against the traffic controller.
38
Vehicles 6-20 All vehicles
Figure 5-8: The data gathering process.
Verification parameters
-Start time -Stop time
Total distance traveled needed for verification
Exported from the CMMS
Traffic interruptions
The driver reports to DLC for immediate registration in the CMMS Number of failures The maintenance personnel register failures in the CMMS Completed maintenance The maintenance personnel register completed CM and PM tasks (incl. man hour and resources) in the CMMS
Total distance traveled by vehicle
Transferred from the operational profile into the CMMS
Selection of maintenance data
Selection of maintenance data that is relevant for the verification
Delays
Verify against trafic controller
6
Linking Strategic and Value Driven Theories to
the Public Transport Case
The public transport case described in the previous chapter shows that most of the analyses are based on traditional LCC and logistic support concepts. The LCC and logistic support theories were originally developed and used by organizations with the main objective to meet targets at the lowest cost possible. Hence these theories have a strong focus on cost effectiveness. This focus is not sufficient when designing the support organization for a public transport system, since profitability and corporate strategy are important aspects that must also be considered. Hence, this approach must be extended to embrace the support organization’s full potential as a strategic and value adding force. Chapter 7 presents a framework for developing a strategic and value driven support organization. The framework describes a cycle of activities intended to create the desired support organization. The extended approach described in the framework should be implemented with Systecon’s software suite, which is described in chapter 8.
Before the framework is presented, this section introduces some central strategic and profit driven theories and explains how they apply to the public transport case. This includes a short explanation of how production management thinking could be applied to a public transport maintenance organization, and how the life cycle profit concept spans across the organization and over time.
6.1 Public
Transport
Maintenance
from a Manufacturing Strategy
Perspective
Passengers using public transport buy a service that will take them from one location to another. The public transport company delivers this service by providing a transit system including infrastructure, vehicles, and operators etc. Only as a whole system are these elements of value to the customers (i.e. the passengers). This means, assuming the infrastructure is permanent, that in order for the service to be delivered as promised, a vehicle and an operator must be present at the departure station on time.
The operator and the maintenance supplier have a shared responsibility in the commitment to the passengers. The operator is responsible of operating the vehicles and the maintenance supplier is responsible of ensuring that vehicles are ready for operation in accordance with the timetable. This implies that the support organization’s performance has immediate impact on whether or not the service will be delivered to the customers. In most situations the impact of a system breakdown can be minimized by using buffer stocks or by having the option to postpone the delivery time. None of these solutions work for the public transport case, since it is not financially justifiable to have spare vehicles, and the timetable must be kept. These circumstances make the public transport support system similar to a manufacturing system with a batch process, where products are assembled to order, and on-time delivery is strictly required. The corrective maintenance activities can be compared to production orders with a short delivery time, and preventive maintenance activities can be compared to production orders in the pipeline, where the planning horizon is longer. The corrective maintenance activities
The Support Organization: A Strategic and Value Adding Force
occur as discrete events, thus the support organization must be dimensioned according to forecasts based on the failure rates.
40
Figure 6-1: The public transport support system and a manufacturing system (batch process, assemble to order). Organizational Maintenance Depot 1 (2 tracks) Available vehicles Vehicles on mission Failure?
Public Transport Support System
Yes Scheduled PM? No PM CM Yes No Organizational Maintenance Depot 2 (1 track) 24 h 1 h 168 h Supplier Intermediate Maintenance Depot 24 h MWT+MTTR=MDT Manufacturing System Factory 1 (2 assembly lines) Customer Factory 2 (1 assembly line) 24 h 1 h 24 h Supplier 168 h Order pipeline + forecast Central warehouse Finished goods
Hill (2000) emphasizes the manufacturing system’s strategic role. The essence of these theories is that in order to avoid sub-optimal solutions all functions within a corporation must strive to achieve the overall corporate mission(13). Based on the similarity between manufacturing and maintenance, the same thinking should apply to the public transport scenario. Hence it is of interest to analyze how to incorporate production management theories when designing the maintenance organization for a public transport system.
6.2 Life Cycle Cost/Revenue Elements in the Public Transport
System
The transit authority is outsourcing most of the short-term responsibilities to external contractors, while long-term planning and strategic decisions are controlled in-house. To maintain control of the organization the transit authority collects all revenues and owns all the expensive resources such as vehicles, maintenance facilities etc. The cost/revenue breakdown structure for the transit authority will, with this organizational set-up, mainly consist of outsourcing costs and investments in strategic resources.
41 Transit Authority
Systecon
Figure 6-2: Life Cycle Cost/Revenue elements linked to stakeholders.
LAC
- Investment in vehicles - Investment in initial spares
Manufacturer Operator Maintenance contractor Passenger Traffic Money - Vehicles - Maintenance data - Maintenance instructions - Money - Vehicles - Infrastructure Money Verify - Maintenance plan - Resource optimization - Maintenance facilities - Tools - Spares - Money LCP LOC LSC LDC
- Infrastructure cost - Cost of high cost components
- Disposal cost - Outsourcing cost
- Penalty fees for delays and cancelled departures
- Cost of maintenance facilities
- Outsourcing cost
LCR
- Revenue from ticket sales