DOI: https://doi.org/10.15626/Eco-Tech.2012.016
ADSORPTION OF ORTHOPHOSPHATES IN
WATER BY CARBONACEUS OF BIOLOGICAL
ORIGIN AS ADSORBENT
Marco Tadeu Gomes Vianna
aMarcia Marques
a,b aRio de Janeiro State University-UERJ, Brazil
bLinnaeus University-LNU, Sweden
ABSTRACT
The objective of this study was to evaluate the adsorption capacity calcareous skeleton of animal species (CSAS) in powder form compared to the commercial activated carbon (CAC) powder, as adsorbent for orthophosphates (P) removal from water. The experimental design selected was a factorial design with central composite rotational design (CCRD). In order to optimize the sorption process, a number of independent variables and levels were selected including: adsorption time; adsorbent/adsorbate ratio; pH and temperature. The orthophosphate (P) quantification was performed using the 4500-P E method. The P removal capacity with CAC powder varied from 0.15 to 4.86 mg/L. The maximum removal occurred at 1088 min, initial pH of 7.5, adsorbent/adsorbate ratio of 130, and temperature of 27 ºC. With the CSAS, the phosphorus removal varied from 0.70 to 6.11 mg/L. The maximum removal occurred at 735 min, with initial pH of 9.0, adsorbent/adsorbate ratio of 40 and temperature of 32 ºC. The conclusion is that the CSAS powder can become an interesting alternative as adsorbent material, both from economic and technical viewpoints in several applications, such as treatment of urban and industrial wastewaters and phosphorus removal/ retention to prevent eutrophication of recipient water bodies. Additionally, the final product (phosphorus-adsorbed CSAS powder) can be used as fertilizer and as soil pH adjustment.
KEYWORDS
Adsorption, CSAS powder, phosphorus’s removal
1 INTRODUCTION
The release of nutrients and organic loads, by domestic or industrial effluents is directly associated with the processes of eutrophication of rivers and lakes [5]. Eutrophication can be defined as an accelerated growth of algae and macrophytes. Excessive algae growth quickly changes the quality of the water body due to biomass death and oxygen depletion as well as degradation products that can cause taste, odour, high turbidity and toxins [3]. This phenomenon is directly related to the phosphorus’s release in the water bodies, which is an
essential nutrient. However when excessively available together with other environmental conditions (e.g.: sunlight, temperature) it promotes the growth of macro and micro-aquatic organisms that become the main cause of eutrophication of water bodies. Thus, removal of phosphorus from both industrial and domestic effluents is required [4].
Cheap and easy techniques for removal of phosphate ions from industrial effluents are of great interest due to the large amounts released by fertilizer industries, detergents and pigments among others [7]. The total phosphorus can be found in the following forms in the wastewaters: (i) inorganic polyphosphates and orthophosphates, originated mostly from detergents and other household products, and; (ii) in organic form bound to organic compounds originated from physiological processes. The form in which the orthophosphate is found in the water depends on the pH, chemical species and includes PO43-, HPO42-, H2PO4-,
H3PO4. In a typical wastewater, the predominant form found is HPO4-2 [6].
The currently most used method for phosphorus’s removal from wastewater is chemical precipitation. This method can reduce the concentration of phosphorus to values below 1 mg/L in sewage treatment plants. However, this technique is expensive, requires area for the deposit of chemicals and demands a solution for the precipitate obtained. In addition to the problems of handling the precipitate and subsequent neutralization of the effluent, the technique is unsuitable for the decontamination of effluents containing ions in low concentrations. Chemical precipitation can produce new pollutants in the effluent, having as the environmental consequence, the addition of chloride and sulphate in water bodies [1]. Therefore, alternative techniques for phosphorus removal have been developed and investigated such as, for example, biological treatment, electro-dialysis, reverse osmosis, ultrafiltration and adsorption [7].
Among these techniques the adsorption process can be the most convenient one from the environmental and economic viewpoints. Among the advantages of the adsorption over other techniques is worth to mention the possibility of regenerating adsorbents and/or using low-cost materials [1]. This technique used as a tertiary treatment can generate used adsorbent material that can be utilized in other applications, especially for soil amendment such as correction of soil pH and fertilizer in agriculture [4]. Activated carbon has been the most widely used adsorbent for contaminants adsorption. However, this material exhibits a high production cost, so the research of for new materials with low cost is necessary [9].
In recent years, several adsorbents were tested for the removal of phosphate ions. A review [10] listed a total of 19 natural materials such as apatite, bauxite, limestone, sand, shells, among others, that have been used as adsorbents for the removal of phosphorus. The aim of this research was to assess the ability of adsorbing phosphorus presented by a calcareous skeleton of animal species (CSAS), comparing its performance with that of commercial activated carbon (CAC) powder and using design of experiments (DoE) principles for processes optimization.
2 MATERIAL AND METHODS 2.1 Experimental planning
Glassware: All glassware used in the experiment was washed with hydrochloric acid, and
CSAS powder: The calcareous skeleton (CSAS) was crashed and then, sieved with a
200-mesh sieve. The particle size was the one indicated by the manufacturer of activated charcoal (VETEC Chemistry). Therefore, both CSAS and the commercial activated carbon (CAC) powder were used with the same particle size.
Phosphate ion solution: The phosphate solution was prepared by dissolving the primary
standard potassium dihydrogen phosphate (KH2PO4) in tap water at concentrations suitable
for use (see Table 2).
Phosphorus analyses: The determination of total phosphorus in water followed the 4500-PE
Ascorbic Acid Method described by AWWA (APHA 4500-P E). For spectrophotometric analysis a HACH DR2800 spectrophotometer Dr Lange was used. The amount of phosphorous adsorbed was determined by the difference between the initial concentration of the phosphate solution used and concentration of the solution after adsorption process according to Equation 1.
]
[
]
[
]
[
P
ads
P
inicial
P
finalEq. 1
pH adjustment: Solutions of 0.1N sodium hydroxide and 0.1N hydrochloric acid and a
multiparameter 5 Star Orion (Method: 4500 H + B) were used [2].
2.2 Experimental setup: Factorial design
Four independent variables were selected as the most important ones for the process of phosphorus removal by CAC powder and CSAS powder: (i) contact time; (ii) pH; (iii) adsorbent/adsorbate ratio; (iv) temperature.
In order to assess the best interactions among these variables with the purpose of optimizing the phosphorus removal, a central composite rotational design - CCDR, based on the Response Surface Methodology [8], was used. The independent variables listed in Table 1 and their respective range and levels were chosen according to the literature [10].
Variables Levels -2 -1 0 1 2 Time (min) 30 383 735 1088 1440 pH 6.0 7.5 9.0 10.5 12.0 Adsorbent/Adsorbate Ratio 40 130 220 310 400 Temperature (ºC) 22 27 32 37 42
Table 1 – Coded and actual levels (5) for independent variables (4) selected to be used in a sorption study with phosphorus ions in water and CSAS powder as sorbent.
The experiments were performed in batch mode as predicted by the experimental design. The study was conducted in 250 ml Erlenmeyer flasks containing 100 ml of water with dissolved phosphorous in amounts to fit to a mass of 400 mg adsorbent respecting the adsorbent/ adsorbate ratio predicted by experimental design (Table 2).The total number of runs was 27, including the central point, which were performed in random sequence. This type of planning
allows obtaining mathematical models with linear and quadratic parameters (multiple regressions) of the studied variables. Are calculated the main effects and interaction of variables, their respective coefficients for the mathematical model, as well as analysis of variance - ANOVA to determine the validity of the model.
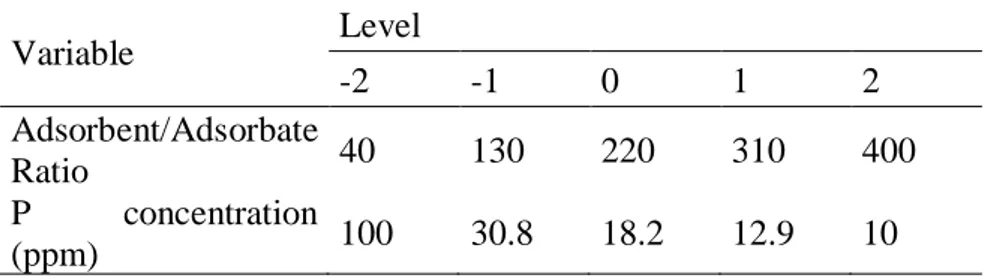
Variable Level -2 -1 0 1 2 Adsorbent/Adsorbate Ratio 40 130 220 310 400 P concentration (ppm) 100 30.8 18.2 12.9 10
Table 2 –Adsorbent/adsorbate ratio and P concentration
By combining the different levels presented in the experimental design it was possible to examine the independent effects of each variable in response to removal, as well as the effect due to the interaction between them.
3 RESULTS AND DISCUSSION
Batch
Variables P removal
Time pH Ads/Adv Ratio Temperature Activated Carbon (mg/L) CSAS powder (mg/L) 1 -1 -1 -1 -1 4.23 4.79 2 1 -1 -1 -1 4.86 5.23 3 -1 1 -1 -1 4.31 4.27 4 1 1 -1 -1 4.12 4.57 5 -1 -1 1 -1 2.14 2.29 6 1 -1 1 -1 2.05 2.47 7 -1 1 1 -1 1.96 2.32 8 1 1 1 -1 2.19 2.44 9 -1 -1 -1 1 3.16 4.64 10 1 -1 -1 1 2.20 3.83 11 -1 1 -1 1 3.75 3.20 12 1 1 -1 1 2.64 3.05 13 -1 -1 1 1 1.96 2.63 14 1 -1 1 1 1.79 2.42 15 -1 1 1 1 1.50 1.99 16 1 1 1 1 1.03 1.95 17 -2 0 0 0 0.26 0.70 18 2 0 0 0 3.00 3.09 19 0 -2 0 0 1.72 1.90 20 0 2 0 0 0.35 2.17 21 0 0 -2 0 2.07 6.11 22 0 0 2 0 0.42 0.63 23 0 0 0 -2 1.57 1.60
Table 3 – Variables and levels applied to the central composite rotational design-CCDR.
Table 3 shows the results obtained with different runs regarding P removal. The values highlighted in bold, represent the highest and lowest results obtained with the experimental setup. The best results were obtained with the run 2 when commercial activated carbon (CAC) powder was used as sorbent. The run 21showed the best result when CSAS powder was used as sorbent. To check the effects of independent variables, the P removal obtained with both adsorbents were analysed separately from the determination of the values of statistical significance.
Commercial Activated Carbon (CAA): As shown in Table 3, the range of phosphorus removal using CAA varied from 0.15 to 4.86 mg/L. The maximum removal occurred in run 2 with contact time of 1087.5 min, initial pH of 7.5, adsorbent/adsorbate ratio of 130 and temperature of 27 °C. The minimum rate of removal occurred in run 24, with contact time of 735 min, initial pH of 9.0, adsorbent/adsorbate ratio of 220 and temperature of 42 °C.
For the results obtained, a Pareto Chart (Figure 1) was generated, which shows the effects of standardized variables, while the vertical dot line represents the 95% of significance level (p=0.05). Looking at Figure 1 one can see that the adsorbent/adsorbate ratio was the only variable, whose tested levels produced responses in terms of P removal that were statistically different. Negative values of the coefficients in Figure 1 mean that the process of P removal in the system using CAA decreased with the increase of that specific variable. For instance, the P removal efficiency increases with the Adsorbent/Adsorbate (Ads/Adv) ratio decreased within the tested range.
Figure 1 – Pareto Chart of Effects to P removal with CAC.
24 0 0 0 2 0.15 0.88
25 0 0 0 0 0.32 1.15
26 0 0 0 0 0.44 1.03
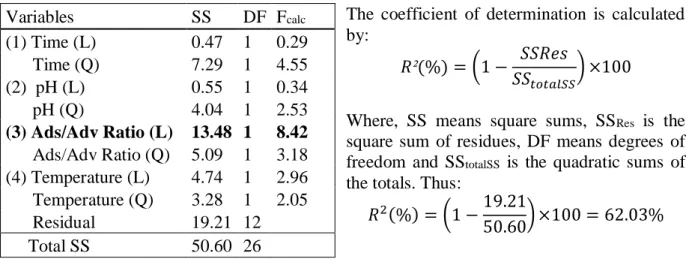
The coefficient of determination R² quantifies the quality of the adjustment proposed by the model, ranging from 0 to 100% [8]. The coefficient of determination is given on the basis of the analysis of variance (ANOVA) model proposed as shown in Table 4.
The coefficient of determination is calculated by:
𝑅²(%) = (1 − 𝑆𝑆𝑅𝑒𝑠
𝑆𝑆𝑡𝑜𝑡𝑎𝑙𝑆𝑆) ×100
Where, SS means square sums, SSRes is the
square sum of residues, DF means degrees of freedom and SStotalSS is the quadratic sums of
the totals. Thus:
𝑅2(%) = (1 −19.21
50.60) ×100 = 62.03%
Table 4 – Variance analysis with Activated Carbon (CAC) as Adsorbent.
The coefficient obtained (R²=62%) reveals that the proposed model does not explain the relationship of the chosen variables adequately. Thus, the factorial design was repeated in order to redefine the ranges of levels for each variable (Table 5), in order to find an optimized model for phosphorus removal. Such planning was done with the promotion of control tests to confirm the removal and increased time to check the behaviour of the adsorbent.
Variables Levels -2 -1 0 1 2 Time (min) 720 1440 2160 2880 3600 pH 4 6 8 10 12 Adsorbent/Adsorbate ratio 40 130 220 310 400 Temperature (ºC) 22 27 32 37 42
Table 5 – Coded and actual new levels for the variables of the experimental design.
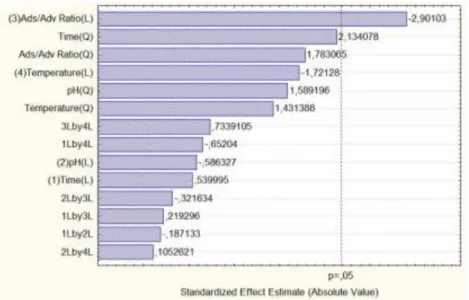
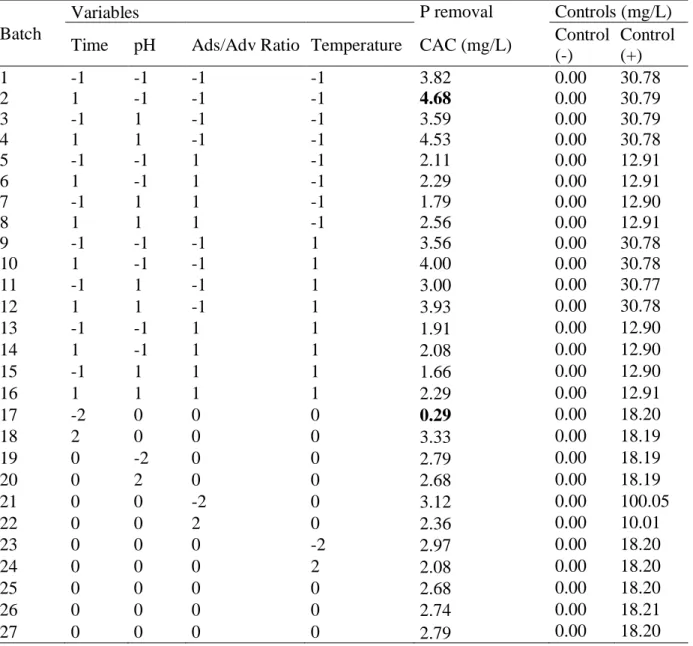
Table 6 shows the coded levels for the variables and respective results obtained. The values highlighted in bold in Table 6 are the highest and lowest P removals. Negative controls (absence of phosphorus in the solution) and positive controls (solutions with phosphorus but no contact with the adsorbent) were applied. The range of phosphorus removal varied from 0.29 to 4.68 mg/L. The maximum removal occurred in run 2 (contact time of 2880 min, initial pH 6.0, adsorbent/adsorbate ratio of 130 and temperature of 27 ° C). The lowest P removal occurred in run 17 (contact time of 720 min, initial pH of 8.0, ratio of adsorbent/adsorbate of 220 and temperature of 32 ° C. A Pareto Chart (Figure 2) presents the effects of standardized variables, while the vertical dot line represents the 95% level of significance (p = 0.05). When Figure 2 is analysed, one can conclude that the adsorbent/adsorbate ratio and time, both in linear term) are the variables whose tested levels produced responses regarding P removal that were statistically different. For the variable time in its linear term, a positive value for the coefficient means that when time passes by (within the time range chosen), P removal significantly increases. Regarding the coefficient of determination or explanation R² there was Variables SS DF Fcalc (1) Time (L) 0.47 1 0.29 Time (Q) 7.29 1 4.55 (2) pH (L) 0.55 1 0.34 pH (Q) 4.04 1 2.53 (3) Ads/Adv Ratio (L) 13.48 1 8.42 Ads/Adv Ratio (Q) 5.09 1 3.18 (4) Temperature (L) 4.74 1 2.96 Temperature (Q) 3.28 1 2.05 Residual 19.21 12 Total SS 50.60 26
an improvement regarding the preliminary study, where the R² was 62%. The new R² was 77.2%, i.e., the relationship between variables in the process of P adsorption by activated carbon is better explained by the new model as shown in Table 7. The surface response for the variables statistically significant is shown in Figure 3.
Batch
Variables P removal Controls (mg/L) Time pH Ads/Adv Ratio Temperature CAC (mg/L) Control
(-) Control (+) 1 -1 -1 -1 -1 3.82 0.00 30.78 2 1 -1 -1 -1 4.68 0.00 30.79 3 -1 1 -1 -1 3.59 0.00 30.79 4 1 1 -1 -1 4.53 0.00 30.78 5 -1 -1 1 -1 2.11 0.00 12.91 6 1 -1 1 -1 2.29 0.00 12.91 7 -1 1 1 -1 1.79 0.00 12.90 8 1 1 1 -1 2.56 0.00 12.91 9 -1 -1 -1 1 3.56 0.00 30.78 10 1 -1 -1 1 4.00 0.00 30.78 11 -1 1 -1 1 3.00 0.00 30.77 12 1 1 -1 1 3.93 0.00 30.78 13 -1 -1 1 1 1.91 0.00 12.90 14 1 -1 1 1 2.08 0.00 12.90 15 -1 1 1 1 1.66 0.00 12.90 16 1 1 1 1 2.29 0.00 12.91 17 -2 0 0 0 0.29 0.00 18.20 18 2 0 0 0 3.33 0.00 18.19 19 0 -2 0 0 2.79 0.00 18.19 20 0 2 0 0 2.68 0.00 18.19 21 0 0 -2 0 3.12 0.00 100.05 22 0 0 2 0 2.36 0.00 10.01 23 0 0 0 -2 2.97 0.00 18.20 24 0 0 0 2 2.08 0.00 18.20 25 0 0 0 0 2.68 0.00 18.20 26 0 0 0 0 2.74 0.00 18.21 27 0 0 0 0 2.79 0.00 18.20
Figure 2 – Pareto Chart of Effects to P removal in Activated Carbon for new variables.
Table 7 - Variance analysis with relation of Activated Carbon Adsorbent.
The coefficient of determination is calculated by: 𝑅2(%) = (1 − 5.39
23.69) ×100 = 77.2%
Thus we find a model that explains fairly well how the independent variables influence the adsorption process. Variables SS DF Fcalc (1) Time (L) 5.04 1 11.21 Time (Q) 0.43 1 0.96 (2) pH (L) 0.07 1 0.17 pH (Q) 0.17 1 0.38 (3) Ads/Adv Ratio (L) 10.60 1 23.60 Ads/Adv Ratio (Q) 0.17 1 0.38 (4) Temperature (L) 0.93 1 2.07 Temperature (Q) 0.03 1 0.06 Residual 5.39 12 Total SS 23.69 26
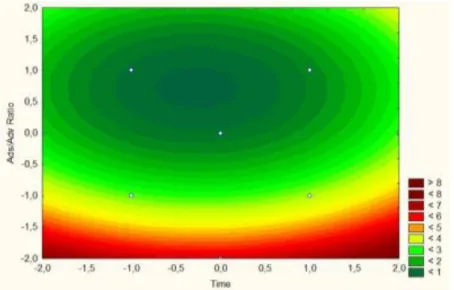
Figure 3 –Response surface for the phosphorus removal by activated carbon (CAC) regarding the independent variables statistically significant Ads/Adv ratio and contact time.
Through analysis of response surfaces (Figures 3 and 4) it appears that the greatest reductions are achieved when the adsorbent/adsorbate ratio is low, or when higher P concentration is found in the solution. Regarding the variable time, at +1.0 (2880 min) the concentration of P removed by the adsorbent remains constant for all adsorbent/adsorbate ratio associated. It is very likely that the activated carbon adsorbent is saturated at 2880 min (2 days). This is an important kinetic factor to be taken into account in future investigations.
Figure 4 – 3D Response surface for the phosphorus removal by activated carbon (CAC) regarding the independent variables statistically significant Ads/Adv ratio and contact time.
CSAS powder: For CSAS powder, the range of phosphorus removal varied from 0.70 to 6.11 mg/L (Table 3). The minimum rate of removal occurred in run 17 with contact time of 30
min, pH of 9.0, adsorbent/adsorbate ratio of 220 and temperature of 32 °C. The maximum P removal occurred in run 21 (contact time of 735 min, initial pH of 9.0, adsorbent/adsorbate ratio of 40 and temperature of 32 °C. The Pareto Chart (Figure 5) presents the effects of standardized variables, while the vertical dot line represents the 95% level of significance (p = 0.05).
Figure 5 – Pareto Chart of effects to P removal using CSAS powder.
Similar to CAC it can be inferred that the adsorbent/adsorbate ratio was the only variable with statistical relevance. The process of P removal by CSAS was favoured at lower adsorbent/adsorbate ratios. This fact is noted by [4] in which the phosphorous removal capacity by calcite (material with composition similar to CSAS) is increased with increasing phosphorus concentration in solution, i.e., with lower ads/adv ratios. The coefficient of determination (R²) is shown in Table 8. The equivalent response surface is shown in Fig. 6.
Table 8 - Variance analysis with relation of CSAS Adsorbent.
Variables SS D F Fcalc (1)Time (L) 0.88 1 1.00 Time (Q) 3.31 1 3.74 (2) pH (L) 0.66 1 0.75 pH (Q) 3.90 1 4.41 (3) Ads/Adv Ratio (L) 28.26 1 31.97 Ads/Adv Ratio (Q) 12.34 1 13.96 (4) Temperature (L) 1.52 1 1.72 Temperature (Q) 1.09 1 1.23 Residual 10.61 12 Total SS 57.22 26
The coefficient of determination is calculated by: 𝑅2(%) = (1 −10.61
57.22) ×100 = 81.5%
Model that explains fairly well how the independent variables influence the adsorption process and the inter-variables relationship.
Figure 6 - Response surface for the phosphorus removal by CSAS.
The contact time had no significant influence regarding the P removal by CSAS. This fact can be attributed to the high speed of adsorption by this adsorbent, leading to a rapid saturation. This fact is predicted by [4] who reported that from 88% to 95% orthophosphates had been adsorbed during the first 15 min of batch test.
In a qualitative and comparative data analysis between adsorbents it was observed that in all tested conditions proposed for contact time up to 24 h, the CSAS powder showed superiority over the activated carbon (CAC) which makes it an attractive as sorbent. The differences in performance between CAC and CSAS are derived from difference in chemical and physical characteristics, which will be a subject of debates in future studies, after a fair characterization of this material.
Figure 7 – 3D response surface for the phosphorus removal by CSAS powder.
4 CONCLUSION
In this study one can see the potential for P removal by calcareous skeleton of animal species (CSAS), being this potential useful at least for domestic sewage treatment. According to [6], the concentration of total phosphorus in raw wastewater in Brazil varies from 4 to 12 mg/L, which requires tertiary treatment of domestic sewage to meet the discharge limit (0.1 mg/L) The used CSAS (adsorbed with P) could be possibly regenerated or used for soil amendment (agricultural fertilizer, pH adjustment for acidic soils) or, in other words, a sustainable option for agriculture uses and eutrophication control. However, detailed studies are required to optimize the P removal, followed by physical, chemical and toxicological characterization of the CSAS. Based on the additional knowledge it will be possible to suggest mechanisms that take place when removing phosphorus and to explain why certain variables does not influence the adsorption processes. Finally, it will be possible to develop treatment protocols using this adsorbent and test its effectiveness for removal of other water pollutants.
ACKNOWLEDGEMENT
The authors acknowledge the scholarship to the first author given by FAPERJ and the support for travelling and exchange program given to Linnaeus University (LNU) and Rio de Janeiro State University (UERJ) by the Swedish Foundation for International Cooperation in Research and Higher Education (STINT).
REFERENCES
[1] Altundogan, H.S.; Tumen, F. Removal os phosphates from aqueous solution by using bauxite.
I: Effect of pH on the adsorption of various phosphates. J. Chem Technol Biotechnol
77:77-85, 2001.
[2] APHA. Standard Methods for de Examination of Water and Wastewater, 20ª. ed. Washington, D.C.: American Public Health Association, 1998.
[3] Costa, L. L.; Ceballos, B. S. O.; Meira, C. M. B. S.; Cavalcanti, M. L. F. Eficiência de
bacteriófagos (in Portuguese). Revista de Biologia e Ciências da Terra, v. 3, n. 1. 1º semestre
de 2003.
[4] Karageorgiou, K.; Paschalis, M.; Anastassakis, G. N.; Removal of phosphate species from
solution by adsorption onto calcite used as natural adsorbent. J. Hazard. Mater. 2006, 139,
447-452
[5] Philippi Jr., A. (Ed.). Saneamento, Saúde e Ambiente. Fundamentos para um desenvolvimento
sustentável (in Portuguese). Manole, Universidade de São Paulo, Faculdade de Saúde Pública
e Núcleo de Informações em Saúde Ambiental. São Paulo. p. 181, 2005.
[6] Programa de Pesquisa em Saneamento Básico 5 - PROSAB 5. Nutrientes de esgoto sanitário:
utilização e remoção (in Portuguese). Coordenadores: Francisco Suetônio Bastos Mota &
Marcos von Sperling. Rio de Janeiro: ABES, 2009.
[7] Rodrigues, L. A.; Silva, M.L.C.P. Adsorção de íons fosfato em óxido de nióbio hidratado (in
Portuguese). Química Nova, vol.32, No. 5, 1206-1211, 2009
[8] Rodrigues, M. I., Iemma, A. F. Planejamento de experimentos e otimização de processos: uma
estratégia sequencial de planejamentos (in Portuguese). Campinas, SP: Casa do Espírito
Amigo Fraternidade Fé e Amor, 2009.
[9] Santos, E.G.; Alsina, O.L.S.; Silva, F.LH. Estudo da capacidade de adsorção de biomassas
para contaminantes orgânicos (in Portuguese). In: Congresso Brasileiro de P & D em
Petróleo e Gás Natural , II, 2003.
[10] Vohla, C.; Koiv, M.; Bavor H.J.; Chazarenc, F.; Mander, U. Filter materials for phosphorus
removal from wastewater in treatment wetlands – A review. Ecological Engineering 37,