SKI Report 02:8
Latency and Mode of Error Detection
as Reflected in Swedish Licensee Event
Reports
Ola Svenson
Ilkka Salo
March 2002
SKI PERSPEKTIV
Bakgrund
RO-rapporter (rapportervärda omständigheter) – Licencee Event Reports” – från en industri ger värdefulla återkopplingar till industrin själv, myndigheter och till allmänheten. Det är följaktligen väsentligt att rapporteringen genomförs med hög kvalitet. RO-rapporter är ett viktigt bidrag för erfarenhetsåterföring och säkerhetstänkandet, både vid respektive
anläggning och för verksamheten i stort. Ur ett säkerhetsperspektiv är det naturligtvis bättre ju tidigare ett fel upptäcks och ju snabbare felet åtgärdas.
SKI har, i samarbete med Stockholms Universitet, finansierat detta projekt och även bidragit med material för att kartlägga rapporter från fyra svenska kärnkraftsanläggningar. RO-rapporterna analyserades för att kartlägga upptäcktstider, hur fel upptäcktes och för att beskriva kvalitativa skillnader i rapporteringen från olika reaktorer.
SKI:s syfte
Syftet med studien var att analysera tillståndshavarnas RO-rapportering med fokus på hur fel upptäcktes och hur lång tid det tog att upptäcka felet efter att det initierats.
Dessutom var syftet att kartlägga framtida behov av forskning inom området händelserapportering.
Resultat
Resultatet visade att majoriteten av fel upptäcktes så gott som omedelbart. Ungefär 40 procent av felen upptäcktes i planerade test och 40 procent genom larm medan omkring 10 procent av felen upptäcktes då operatörerna noterade någonting onormalt i anläggningen. Övriga fel upptäcktes på andra sätt. Fel som upptäcktes via larm upptäcktes mycket snabbare än fel och brister som upptäcktes via planerade test.
Resultatet indikerade också skillnader mellan anläggningarna både vad gällde kvaliteten i och kvantiteten av information i rapporterna. Detta reflekterar möjligen kulturella skillnader mellan anläggningarna.
Förutom specifik information i händelserapporteringen har möjligen RO-rapporteringar även en mer allmän påverkan på säkerhetskulturen inom kärnkraftsindustrin. Då RO-rapportering har en offentlig karaktär representerar dessa en officiell deklaration att någonting är fel. Detta ökar sannolikt chansen att rapporteringen leder till att förebyggande åtgärder initieras.
För de anställda vid anläggningarna har troligen en rutin med RO-rapporteringar delaktighet i att bevara och motivera ett säkerhetstänkande på hög nivå. Något som vidare kan bidra till ett en aktiv säkerhetskultur inom organisationerna.
Fortsatt verksamhet
Resultatet från föreliggande studie har aktualiserat två frågeställningar som anknyter till RO-rapporteringar och där behovet finns av fördjupad kunskap.
För att rapporteringen skall bli effektivare bör eventuellt RO-rapporteringarna formaliseras ytterligare för att kunna fungera som jämförelsematerial över tid och mellan anläggningar. Detta visar på ett behov av ökad kunskap av omfattande analyser av komplexa
orsaksförhållanden.
De stora skillnaderna mellan anläggningarnas RO-rapportering aktualiserade ett behov av vidare forskning inom detta område. Resultatet från en sådan undersökning skulle kunna belysa skillnader både vad gäller teknologi och organisation och öppna för en diskussion om hur man skall förbättra situationen.
Effekt på SKI:s verksamhet
Denna studie tydliggör värdet av RO-rapporter av hög kvalitet. Studien visar också på forskningsbehov som finns inom området.
Projektinformation
Projekthandläggare på SKI: Anne Edland Projektnummer: 98150
SKI Report 02:8
Latency and Mode of Error Detection
as Reflected in Swedish Licensee Event
Reports
Ola Svenson¹
Ilkka Salo¹ ²
¹Stockholm University, Department of Psychology,
SE 106 91 Stockholm, Sweden
²Lund University, Department of Psychology,
SE 221 00 Lund, Sweden
March 2002
This report concerns a study which has been conducted for the Swedish Nuclear Power Inspectorate (SKI). The conclusions
Table of Contents
Summary....………....3
1. Introduction………...………4
2. Method……….…..7
2.1 Material………...7 2.2 Procedure……….…………...82.3 Time judgments and criteria for judgments……….………….. 8
3. Results………...……….……….………...9
3.1 First line cause detection time……….………...9
3.2 Reliability of time judgements……….……….10
3.3 Remaining proportions of first line failure over time……….….…….10
3.4 Mode of detecting failure condition……….………12
3.5 Characteristics of reports……….……….……....14
4. Concluding remarks...……….………...…15
Summary
Licensee event reports (LERs) from an industry provide important information feedback about safety to the industry it self, the regulators and to the public. LERs from four nuclear power reactors were analyzed to find out about detection times, mode of detection and qualitative differences in reports from different reactors. The reliability of the codings was satisfactory and measured as the covariance between the ratings from two independent judges. The results showed differences in detection time across the reactors. On the average about ten percent of the errors remained undetected for 100 weeks or more, but the great majority of errors were detected soon after their first appearance in the plant. On the average 40 percent of the errors were
detected in regular tests and 40 per cent through alarms. Operators found about 10 per cent of the errors through noticing something abnormal in the plant. The remaining errors were detected in various other ways. There were qualitative differences between the LERs from the different reactors reflecting the different conditions in the plants. The number of reports differed by a magnitude 1:2 between the different plants. However, a greater number of LERs can indicate both higher safety standards (e.g., a greater willingness to report all possible events to be able to learn from them) and lower safety standards (e.g., reporting as few events as possible to make a good impression). It was pointed out that LERs are indispensable in order to maintain safety of an industry and that the differences between plants found in the analyses of this study indicate how error reports can be used to initiate further investigations for improved safety.
Sammanfattning (Summary in Swedish)
“Licencee event reports” – RO-rapporter från en industri ger värdefulla återkopplingar till industrin själv, myndigheter och till allmänheten. RO-rapporter från fyra kärnkraftsreaktorer analyserades för att kartlägga upptäcktstider, hur ett fel upptäcktes och beskriva kvalitativa skillnader i rapporteringen från olika reaktorer. Reliabiliteten i kodningarna var tillfredsställande (mätt som kovariansen mellan skattningarna från två oberoende bedömare). Resultaten visade på förväntade skillnader mellan reaktorerna och att majoriteten av fel upptäcktes så gott som
omedelbart. Ungefär 10 % av felen kvarstod efter 100 veckor och ungefär 40 % av felen
upptäcktes i planerade test och 40 % genom larm. Antalet RO-rapporter varierade med en faktor två över de olika reaktorerna. Slutligen underströks det att kvantiteten RO-rapporter inte är en entydig indikator på säkerhet, men att de är nödvändiga och kan vara användbara för att initiera undersökningar av betydelse för säkerheten vid en reaktor.
1. Introduction
The purpose of the present study is to analyze licensee event reports (LERs), with particular emphasis on how human agents detect the reported errors or failures and how long it takes to detect the errors or failures.
Incidents and accidents are analyzed with the purpose of learning from operating experience about how to improve systems to avoid new incidents, accidents and degradations of the systems. In some high-risk industries, such as, the nuclear power, chemical and air transport industries some reports directly relevant to the safety of the system are demanded by regulating agencies. To exemplify, in Sweden the Swedish Nuclear Power Inspectorate (SKI) demands that Licensee Event Reports (LERs) are written if this is required by the Technical Specifications. The SKI Regulatory Code (SKI, 1998) gives the criteria for reporting safety related events in the Swedish nuclear industry.
A human or technical failure in a complex Man-Technology-Organizational system can be manifest, with consequences appearing immediately, or a latent failure condition with no consequences for a long time. Many failures are manifest and appear immediately as will be clear from the data collected in this report.
However, other failures originate in latent failure conditions in components or subsystems and do not appear until a process depending on that particular component or system is activated. To illustrate, latent failure conditions in the lifeboats of a ship do not become manifest until the ship is in danger and the lifeboats are needed for evacuation. Failure conditions in the emergency planning on the ship becomes manifest when the accident has already occurred etc. As long as a latent failure conditions have not been eliminated or the effects ameliorated, the system is at risk. Latent failure conditions can cause single failures in a system or dependent failures in redundant systems (parallel systems to protect the safety of a system). The second type of failure is called Common Cause Failures (CCF) and they pose the most serious threats to a complex system designed for safety. A latent failure condition is necessary but not sufficient for an accident. When a failure condition first appears in a system, the time window for handling and eliminating that condition starts. The sooner that condition is eliminated or successfully processed in other ways, the better it is in terms of the risk of the system to fail. Lydell (1998) gave an overview of latent failures that matured into events in nuclear power plants over the world based on
internationally available data.
Risk analysts using Probabilistic Safety Analysis (PSA) including Human Reliability models (HRA) have an interest in relative frequency data concerning detection times of failure conditions to improve the precision of their analyses. Hannaman, Spurgin and Lukic (1984) introduced the Human Cognitive Reliability Model (HCR) for use in PSA analysis. In the HCR model, failure detection, diagnosis and relative recovery frequencies for different kinds of human actions are related to time since the failure was discovered. Swain and Guttman (1983) also treated failure recovery time in their seminal handbook. On the technical side the T-boken lists reliability data for components in Nordic nuclear reactors (TUD, 2000).
The time it takes to diagnose and recover from a failure condition is an indictor of technical, human and organizational efficiency. Baumont, Menage and Bigot (1997) studied recoveries from a number of events in a French study of the nuclear power industry. The researchers used 65 human failure and/or equipment failure events reported during power operation and 62 events that took place during plant outage to determine the times needed for recovery.
The events were divided into 4 different groups of which the first group contained errors that were recovered before the system with the error was activated (e.g., in a test). The second group contained errors that were recovered only after the system with the error had been engaged and the error had become obvious (through, e.g., alarms or operator detection). A third group contained errors made and recovered after an incident had started (e.g., equipment and accident management errors). Finally, a last category was created recovery of failure conditions involving multiple errors (e.g., latent equipment failure conditions and operating errors). Failure conditions of the first two groups will be analyzed in the present study.
Because the reports used by Baumont et al. were not designed for recovery time analysis, the times had to be reconstructed in some cases and were missing in others. Still, very interesting results were found and displayed in plots of relative frequencies of detection, diagnosis and recovery over time since an error first appeared in a system. The results showed that, for example, the estimated probability of an early detection of an error or failure condition was smaller during normal operation than during outage. The initial work was later summarized, enlarged and refined by Baumont (1999).
The present study will focus on presenting a method for analysis of times for failure condition detection and apply the method to licensee event reports from the 11 running Swedish nuclear power reactors. A total of 400 - 500 of those reports are sent to SKI each year from the four nuclear power sites in Sweden. The licensee event reports are demanded on standard forms with the option to add additional sheets, giving the staff at a plant the possibility to provide the information they consider important. The forms have both boxes with pre-defined reporting categories, such as, power output from reactor when the event occurred, departments in the plant that should be particularly interested in the event and so on. There are also open spaces in which, for example, a narrative of the event can be given, the causes behind the event and the
consequences for the safety of the plant.
As indicated earlier, a LER according to (SKI, 1998) is required when there is or has been some failure event, degradation in a safety related system, human error or failure in the organization at the plant. To explain why the event occurred, there is a need of a causal model that can be more or less complex (Svenson, 1991, 1999; Hale, Wilpert & Freitag, 1997; Leveson, 1995; Leplat, 1995; Kouabenan, 1999; Hollnagel, 1998, 1999; Dawes, 1993; van der Schaaf, 1992).
However, in the present context only the last stage (first line cause) preceding the reported incident will be used in the analyses. Typically, the first line cause consists of one factor or condition causing the reported event. Sometimes it is impossible to differentiate in time when two or more factors appeared. Therefore, first line causes can sometimes consist of more than one cause or condition.
To illustrate, a single first line cause factor, let the reported event (LER) be the failure of a fan. In the LER it is clear that the fan has fallen down from its rack and therefore it does not run as required. The event reported is the failure of the fan and the first line cause is the collapse of the rack in which it is mounted. It is also clear from the LER that there was a leakage of water dripping on the rack causing corrosion of a vital part of the rack. Here, the collapse of the rack is a first line cause and the dripping water a second line cause (counted from the LER event). The present study is specifically devoted to the study of first line causes. (It is clear that interacting causes behind the first line cause level have to be addressed from a risk reduction point of view, but in the present report we focus on the human agent detecting the first line causes). As
exemplify, 3 of 4 parallel redundant systems may fail at the same time and thereby cause a LER event.
Figure 1 illustrates the immediately preceding cause(s) to a reported event, the event and the detection of the event. Note that A represents an event evolution that is characterized by one first line cause (1) and only one cause (21) leading to the first line cause. A more complex event evolution is depicted under B. Here, there are two simultaneous first line causes (2 and 3). The left of these causes (2) has only one second line cause (22) but the other has two causes (23 and 24) that interact in producing the first line cause (3).
--- A --- - B
FIRST LINE CAUSES
Figure 1. Accident causation models with one (A) or more (B) first line causes leading to a LER failure. See text for further explanation.
In the present study the kind of simple model(s) illustrated in Figure 1 will be used to collect data for the analyses in terms of latencies for detecting the failure condition event and modes of detecting the failure conditions (test, operator, alarm). To repeat, the purpose of the present study is to analyze licensee event reports (LERs), with particular emphasis on how human agents detect the reported errors or failures and how long it takes to detect the error or failure from the appearance of the last causal factor(s) leading to the reported error or failure.
Cause 21 Cause 22 Cause 23 Cause24 Cause 1 Cause 2 Cause 3 LER Failure Detection LER Failure B LER Failure Detection LER Failure A
2. Method 2.1 Material
Licensee event reports (LERs) from 4 nuclear power plants were used in the analyses. The LERs were all the reports received by the Swedish Nuclear Power Inspectorate (SKI) during 1999. During that time reactor A contributed 15, reactor B 19, reactor C 28 (two LERs were submitted later and were not included here) and reactor D 31 LERs. Reactors A and B are quite similar reactors technically (same manufacturer and design) but located at different sites. This is also the case for reactors C and D, which are also from the same manufacturer but represent an earlier generation of reactors. All the reactors are boiling water reactors. Although the forms on which LERs are reported are the same, the reports vary in the kind of information provided and how detailed it was. Of particular interest here is the fact that some LERs give explicit information about the times needed for the analyses of the present study, while those times had to be inferred (e.g., through information about times for tests, maintenance, outage) or determined for different coding categories. FIRST LINE CAUSES (FLC) (I) (III) (II) FLC time
Figure 2. Different modes of detecting failures. Roman digits refer to categories in Table 1. See text for further explanation.
Cause Cause LER failure System protection actuation ALARM Operator detection of LER Test of
system Systemprotection
actuation
Other, e.g.,
The model for measuring time is depicted in Figure 2. The First Line Cause time – FLC time is the time from the last cause preceding the LER event until detection of the fault. The figure also describes three ways in which a failure event can be detected, (I) system failure reactions, (II) tests and (II) alarms. These ways of detecting failures will further specified later.
2.2 Procedure
The two authors acted as judges and analyzed all the available material. One of us (IS) has experience from work in a process industry and a Ph D in psychology and OS has conducted human factors research in the nuclear power industry over the past 15 years.
First, one judge went through all the reports from two reactors (A and B) and assessed the FLC times to be able to develop a coding scheme that could be used for all LERs including those with less precise or missing information. Second, both judges made new time judgments for the LERs from the A reactor (without having access to the initial time judgments ). In this procedure both judges read through one LER at a time and suggested a time judgment. Each LER was then discussed by the two judges and the time was determined in a joint judgment. The B reactor was left to the last judgment session as described below.
For reactor D, each of the judges first made an independent set of judgments for all the LERs. After this, the time judgments for each LER were compared. Deviations were discussed in relation to the LER text and a joint time was determined. For the C reactor the judgments were again made independently and the agreement between the two judges was determined to provide an estimate of inter-judge reliability.
Finally, the LERs from the B reactor were analyzed independently by the two judges and when there was a deviation in time it was discussed and a final joint judgment agreed on. The inter-judge reliability was also determined for this last set of judgments.
2.3 Time judgements and criteria for judgments
As introduced above, the time from the introduction of a (first line) cause leading to a LER until it is detected will be called First Line Cause detection time (FLC time). Unfortunately, all LER reports do not give information about the exact LER times and in some cases the LER time cannot be specified with certainty by the personnel at the plant. When the present authors found uncertainty concerning when a failure condition was first introduced, a conservative estimate was applied. A conservative estimate means that, for example, a failure of a standby pump that was tested and passed the annual test a year ago (and was not tested after that) was given a FLC time of one year. We do not know when the error was introduced but we do know for sure that the pump was without error one year ago and this is the certain information that will be used. (This differs from most reliability analyses in which half of this interval is used. Using the whole interval is a conservative measure that accommodates all errors including those introduced during maintenance.) Correspondingly, a conservative estimate will be given also for parameters that may drift over time (e.g., instrument calibrations) and it will be assumed that their values were acceptable at the last test but that this cannot be taken for granted thereafter. In this way, the data represent a truly conservative quality level. The LER time was expressed in failure weeks, a month was counted as 30 days and a year as 52 weeks. Days and hours were expressed as decimal fractions of weeks.
To specify further, the following rules were used when judging the time of failure condition in a system.
(1) First line errors that do not repeat themselves or cannot be found, but are not computer errors, are given a FLC time corresponding to the time since the last test.
(2) Computer errors (bugs, software, repeatable or non-repeatable) are given an FLC time of one year (52 weeks) if other information is unavailable.
(3) Computer errors that are hardware failures are given an FLC time as other system components.
(4) First line errors when mounting a component or system into the nuclear power plant are given a time of 2 years if adequate information is missing. (We are aware of the fact that more exact information concerning must be available at the different plants, but have chosen to use this approximation for practical reasons. In the few cases in which, this information is not available this could be interpreted as missing information in the LERs)
(5) When a component or system is under continuous surveillance The FLC time is set at 0.0001 weeks.
(6) If a component fails that is not tested regularly (explained as "aging" or the like), the FLC time is set at 4 years if the time of installation is not given in the LER report. (Again, we are aware of the fact that more exact information concerning should be available at the different plants, but have chosen to use this approximation for practical reasons.)
(7) If a component has a construction defect, the FLC time is set at 10 years if other information is lacking in the LER report.
(8) The FLC time since outage is chosen as the time after the first of the month in which most of the outage period was located. If the outage covers more than one full month the first of the first of these months will be used as a reference.
(9) When there is no information about time of day for last time when a system or a component was checked and cleared, noon is chosen as starting point of the FLC time.
3. Results
A first result was that while many LERs were quite complete, so many of the LERs gave incomplete or implicit information about the time a failure condition had been residing in the system. The levels of detail of qualitative and quantitative information in the reports varied across reactors and might reflect cultural differences in the plants.
3.1 First line cause detection time
The first line cause detection (FLC) times, were derived from an implicit or explicit accident model in which one or two simultaneous causes immediately preceded the LER failure (cf., Figure 1). Some LERs included more complex models beyond the firs line causes and more details about these models will be provided in a later study. In the present study, irrespective of the complexity of the complete model used in the LER, the first line cause or causes were
identified. The time that had passed since the introduction of the FLC was coded as the first line cause detection time (FLC time).
3.2 Reliability of time judgments
Inter-judge reliabilities were determined for two of the reactors (A and C). For reactor A, 3 LERs were coded differently. One judge coded these LERs as construction errors as opposed to the other judge who coded them as other kinds of errors. After discussion the deviant 3 LERs were coded as construction errors and given a time of 208 weeks. When the 3 deviant cases were set equal the inter-judge correlation was r = .998 (alpha = 0.01, N = 15).
For the reactor C, the time judgments from the judges coincided for 16 LERs (within a difference interval of 0.00 - 0.01 weeks), judgments for 9 LERs differed by 0.02 to 22 weeks and judgments for 3 LERs differed by 50 or more weeks. The three greater differences depended on discrepancies in the reading of the LERs and after having adjusted the reading between the judges, the Pearson correlation became r = 0.99 (alpha = 0.01, N = 28) between the two judges.
3.3 Remaining proportions of first line failure causes over time
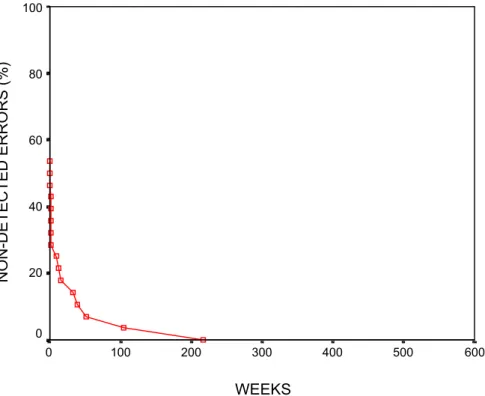
Figure 3 shows the proportion of non-detected first line causes as a function of time since the failure condition was introduced for reactors A and B (FLC time). Reactors A and B were plotted in the same diagram because of too small samples for separate plots. Figures 4 and 5 show the corresponding plots for reactors C and D.
Figure 3. Percentage non-detected first line causes remaining in system/component over time for reactors A and B (N = 34). WEEKS 600 500 400 300 200 100 0 NON-DETECTED ERRORS (%) 100 80 60 40 20 0
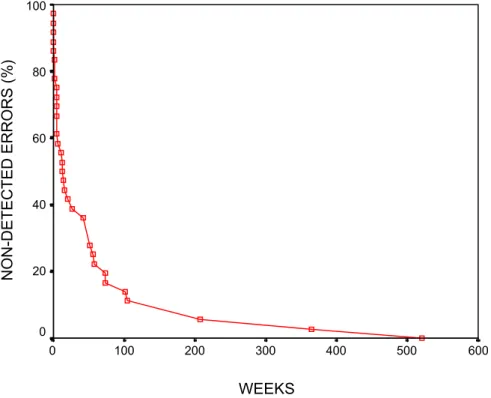
Figure 4. Percentage of non-detected first line causes remaining in system/component over time for reactor C (N=28)
Figure 5. Percentage of non-detected first line causes remaining in system/component over time for reactor D (N=31). WEEKS 600 500 400 300 200 100 0 NON-DETECTED ERRORS (%) 100 80 60 40 20 0 WEEKS 600 500 400 300 200 100 0 NON-DETECTED ERRORS (%) 100 80 60 40 20 0
About half of the failures were detected rather quickly in all plants. The plots also show that, with the exception of reactor C, about 40% of the failure conditions remained undetected for 10 weeks and 20% of the failure conditions for several weeks up to a year or more. Generally speaking, the errors resided for shorter periods of time in reactor C than on average in the other reactors. This cannot be explained by significantly fewer reports than the other reactors. Plant C had a greater number of grounding errors of the electric equipment than the other plants and that kind of error appeared quickly and was also detected quickly. However, due to the small samples statistical test of, e.g., trends (see Lehtinen, Pulkinen & Pörn, 1997 for an overview in this report series) were not applicable.
3.4 Mode of detecting failure condition
Figure 2 gives a schematic overview that was used for characterizing modes of failure detection in LERs. Failure conditions can be detected in different ways. To illustrate, operators may notice failures when the system is in operation through self-controls or observations of the process or systems reactions. A failure can also be detected through an alarm, and/or in a test.
Table 1 gives some statistics concerning these failure detection modes. The rules of classification into categories were the following. Category (I) was used when operators detected failures without alarms. Examples of this category are when there is an abnormal value of a parameter and when an order is not executed properly by a system. Category (II) was used for all failures detected in tests (with or without alarms). Category (III) was applied for all LERs with an alarm appearing in a non-test situation. Finally category (IV) was used when failures were detected in other ways. To exemplify, when some failures were detected some changes were made to the building and control of the blueprints for the electric installations revealed the safety related errors.
Table 1. Distribution of failure detection modes across reactors. Mode of detection Reactor (I) Operator (II) Test (III) Alarm (IV) Other A 1 10 4 0 B 5 5 9 0 C 5 8 15 0 D 5 13 8 5 Total 16 36 36 5
There are two categories in Table 1 that contained most of the LERs, the test and alarm categories. Therefore, proportions of non-detected failures causes were plotted for these two categories.
Figure 6. Percentage of non-detected first line causes remaining in system/component over time for all reactors. Failure cause detection occurred in tests.
Figure 6 shows the proportion of non-detected errors for the test category. Half of the FLC failures were detected after 13 weeks and 10 per cent had resided in the system for 70 weeks
WEEKS 600 500 400 300 200 100 0 NON-DETECTED ERRORS (%) 100 80 60 40 20 0
before they were detected
Figure 7. Percentage of non-detected first line causes remaining in system/component over time for all reactors. Failure detection occurred through alarms.
Figure 7 indicates that the vast majority of FLC failures detected through alarms had not been present in the system for very long. About 50% were detected within seconds and minutes. After 4 weeks 80% of the failures were detected. Comparing test and alarm it is clear that the test detection curve does not flatten out as early as the alarm curve and this reflects a reasonable relationship.
3.5 Characteristics of reports
As mentioned earlier, the reactors were pair-wise very similar in construction (A and B, C and D). Despite this fact, the character of the LERs was different across reactors within the pairs. LERs from reactor A were predominantly technical in character with only 1 of 15 LERs that had a significant human error LER. This is in contrast with reactor B who reported 6 of 19 LERs as human factors related. This number was arrived at in closer analysis of the LERs and is a little greater than the initial classification made by the staff at the reactor.
Both A and B reported fewer errors than the other pair of reactors. Reactor C reported 6 of 28 LERs with significant human errors and D reported 8 of 31 as human factors related as classified by the present authors. Reactor C had a large number of errors related to grounding problems of electric components and systems. There were 12 electric earth fault errors of the 28 LERs from that plant. In addition, there was one LER with two electric earth fault errors and another report with several grounding errors. We followed the practice of the plant and used one LER as one
WEEKS 600 500 400 300 200 100 0 NON-DETECTED ERRORS (%) 100 80 60 40 20 0
data point irrespective of the number of electric earth errors. (SKI permits several earth fault failures to be reported in the same LER). Reactor D had a variety of different kinds of LERs that could not be classified in a simple way.
4. Concluding remarks
The results indicated differences in the quality of reports across reactors. In the individual case an incomplete LER is no problem because the information can always be explained and
completed in following communications if that particular event is analyzed further. However, a high quality of the reports is needed for meta-analyses across time and space (plants) for which, it is impossible or too resource consuming to investigate in detail each of a great number of individual LERs. To illustrate, given more information on the LER forms, the coding system for determining FLC times can be improved and some of the coding rules eliminated. There were great differences in the kinds of failures reported across plants and time. The curves of remaining failure conditions over time approached their asymptotes with different speeds indicating
differences in failure detection. Failures that were detected through alarms were detected much faster than failures detected in planned tests. It is interesting to note that LER reports often refer to functions who fail or are not available and then the first line cause is the first error that can be traced back in the accident evolution chain (Svenson, 2000) to a system designed to carry out the failing function.
LERs are part of an information network including many information feedback loops
concerning, e.g., economy, production, maintenance and safety. Because there are many other sources of performance indicators available at a plant - including safety features available to SKI – the official and open LERs may seem less important. However, because of the open character of the LERs, a LER represents an official declaration that something was wrong and may lead to a relatively strong commitment to initiate countermeasures. LERs also contribute to keeping safety aspects in the minds of the people working at a plant. This in turn can contribute to the maintenance of an active safety culture in an organization.
A smaller number of LERs reported from a plant is not necessarily an indicator a safer plant. Generally speaking, the threshold for reporting may be higher in a less safe plant resulting in fewer LERs than in another safer plant with a lower threshold of reporting. The more LERs there are, the more likely it is that an industry can be exposed to external attention concerning how the reported events are managed and eliminated which, in turn may further increase the safety of the plant. On the other hand, many or repeated LERs of a kind can also indicate a systematic safety weakness of a plant. It was interesting to find that the LERs from the different reactors were so different. This largely reflects differences in the status of the systems but part of the differences may also be a result of different reporting cultures.
Organizational factors are important for the safety of a nuclear plant. Weil and Apostolakis (16) identified the following organizational factors as important and related to safety: communication, formalization, goal prioritization, problem identification, roles and responsibilities and technical knowledge. It is obvious that LERs are related to this set of factors as they represent
communication concerning operating experience and risk. As mentioned above, in order to be effective, the LERs should be formalized to allow comparisons over time and between plants and the roles in relation to this information should be well defined to ensure proper reactions to this feedback. However, no definite conclusions can be drawn about organizational effectiveness from the LERs only, but the reports did not fully meet the requirement of effectiveness of
communication quality.
The present study treated the time after a first line failure condition appeared and the results invite further questions concerning other causes than the first line causes. Therefore, we intend to further investigate LER reports to find out how such causes are described in a forthcoming study. The present results also invites questions concerning the differences in event reporting between plants. The results of such an investigation could illuminate differences in both technology and organization at different plants and open for a discussion about how to improve these systems.
References
Baumont, G., Menage, F. & Bigot, F. (1997) A study of the recovery from 120 events. Institut de Protection et de Surete Nuclaire: Rapport IPSN/Departement d’évaluation de sureté No 327e. Baumont, G. (1999) Modele et méthode recuperare: Une méthode d’analyse des incidents intégrant la fiabilité humaine.. Institut de Protection et de Surete Nuclaire: Rapport IPSN/Departement d’évaluation de sureté No 371e.
Dawes, R. M. (1993) Prediction the future versus understanding the past: A basic asymmetry. American Journal of Psychology, 106, 1 - 24.
Hale, A., Wilpert, B. & Freitag, M. (1997) After the event: From accident to organizational learning. Oxford: Pergamon.
Hannaman, G.W.M Spurgin, A.J. & Lukic, Y.D. (1984) Human cognitive reliability model for PRA analysis. Nus-4531, EPRI, Palo Alto.
Hollnagel, E. (1998) Cognitive reliability and error analysis method - CREAM. Kidlington UK: Elsevier Science Ltd.
Hollnagel, E. (1999) Accident analysis and barrier functions. Lez Valenciennes, 28, 175 -180. Kouabenan, D. R., (1999) Explication naive de l’accident et prévention. Paris: Presse
Universitaires de France.
Lehtinen, E., Pulkkinen, U. & Pörn, K. (1997) Statistical trend analysis methods for temporal phenomena. SKI Report 97:10.
Leplat, J. (1995) Cause et risque dans l’analyse des accidents. Revue Roumain de Psychologie, 39, 9 - 24.
Leveson, N. G. (1995) Safeware: System safety and computers. .New York: Addison-Wesley. Lydell, B. (1998) Undetected latent failures of safety-related systems. SKI Report 98:11.
SKI (1998) Swedish Nuclear Power Inspectorate Regulatory Code. The Swedish Nuclear Power Inspectorate’s Regulations Concerning Safety in Certain Facilities. Stockholm: SKI. ISSN 1400-1187.
Svenson, O. (1991) The accident evolution and barrier function (AEB) model applied to incident analysis in the processing industries. Risk Analysis, 11, 499 - 507.
Svenson, O. (1999) On models of incidents and accidents. Lez Valenciennes, 28, 169 - 174. Svenson, O. (2000) Accident analysis and barrier function (AEB) method. SKI Report 00:6. Swain, A.D. & Guttman, H.E. (1983) Handbook of human reliability analysis with emphasis on nuclear power plant applications. NUREG/CR-1278, US Nuclear Regulatory Commission, Washington.
TUD (2000) T-boken version 5. Stockholm: TUD Swede power. ISBN 91-630-9862-8.
van der Schaaf, T. W. (1992) Near miss reporting in the chemical process industry. Ph D thesis, Eindhoven University of Technology.
Weil, R. & Apostolakis, G. (1999) Identification of important organizational factors using operator experience. Proceedings of the third International Conference on Human Factors Research in Nuclear Power Operations, Mihama, Japan, September 8 - 10, 1999.