Valter Petersell, Gustav Åkerblom, Britt-Marie Ek, Margit Enel, Voldemar Mõttus, Krista Täht
RADON RISK MAP OF ESTONIA
Explanatory text to the Radon Risk Map Set of Estonia
at scale of 1:500 000
SSI Report 2005:16
SGU Dnr. 08-466/2002
Tallinn – Stockholm 2005
EESTI GEOLOOGIAKESKUS Geological Survey of Estonia
2
ISBN 9985-815-55-6
© Geological Survey of Estonia, 2005 RADON RISK MAP OF ESTONIA
Explanatory text to the Radon Risk Map Set of Estonia at scale of 1:500 000
Authors: Valter Petersell, Gustav Åkerblom, Britt-Marie Ek, Margit Enel, Voldemar Mõttus, Krista Täht
Editorial office: Kadaka tee 82, 12618 Tallinn Tel. (372) 672 0094
Fax (372) 672 0091 E-mail egk@egk.ee
Editors:
Jaan Kivisilla, Research director, Geological Survey of Estonia Gustav Åkerblom, Senior geologist, Swedish Radiation Protection Authority
English text revision: Robert Szava-Kovats Layout: Mare Kukk
ABSTRACT
Radon Risk Map of Estonia has been produced to provide an overview of the concentration of the radioactive inert gas radon-222 in soil air and of the concentrations of uranium, thorium and potassium in the soil. The aim of the map is to serve as a tool in the effort to reduce the health risk posed by radon in dwellings and workplaces. The Radon Risk Map gives general information on areas where the risk for indoor radon merits attention at planning of new buildings for dwellings and workplaces. The map can also be used to aid in the search for existing buildings, in which the indoor radon concentrations may exceed the permissible limit. The map presented is preliminary; as research proceeds, the new results need to be incorporated. In this way the current areas of radon risk will be more precisely delineated.
The Radon Risk Map is based on existing geologic knowledge as well as results from field surveys conducted in 2002 and 2003. During the surveys, measurements of the radon concentration in soil air and gamma-ray spectrometric measurements were performed at 566 sites. These sites were chosen so to achieve a representative sampling throughout Estonia.
Geologic information was gathered from earlier geochemical surveys and from bedrock and Quaternary maps, including maps of airborne gamma-ray spectrometric surveys, which display the activity concentrations of radium-226 (226Ra), thorium-232 (232Th) and potassium-40 (40K) on the ground surface. Results from measurement of indoor radon concentrations in Estonian homes carried out by The Estonian Radiation Protection Centre (EKK) have also been included.
Radon was measured at least once with a Gammadata MARKUS-10 emanometer at each of the 566 sites. Soil air was sucked through a steel pipe from a depth of 0.8 m into the emanometer and analysed. At the same spot or within a few meters, a 0.8–1 m deep hole was dug for gamma spectrometric determination of the activity concentrations of 226Ra, 232Th and 40K. The maximum 222Rn activity concentration in the soil was calculated from the concentration of 226Ra.
The results of the radon risk surveys are reflected in a set of maps comprised of nine maps on 1:500 000 scale. Eight maps show the concentration of radon in soil air, the concentrations of uranium (226Ra), thorium and potassium in soil, as well as their major distribution. In accordance with Estonian standards, the Radon-222 Risk Map of Estonian Soil distinguishes areas classified as low radon ground (<10 kBq/m³), normal radon ground (10–50 kBq/m³), high radon ground (50–250 kBq/m³) and very high
radon ground (>250 kBq/m³). The concentration of radon in soil air in the high and very high radon areas
exceeds the limit established for unrestricted construction of new dwellings (50 kBq/m³), above which special measures have to be taken against indoor radon. The Preliminary Map of Radon Risk Areas in Estonia shows areas with different risks for radon. The classification of these areas is based mainly on the radon levels in soil air, but also considers soil permeability. This map distinguishes four risk classes: low
radon risk (≤10 kBq/m³), normal radon risk (10–50 kBq/m³), areas with local occurrences of high radon
ground (> 50 kBq/m³), and high radon risk (> 50 kBq/m³).
In the north Estonian Klint zone, the activity concentration of 226Ra in the soil exceeds the Guidance safety value in some localities (Order No. 12 of 2 April, 2004). Also the outdoor gamma radiation is often elevated in these localities.
4
CONTENTS
1. INTRODUCTION... 2. RADON (Rn)... 2.1. Basic information... 2.2. Radon in indoor air... 2.3. Inhaled radon and radon daughters constitute a health risk... 3. REGULATIONS AND GUIDELINES FOR RADON AND NATURAL RADIATION... 3.1. EU guidelines and recommendations... 3.2. Estonian regulations and guidelines... 4. BRIEF REVIEW OF NATURAL AND ECONOMIC CONDITIONS IN ESTONIA... 5. PREVIOUS INVESTIGATIONS... 6. PRINCIPAL GEOLOGIC FEATURES... 6.1. Crystalline basement and sedimentary bedrock... 6.2. Quaternary deposits... 7. METHODS... 7.1. Location of observation points... 7.2. Field measurements... 7.3. Data processing... 8. RADON RISK MAP SET OF ESTONIA... 8.1. Description of Radon Risk Map Set of Estonia... 8.2. Map Sheets 1.1–1.8. Radon-222 Risk Map of Estonian Soil... 8.3. Map Sheet 2: The Preliminary Map of Radon Risk Areas in Estonia... 8.3.1. Method for compiling Map Sheet 2... 8.3.2. Classification of areas used for Map Sheet 2... 8.3.3. Comparison between Map Sheet1.1 and Map Sheet 2... 9. RADON IN SOIL... 9.1. Distribution of radon in soil air... 9.2. Concentration of Radon in soil air obtained from direct measurements and calculated from the226Ra concentration... 10. NATURAL RADIONUCLIDES IN ESTONIAN SOILS, ACTIVITY CONCENTRATIONS... 10.1. Concentration of uranium as calculated from the 226Ra concentrations... 10.2. Concentration of thorium as calculated from the 232Th concentrations... 10.3. Concentration of potassium as calculated from the 40K concentrations... 10.4. Natural radiation... 11. MAJOR SOURCES OF RADON AND NATURAL RADIATION... SUMMARY... ACKNOWLEDGEMENTS... REFERENCES... APPENDIX:
Results of measurements and calculations... 6 10 10 12 12 14 14 16 17 19 21 21 23 27 27 27 30 34 34 34 36 37 37 38 39 39 47 50 50 53 54 54 55 57 59 60 64
MAPS:
Radon Risk Map Set of Estonia consists of the following nine Map Sheets: 1. RADON-222 RISK MAP OF ESTONIAN SOIL, SCALE 1:500 000
1.1. Maximum Radon Concentration in Soil Air (on this map are shown contoured areas of different radon concentration)
1.2. Radon (Rn) Concentration in Soil Air by Direct Measurement (in depth 1 m) 1.3. Radon Concentration in Soil Air calculated after eU (226Ra)
1.4. Uranium (226Ra) Concentration in Soil
1.5. Map of Factual Material [Location of Observation Points, On the Map of Quaternary Sediments (Kajak, 1999)]
1.6. Thorium (232Th) Concentration in Soil 1.7 Potassium (40K) Concentration in Soil 1.8. Natural Radiation of Soil
6
INTRODUCTION
Radon-222 (222Rn) is formed by the decay of radium-226 (226Ra). Radium-226 is formed in the decay series originating with uranium-238 (238U). Radon is a highly radioactive and carcinogenic inert gas that can cause cell mutations in organisms if inhaled or ingested. Next to smoking radon is the most significant cause of lung cancer in humans.
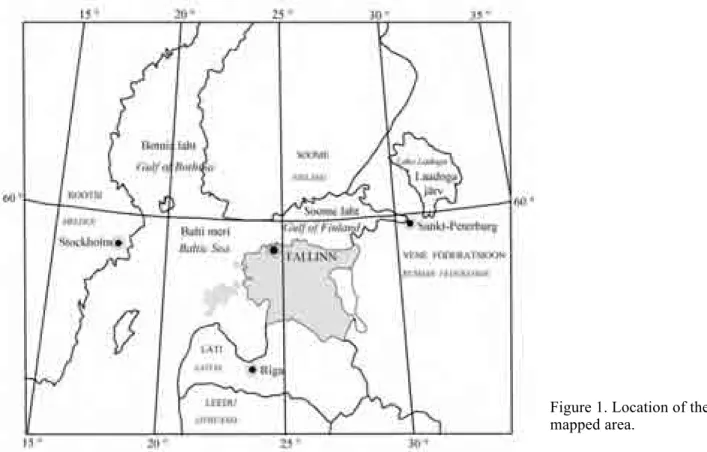
Estonia is located on the eastern coast of the Baltic Sea (Figure 1) and its territory covers 45.2 thousand km². Uranium-rich Lower Ordovician sedimentary rocks outcrop along the Klint1 in the northern part of Estonia. Fragments of these rocks occur in the soils throughout Estonia.
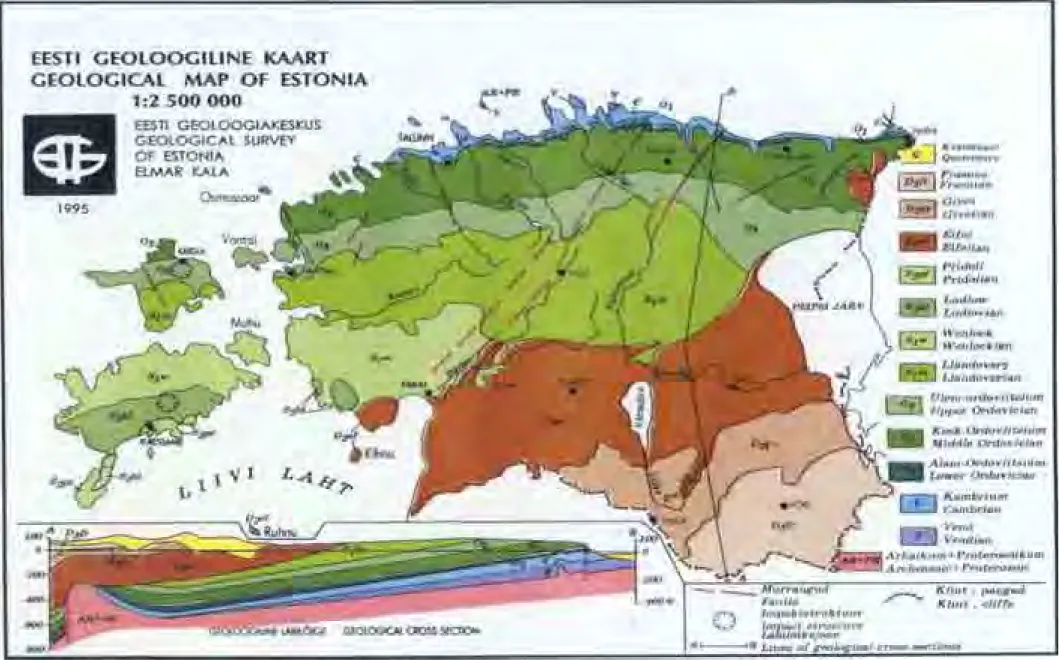
Bedrock units in Estonia with unusually high concentrations of uranium and radium are Dictyonema shale, phosphorite and Obolus sandstone (Figure 2). These rocks outcrop in the sandstone and limestone escarpment known as the North-Estonian Klint. Ordovician to upper Devonian sedimentary rocks overlie these older rock units. The concentration of uranium in these older rocks is near to the average concentration in the Earth’s crust (2.5 ppm U).
Geochemical mapping of Estonian soils reveals that the concentration of uranium exceeds 4–6 ppm in many areas. Research in Sweden indicates that in soils containing more than 4–6 ppm U, the concentration of radon in the soil air often exceeds 50 kBq/m3, the value above which requires safety measures against radon in new residential buildings or workplaces.
The map sheets of the Radon Risk Map of Estonian Soils provide an overview of the concentration of radon-222 in soil air and of the concentrations of uranium, radium (226Ra), thorium (232Th) and potassium (40K) in the soil. The Radon Risk Map of Estonian soils is based on existing geological, geophysical and geochemical data as well as surveys undertaken for this project. Information on geology was obtained from existing bedrock, Quaternary and geochemical maps. Additional information was gleaned from maps of gamma ray spectrometric airborne surveys carried out in 1990–1993 (Reðetov et al., 1993). These maps show the concentrations of 226Ra, 232Th and 40K at ground level. In addition, results from measurements of
1 Klint is the Scandinavian name of the sharp cliff along the northern coast of Estonia. The sequence of sediments
exposed in the Klint from bottom to top: Cambrian clays and sandstones, Lower Ordovician Obolus sandstone, Dictyonema shale and Ordovician limestone. Of these the Obolus sandstone contains layers of phosphorite, which contain uranium (10–30 ppm). The Dictyonema shale is a uranium-rich black shale (20–300 ppm U).
Figure 1. Location of the mapped area.
7
8
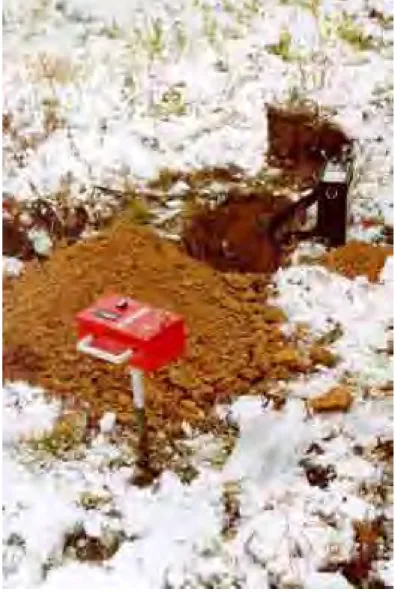
Figure 3. Margit Enel performing a gamma spectro-meter measurement. The detector unit is located in the plastic bag in the hole.
Figure 4. Measurement of radon in soil air with MARKUS-10.
After processing and systematisation, these mea-surements have been used to distinguish and identify soil types and regions with different radon con-centrations in soil air. In addition, the rationale for the different radon concentrations in the soil air has been studied.
Two types of Radon Risk Maps have been pro-duced. One map made at EGK, which is based on typical geochemical mapping principles in Estonia, and the other made at SGU, which is based on prin-ciples and methods developed in Sweden to map radon risk. The differences in methodology are described in the report. However, both maps agree in general on their delineation of areas of radon risk.
indoor radon concentrations in Estonian homes performed by Eesti Kiirguskeskus (Estonian Radiation Protection Centre, EKK) have been used to identify areas of different radon risks (low, normal, high or very high).
Field surveys were carried out during 2002 and 2003 in order to gain information on the ra-don concentration in the soil air. At these surveys measurements of radon and in situ gamma spectrometric measurements at 566 observa-tion points were carried out. These points were chosen to reflect a representative sampling of Estonia’s land territory. The concentration of uranium (226Ra), thorium (232Th) and potassium (40K) in soil was determined by gamma ray spectrometry in 80-cm-deep holes (Figure 3) and the concentration of 222Rn in soil air was sampled and analysed in the field with a Gammadata MARKUS-10 emanometer (Figure 4). The re-corded concentrations of 226Ra obtained by gamma spectrometry were used to calculate the maximum 222Rn concentration in soil air at the observation points.
The EGK map, in accordance with Estonian standards, depicts four levels of radon activity: low radon ground (<10 kBq/m3), normal radon ground (10–50 kBq/m3), high radon ground (50–250 kBq/m3), and very high radon ground (>250 kBq/m3). The SGU map features the following classification: low radon risk (<10 kBq/m3), normal radon risk (10–50 kBq/m3), high radon risk (>50 kBq/m3), areas with local occurrences of high radon ground and areas with karst.
The Radon Risk Map of Estonian Soil is supplemented with additional maps depicting the concentration of uranium (226Ra), thorium (232Th) and potassium (40K) in soil. Interpretation of these maps enables estimation of the variation of natural radioactivity of the soil throughout Estonia.
The explanatory text to the maps describes the concentration of 222Rn and U (226Ra), Th (232Th) and K (40K) of the main soil types. In addition, the reasons for high and very high concentration of radon in soil air are discussed and recommendations given on minimising the risk of radon exposure. The natural radioactivity of soil and related problems are described as well.
The Radon Risk Map is the result of a joint project between the Geological Survey of Estonia, the Swedish Radiation Protection Authority and the Geological Survey of Sweden. The Environmental Invest-ment Centre financed the work done by the Estonian partner, while the Swedish International DevelopInvest-ment Cooperation Agency provided funding for the activities of the Swedish partners.
Field investigations were carried out in 2002 and 2003 using equipment belonging to Swedish partners (Portable gamma ray spectrometer – 2 sets, and MARKUS-10 – 2 sets) and Estonian Radiation Protection Centre (Portable gamma ray spectrometer – 1 set and MARKUS-10 – 1 set). The normal course of work was hindered by early frosts and snow in the autumn of 2002 and a very moist summer in 2003.
Prior to fieldwork the Estonian partners visited Sweden for training in the use of the equipment and to learn the methodology used to map radon risk. The Swedish partners travelled to Estonia to participate in the fieldwork and to produce maps and reports.
The observation points were chosen to preferentially represent areas expected to have high radon concentrations in the soil air. These areas included the fore-Klint lowland and limestone plateau on top of the klint, ancient buried valleys, eskers, drumlins and tectonic fault zones, as well as other geological features with potential radon risk, e.g. buried karst, coastal ridges, and wastes of abandoned phosphorite quarries along the Klint zone at Maardu east of Tallinn.
The sampling density was very low, averaging 1 point per 70–80 km². Nevertheless, the surveys indicate that in Estonia there exist significant and distinct radon risk potential areas in Estonia. Areas with high radon concentration in the soil air are common in the North-Estonian Klint zone, but also occur in south-eastern and southern Estonia, and in other areas. Consequently, the nature of the research and sampling density led to a map at scale of 1:500 000. These maps together with this accompanying report are intended to serve as a preliminary review of the concentration of radon in the soil air and the distribution of natural radioactive elements – uranium, thorium and potassium in Estonian soils.
Despite the low sampling density, the results provide a preliminary demarcation of regions of different radon concentrations and identification of areas that require more in depth research.
The chemical analyses for this study were carried out at the Laboratory of the Geological Survey of Estonia and at Becquerel Laboratories Inc., Canada.
The fieldwork, data processing and map production was carried out by the authors listed on the title page. Office Technician Olga Rudõka also participated in the work.
The project leaders were Valter Petersell, Leader Geologist of the Geological Survey of Estonia, Gustav Åkerblom, Senior Geologist at the Swedish Radiation Protection Institute and Britt-Marie Ek, Geologist at the Geological Survey of Sweden.
10
2. RADON (Rn)
2.1. Basic information
Radon (Rn) is a decay product formed by the decay of radium (Ra) in the decay series of the radioactive elements, uranium and thorium (Table 1 and 2). Three isotopes of radon exist: radon-222 (222Rn) formed by the decay of radium-226 (226Ra) in the decay series of uranium-238 (238U), radon-220 (220Rn) also called thoron, formed by the decay of radium-224 (224Ra) in the decay series of thorium-232 (232Th), and radon-219 (219Rn) called actinon formed by the decay of radium-223 (223Ra) in the decay series of uranium-235 (235U). The half-life of 238U is 4.468 109 years, of 226Ra – 1620 years and of 222Rn – 3.82 days.
Natural uranium (U) consists of three isotopes – 238U constituting 99.27% of all U, 235U, forming 0.72% and 234U forming 0.005%. Most thorium (Th) exists as 232Th, but thorium isotopes are also formed in the decay series of 238U (234Th and 230Th) and 235U (231Th and 227Th).
The radon isotope that presents the greatest health hazard is 222Rn (Table 1). As the half-life of thoron (220Rn) is only 55.6 seconds (Table 2), thoron constitutes only a small part of the natural radon in the above ground atmosphere. The portion of actinon (219Rn) is very small for two reasons. Firstly, the concentration of 235U is low, and secondly, the half-life of 219Rn is very short (3.92 seconds). Thus, the radioactivity resultant from 222Rn is the major contributor to the radiation dose received by exposure to radon gas in dwellings, workplaces and underground premises (UNSCEAR, 1993). References to radon in this text refer to 222Rn.
The average concentration of radium and radon in the Earth’s crust is n • 10-6 ppm Ra and n • 10-10 ppm Rn respectively (Ivanov, 1996). Under natural conditions the uranium/radium/radon ratio in Palaeozoic rocks is normally constant1. Therefore, transition coefficients can be applied to determine the concentration of an element on the basis of the concentration of another element. When young sediments such as Quaternary deposits are formed and rocks are weathered, the different chemical properties of uranium and its radioactive decay elements (daughters) provide for different means of migration. Under different pH level, electric conductivity and aeration conditions these elements also dissipate or concentrate in different ways. At the same time, due to the short half-life of radon, the Ra/Rn ratio in soils is generally stable and balanced as long as the radon gas concentration is not reduced by ventilation nor by radon escaping by diffusion.
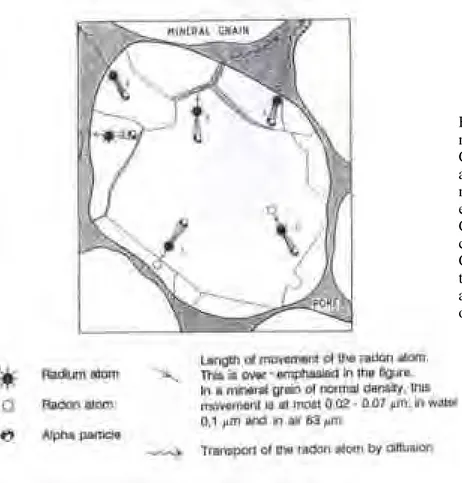
Radon is an inert gas with a density of 9.73 kg/m3 (7.7 times heavier than air). Upon the decay of the radium atom in a mineral grain, the resultant radon atom is expelled from the mineral lattice by the recoil effect from the emitted alpha particle (Figure 5). The distance of transport by the recoil effect in minerals of normal density is 0.02–0.07 µm and 64 µm in water. If a radium atom is situated near the surface of a mineral grain or a micro-crack in a grain, the newborn radon atom may reach a pore space. This transport of radon atoms from grains to pore spaces is known as emanation. The partition of radon atoms that emanates to the pore space in a soil depends to a large degree on grain size, but also on the distribution of radon atoms in different grains and on the moisture in the soil. Thus, the emanation factor is low when the water content of the soil is low (less than 5%) and increases as the water content increases. Under normal conditions, the emanation factor for gravel is 15–40%, for sand 15–30% and for clay 30–70%. (For more detailed information on emanation, see Åkerblom and Mellander, 1997.).
Subsequent transport in soil of radon atoms from pore spaces occurs by diffusion or by active transport by moving air or water. In a soil layer with a homogenous radium concentration, the concentration of radon in soil air is greatest at a depth of 2 m and below. At this depth the emitted and decaying radon atoms are in equilibrium. The radon concentration at depths <2 m is reduced by diffusion of radon to the atmosphere above the ground surface or by ventilation effects due to wind. The nearer to the ground surface, the better the soil air is aerated, enhancing radon migration into the atmosphere. The radon flux from the ground surface is known as exhalation.
However, if the pore spaces in soil air are filled with water (i.e. below the groundwater level) radon gas can escape from only the 6 upper centimetres of the water (the maximum diffusion distance for radon in water before it decays totally). Thus the radon concentration in ground water in a soil is constant and depends on the radium concentration in the soil and the emanation factor of the soil.
1 At radioactive equilibrium within the 238U decay series, the rate of 238U decay is the same as for each subsequent
Decay series of uranium-238 (238U)
Decay series of thorium-232 (232Th)
Table 1
Table 2
Radioactive Radiation
half-life Type
Uranium -238 (U) 4.5x10⁹ years α Solid
Thorium -234 (Th) 24.1 days β Solid
Protactinium-234 (Pa) 1.17 minutes β Solid
Uranium-234 (U) 2.24x10⁵ years α Solid
Thorium-230 (Th) 8.0x10⁴ years α Solid
Radium-226 (Ra) 1620 years α Solid
Radon-222 (Rn) 3.823 days α Gas
Polonium-218 (Po) 3.05 minutes α Solid
Lead-214 (Pb) 26.8 minutes β, γ Solid
Bismuth-214 (Bi) 19.7 minutes β, γ Solid Polonium-214 (Po) 1.6x10⁻⁴ seconds α Solid
Lead-210 (Pb) 21.3 years β Solid
Bismuth -210 (Bi) 5.01 days β Solid
Polonium-210 (Po) 138.4 days α Solid
Lead-206 (Pb) - - Solid
Isotope Notes
Radioactive Radiation
half-life type
Thorium-232 (Th) 1.41x10¹⁰ years α Solid
Radium-228 (Ra) 5.76 years β Solid
Actinon-228 (Ac) 6.13 hours β, γ Solid
Thorium-228 (Th) 1.913 years α, γ Solid
Radium-224 (Ra) 3.66 days α, γ Solid
Radon-220 (Rn) 55.6 seconds α
Gas, also known as
thoron
Polonium-216 (Po) 0.15 seconds α Solid
Lead-212 (Pb) 10.64 hours β, γ Solid
Bismuth-212 (Bi) 60.6 minutes α, β, γ Solid Polonium-212 (Po) 3.4x10⁻⁷ seconds α Solid Thallium-208 (Tl) 3.05 minutes β, γ Solid
Lead-208 (Pb) Solid
12
Figure 5. Principles of radon emanation from mineral grains (Åkerblom et al., 1988). Case 1.When radium decays, a radon atom and an alpha particle are formed. The radon atom migrates into an adjacent crystal by a recoil effect from the ejected alpha particle.
Case 2.The radon atom migrates through the crystal.
Cases 3 and 4.The radon atom migrates from the crystal to a micro-fissure or the gas in an adjacent pore. Further transport is assumed to occur by diffusion.
2.2. Radon in indoor air
Almost all buildings are affected by radon that leaks in and mixes with the indoor air from under lying ground. Radon is either transported together with soil air, in which case the soil air is actively drawn into the building through cracks, joints and holes in the foundation by the stack effect caused by the pressure difference between indoor and outdoor atmosphere, or by diffusion through the upper soil layer and the floor/concrete slab laying on the ground or above the crawl space. The leakage of radon into most buildings results in low indoor radon concentrations (<50 Bq/m3) only, but if the volume of incoming soil air is greater than 1–5 m3/ h or if the radon concentration in the soil air is high (>50,000 Bq/m3), indoor radon concentrations greater than 200 Bq/m3 often result. (The maximum annual indoor radon concentrations so far measured in Estonia is 12,000 Bq/m3.)
2.3. Inhaled radon and radon daughters constitute a health risk
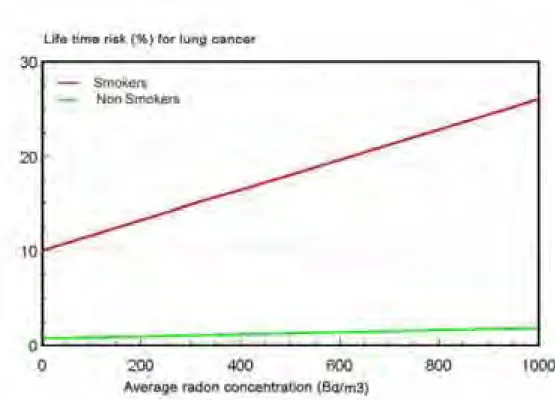
As mentioned before, radon is highly radioactive and carcinogenic, and second to smoking the main cause of lung cancer. Radon decays into a number of radioactive elements (daughters) until the formation of stable 206Pb (Table 1). Of these daughters 218Po and 214Po decay by alpha radiation. When inhaled these daughters adhere to the epithelium in the lungs. The emitted alpha radiation can damage the epithelium cells and their chromosomes. This cell damage can result in cancer, the risk being related to the duration of exposure and the concentration of radon. Smokers exposed to radon run a multiplicative risk for lung cancer (Figure. 6) (Mjönes and Falk, 2002; Darby et al., 2004).
Figure 6. Lifetime risk of lung cancer as a result of exposure to radon gas. Calculated from a relative increased risk of 16% per 100 Bq/m3 (Mjönes and Falk, 2002).
14
3. REGULATIONS AND GUIDELINES FOR RADON AND NATURAL RADIATION
3.1. EU guidelines and recommendations
Due to the hazardous effect on human health caused by radon and especially by its daughters it became inevitable to establish limits or guidelines for maximum permissible radon gas concentrations of indoor air in residential buildings and workplaces. In most European countries the limits or highest recommended radon concentration is 200 Bq/m3 for new residential buildings and 200–400 Bq/m3 for existing buildings (Åkerblom, 1999).
The European Commission published in 1990 a specific recommendation for exposure to radon in dwellings (EC, 1990). Although the dose conversion from annual average radon concentration to effective dose is based on earlier recommendations from the International Commission on Radiological Protection (ICRP) (Publications 50, 1987; 60, 1990 and 65, 1965) the recommended action level for existing buildings (400 Bq/m3) and the planning level for future constructions (200 Bq/m3) are still regarded as applicable by the Commission.
In 1996, the European Council adopted a revised European Basic Safety Standards Directive (EU BSS, Directive 96/29/Euratom laying down basic safety standards for the protection of the health of workers and the general public against the dangers from ionising radiation) (EC, 1996). The EU BSS directive is based on the general recommendations in ICRP Publication 60 regarding practices and intervention. The EU BSS states: “shall not apply to exposure to radon in dwellings or to the natural level of radiation, i.e. to radionuclides contained in the human body, to cosmic radiation prevailing at ground level or to aboveground exposure to radionuclides present in the undisturbed earth’s crust”. The EU BSS Directive gives the Member States a high degree of flexibility in implementing the articles on natural radiation sources into national legislation.
On request by the European Commission the Group of Experts established under the terms of Article 31 of the Euratom Treaty has given guidance for radon and natural radiation at workplaces (EC, 1997). In parts these guidance also apply to the exposure of the public. The Commission recommend the National Authorities of the Member States to “undertake surveys to determine the scale and nature of radon exposures” and to perform “control of domestic as well as occupational exposures”. It also stresses the “use of defining radon prone areas”.
A review of the situation in Scandinavia has been published in Naturally Occurring Radioactivity in the Nordic Countries – Recommendations (Naturally…, 2000).
Since 2002 the Swedish compulsory limits are 200 Bq/m3 for indoor radon in existing and new dwellings, schools, day-care homes and other public access buildings and 400 Bq/m3 in workplaces. If the limit is exceeded the owner of the building or the employer can be forced to remediate the situation to reduce radon concentrations to below the limit.
In Russia the limit for the radon daughter activity concentration is 100 Bq/m3 in new buildings and 200 Bq/m3 in existing dwellings (Assuming an F-factor of 0.5, 100 Bq/m3 corresponds to a radon concentra-tion of 200 Bq/m3 and 200 Bq/m3 to 400 Bq/m3) (Gigienièeskie …, 2003). A recommended action limit of 150 Bq/m3 has been established for both new and existing dwellings and schools in USA (EPA, 1992).
Recommendations for building materials
Building materials made of soil or rock emit gamma radiation and radon. Both gamma radiation from building materials and radon exhaled from building material will contribute to the dose received by those living or working in the buildings.
The Group of Experts established under the terms of Article 31 of the Euratom Treaty has also provided guidelines on natural radioactivity in building materials (EC, 1999). These guidelines give the following basic recommendations:
(17) The amount of radium in building materials should be restricted at least to a level where it is unlikely that it could be a major cause for exceeding the design level for indoor radon introduced in the Commissions Recommendation (200 Bq/m3).
(18) Within the European Union, gamma doses due to building materials exceeding 1 mSv a-1 are very exceptional and can hardly be disregarded from the radiation protection point of view. When gamma doses
are limited to levels below 1 mSv a-1, the 226Ra concentrations in the materials are limited, in practice, to levels, which are unlikely to cause indoor radon concentrations exceeding the design level of the Commission Recommendation (200 Bq m-3).
(19) Controls on the radioactivity of building materials can be based on the following radiological criteria and principles:
a) Dose criterion for controls
Controls should be based on a dose criterion, which is established considering overall national circumstances. Within the European Union, doses exceeding 1mSv a-1 should be taken into account from the radiation protection point of view. Higher doses should be accepted only in some very exceptional cases were materials are used locally (see Paragraph 30). Controls can be based on a lower dose criterion if it is judged that this is desirable and will not lead to impractical controls. It is therefore recommended that controls should be based on a dose in the range 0.3 – 1 mSv a-1. This is the excess gamma dose to that received outdoors.
b) Exemption level
Building materials should be exempted from all restrictions concerning their radioactivity if the excess gamma radiation originating from them increases the annual effective dose of a member of the public by 0.3 mSva-1 at the most. This is the excess gamma dose to that received outdoors.
(20) Separate limitations for radon or thoron exhaling from building materials should be considered where previous evaluations show that building materials may be a significant source of indoor radon or thoron and restrictions put on this source is found to be an efficient and a cost effective way to limit exposures to indoor radon or thoron.
(21) Investigation levels can be derived for practical monitoring purposes. Because more than one radionuclide contribute to the dose, it is practical to present investigation levels in the form of an activity concentration index. The activity concentration index should also take into account typical ways and amounts in which the material is used in a building. The following activity concentration index (I) is derived for identifying whether a dose criterion is met:
I = CRa/ 300 + CTh/200 + CK/3000
where CRa, CTh, CK are the radium, thorium and potassium activity concentrations (Bq kg-1) in the building material. The activity concentration index shall not exceed the following values depending on the dose criterion and the way and the amount the material is used in a building:
(22) The activity concentration index should be used only as a screening tool for identifying materials, which might be of concern. Any actual decision on restricting the use of a material should be based on a separate dose assessment. Such assessment should be based on scenarios where the material is used in a typical way for the type of material in question. Scenarios resulting in theoretical, most unlikely maximum doses should be avoided.
The Scandinavian Radiation Protections Authorities recommend that the use of building materials should be restricted if the concentration of 226Ra in the produced building material exceeds 100 Bq/kg. (Naturally..., 2000). Therefore, soil (sand, gravel, clay, etc.) or rock materials should be restricted if their use results in a concentration of 226Ra in the building material in excess of 100 Bq/kg.
Dose criterion 0.3 mSva-1 1 mSva-1
Materials used in bulk amounts, e.g. concrete
I ≤ 0.5 I ≤1 Superficial and other materials with
restricted use: tiles, boards, etc
16
3.2. Estonian regulations and guidelines
The Estonian limit for new buildings is 200 Bq/m3 (Radooniohutu..., 2003); no limit has yet been emplaced for existing buildings.
In accordance with Estonian standards, sites for construction of new buildings for dwellings and workplaces are classified as low radon ground (<10 kBq/m³), normal radon ground (10–50 kBq/m³), high
radon ground (50–250 kBq/m³) and very high radon ground (>250 kBq/m³) (Radoooniohutu…, 2003).
According to the Estonian regulations, the limit of radon in the soil air at 1 meters depth is 50 kBq/m3 (Radooniohutu..., 2003). Construction of residential buildings and workplaces in areas where the radon level exceeds 50 kBq/m3 require remedial action against radon in-leakage.
According to Estonian Building regulation no. 55 of the Minister of the Environment, 24 August 1998 (Looduskiirgusest…, 1998), the maximum permissible index value C for natural radioactive elements in soils or rocks used for building materials in Estonia shall not exceed 1. The requirements for materials in playgrounds are less strict (2.5 times on average), consequently C for the building materials (soils) of playgrounds must not exceed 2.5. Paragraph 5 of the regulation states: “Licensee or other entrepreneur shall perform the monitoring and assessment of public dose and inform the ERPC when the specific activity index C of the used material exceeds the established value”. For different use of material different values of C are used, e.g. for building material C ≤ 1.
The C index may be used by residents to assess the natural radiation level where they live. The index also indicates the natural radioactivity of e.g. sand, clay and gravel and other rock materials that may be unsuitable for use as building material for dwellings and workplaces.
The C index for building materials used for dwellings and occupational buildings is calculated by the following formula (activity concentration of elements in Bq/kg):
C = 226Ra/300 + 232Th/200 + 40K/3000 ≤ 1, where
C – the maximum permissible index for natural radioactive elements in building materials and the activity concentrations of the elements is in Bq/kg.
The C index for materials or ground used for playgrounds is: C = 226Ra/700 + 232Th/500 + 40K/8000 + 137Cs/2000 ≤ 1 Note
1 mg U /kg is equivalent to12.3 Bq 226Ra/kg (when in the uranium-238 series there is radiation equilibrium between 238U and 226Ra); 1 mg Th /kg to 4.0 Bq 232Th/kg; 1% K = 313 Bq 40K/kg. It is noteworthy that if 226Ra and uranium are
naturally balanced the concentration of uranium in the building materials for houses can exceed 20 ppm U and in the building materials for playgrounds – 50 ppm U, which exceeds the recommended and maximum permissible concentration established for the residential areas (Pinnases…, 2004).
4. BRIEF REVIEW OF NATURAL AND ECONOMIC CONDITIONS IN ESTONIA
Estonia is located on the eastern coast of the Baltic Sea and can be divided into mainland Estonia and the West-Estonian Archipelago. Estonia borders the Gulf of Finland to the north, the Baltic Sea and Gulf of Livonia to the west, and from the east the Narva River, the depression of Peipsi and Pihkva lakes and the Russian Republic to the east. The southern border of Estonia with the Republic of Latvia features no notable geographic features. Estonia occupies 45.2 thousand km², of which mainland Estonia covers 41.1 thousand km².
Post-glacial tectonic movement causes north-western Estonia to rise up to 3–3.5 mm per year and south-eastern Estonia to drop up to 1 mm per year. The approximate axis between these regions runs northeast to southwest and coincides roughly with a Pärnu–Narva transect (Garetsky et al., 1995).
Estonia is generally low-lying, mostly 30–80 m above sea level. Northern Estonia consists of an extensive undulating or hummocky limestone plateau. The northern edge of this plateau forms an abrupt escarpment known as the Klint. The Klint achieves its maximum altitude (56 m above sea level) in north-eastern Estonia. A fore-Klint lowland of variable width exists between the Klint and sea, but in a number of localities to the east of Aseri (north-eastern Estonia) and to the west of Tallinn the fore-Klint lowland is absent and the sea borders the foot of the Klint. The highest part of the limestone plateau is the Pandivere Upland, characterised by undulating or hummocky areas that rise 80–120 m (maximum 166 m) above sea level. South and west of the upland is the Central Estonian plain, which falls towards the west and gradually merges into the West-Estonian and Pärnu coastal plains. Both open and buried karst is common on the Pandivere upland, North-Estonian (Harju) limestone plateau, as well as in other parts of the North-Estonian Plateau. Karst occurs also on Saaremaa and Hiiumaa islands. To the east of the Pärnu Lowland, in southern Estonia, the Sakala, Otepää and Haanja uplands are separated by depressions. The ground surface is undulating or irregular, often hummocky with steep slopes and depressions. The highest hills in these uplands are Rutu (146 m), Kuutse (217 m) and Suur Munamägi (318 m), respectively. Towards the eastern boundary of Estonia the hummocky relief gradually merges into the Peipsi Lowland.
River water is the main agent transporting humus and mineral grains, as well as elements and their compounds, including uranium, thorium, their daughter isotopes and potassium. Data on uranium and thorium concentration in the water of Estonian rivers are incomplete or missing. ICP-MS analyses incorporated in the Geochemical Atlas of Europe (2005) show that the concentration in river water (total two streams with catchments areas 30–90 km²) of U and Th are 0.55–4.58 µg/l and 0.07–0.026 µg/l respectively.
Estonia contains a total of 7378 rivers, brooks and large ditches. These water bodies total 31,153 km in length. The large ditches all intersect the humus horizon and underlying soils to a depth of at least 2 m. The rivers within the Lake Peipsi and Gulf of Livonia–Väinameri catchments originate on the slopes of Pandivere uplands, meander through their middle and lower course and their river valleys are paludified. In these areas the soil is often saturated. The previously mentioned tectonic uplift enhances paludification. The rivers within the Gulf of Finland catchment originate on the North-Estonian limestone plateau, often from springs. Upon crossing the klint escarpment, these rivers commonly cut into the bedrock and form V-shaped valleys, rapids and low waterfalls.
Estonia contains about 1200 natural and artificial lakes with an area of 1 hectare or more. These lakes and large bog pools cover approximately 2130 km². These lakes serve as sedimentary basins into which the rivers, brooks and ditches transport both solid and dissolved material.
Forests constitute approximately one third of Estonia’s land area and mires cover about ten thousand square kilometres (22.3% of land area). The 48 largest mires have an area greater than 30 km², of which 11 mires cover more than 100 km². Puhatu mire, the largest in Estonia, has an area of 570.8 km² (Orru, 1995). Mires are found mostly in the Alutaguse region (north-eastern Estonia), southern part of the Central-Estonian Limestone Plateau, Pärnu Lowland and northern part of the Lake Võrtsjärv depression. These mires have received considerable amounts of uranium and other heavy materials from flowing waters or springs (Orru and Orru, 2003).
Estonia is located in the temperate climatic zone and the Atlantic-continental sub-zone. The Baltic Sea casts considerable influence on the climate. The average annual temperature is +3.7 to +6 oC and the average annual precipitation is 550–800 mm. The annual precipitation is at least twice the annual average evaporation. Sandy soil can freeze down to a depth of about 1 m.
18
Mining of Estonia’s major minerals occurs in north-eastern Estonia: the areas where oil shale and limestone (raw material for cement production) are excavated constitute almost 4600 km² and as a result, the natural mineral and chemical composition of the soils has been altered considerably. Tailings of materials from oil shale mining and processing currently cover almost 191 km² and this area is expanding (Kattai et al, 2000). The uppermost 5–6 m (in places even more) of natural soils or rocks has been excavated and mixed with materials from underlying beds in quarries from which raw material for producing building materials, glass, and other products is extracted.
At the Sillamäe town there are huge waste dams containing waste from uranium production from the Dictyonema shale and uranium ores brought to Estonia for refining during the Soviet era. Refining of rare earth elements, niobium and tantalum from imported ores continues in Sillamäe. Attention should be paid in the future to the depository of the waste from this enterprise as the waste contains radioactive material.
5. PREVIOUS INVESTIGATIONS
The radon issue is relatively recent; it first received attention in the 1950–1960s when high concen-trations of radon gas was identified as a cause of lung cancer in miners working in uranium mines in USA. In recent decades various aspects of the hazardous affects of radon gas on human health have been investigated thoroughly in Sweden (Mjönes, 1991; Pershagen, Åkerblom et al., 1993), and other Nordic countries (Naturally..., 2000), USA (Gundersen, 1991), Czech Republic (Mikðova and Barnet, 2002) etc. Research in the Czech Republic has indicated that a rise in radon gas concentration of 100 Bq/m3 above the permissible concentration (200 Bq/m3) increases the risk of lung cancer 9–15% and more (Mikðova and Barnet, 2002). Radon is especially hazardous to smokers (Figure 6).
The main source of indoor radon is radon transported from the ground by soil air. Therefore, understanding of the concentration of radioactive elements – above all uranium – in rocks and soils is the principle means by which to identify radon prone regions, areas and sites. Investigations to determine the concentration of uranium and thorium in the bedrock of Estonia began immediately after World War II with studies of the Dictyonema shale (Pakerort Stage, Lower Ordovician) and phosphorite (to lesser extent). As a result of these investigations, the Sillamäe region was deemed a suitable area to refine uranium (in this area the average concentration of uranium in Dictyonema shale is 300 ppm). However, the results of these investigations are missing from the Depository of Manuscript Reports of the Geological Survey of Estonia. Extensive, but often indirect, investigations of radon in soils and bedrock began in 1958 in association with geological mapping at scale of 1:200 000. These studies included measurements of the natural gamma-radiation levels in soils and bedrock (in boreholes). Rock samples were collected, which were analysed for uranium and thorium, in areas with enhanced radiation levels. Estonian uranium deposits were deemed nonviable in the 1960s, but investigations continued irregularly until the beginning of the 1970s.
Analyses of the bedrock concentration of uranium and thorium became obligatory in the 1970s and continued until 1990. The level of natural radiation in almost all boreholes was measured by gamma-ray logging, and the concentration of uranium and thorium was determined in samples collected from the sections with enhanced natural radiation levels. This analysis led to the identification of elevated uranium concentrations in some dark-coloured clay-rich varieties of Devonian sedimentary rocks in southern Estonia. In conjunction with prospecting for phosphorite deposits, determination of uranium and thorium concentrations in the Dictyonema shale and phosphorite was ubiquitous during 1972–1986.
Investigations specifically aimed to determine the concentration of uranium, thorium and potassium in Estonian soils began in 1985 in conjunction with systematic geochemical mapping of the topsoil and subsoil. The concentration of uranium, thorium and potassium was determined in 860 samples collected during 1985–1986. These samples were extracted from the sides of 1–1.2 m deep excavations; samples were collected from the A-horizon (the upper humus rich 10-30 cm thick soil layer) and the C-horizon (below a depth of 60 cm) (Petersell et al., 1997; 2000). This survey revealed that the concentration of uranium exceeded 4–5 mg/kg in 20–30% of the samples. The Swedish Radiation Protection Authority suggests an increased potential for enhanced radon concentrations in the soil air at such uranium levels (Åkerblom, 1994).
Indoor radon was first measured in 1985–1990 in the basements or on the ground floor of dwellings (Naumov, 1993). In 1995 the Estonian Radiation Protection Centre started systematic investigations in cooperation with the Swedish Radiation Protection Authority. To date, almost 1475 measurements of indoor radon have been made in single-family and multi-family residences. The results have revealed very variable indoor radon concentrations (Pahapill, 2000; Pahapill et al, 2003). The radon concentration is often elevated in ground-floor homes and apartments, and in some counties and municipalities, radon levels exceeded the maximum permissible concentration (200 Bq/m3) in35–72% of the analyses. In several homes the radon concentrations measured 800 to more than 1000 Bq/m3 with a maximum concentration of 12,000 Bq/m3. These measurements – taken in randomly selected dwellings – place Estonia third among European countries for the highest radon levels (following Finland and Sweden).
These indoor radon measurements underline the necessity for determination of radon concentration in Estonian soils to be a criterion for environmental assessment.
The first measurements of radon in soil air in Estonia were carried out by EKK with the equipment of and in co-operation with the Swedish Radiation Protection Authority. The highest radon concentration
20
measured at the time was 2.5 million Bq/m3 in a soil consisting of Dictyonema shale fragments in Sillamäe (Pahapill, 2000).
The first map depicting radon risk areas was based on the confines of Dictyonema shale and phosphorite outcrop areas (Raudsep and Samuel, 1999).
6. PRINCIPAL GEOLOGIC FEATURES
Estonia is located in the north-western part of the East-European platform in an area bordering the Fennoscandian (Baltic) Shield, where the Earth’s crust consists of three complexes of variable composition: Proterozoic crystalline basement, which is overlain by Vendian and Palaeozoic sedimentary bedrock and unconsolidated Quaternary deposits. The latter comprises the crushed, ground and weathered fragments of both sedimentary and crystalline rocks.
6.1. Crystalline basement and sedimentary bedrock (Figure 2)
The crystalline rocks influencing the mineral and chemical composition of Estonian soils lie directly under the Quaternary cover in the central and northern Gulf of Finland, in southern and central Finland, on the bottom of the Baltic Sea and elsewhere on the Fennoscandian Shield. These rocks consist of shales, gneisses and intrusive rocks of variable mineral and chemical composition, from acid to ultrabasic and including alkaline rocks. Granitoids rich in uranium, thorium and potassium often underlie the Quaternary deposits in southern Finland and southern Karelia (The Geochemical..., 1992). Among these granitoids, Rapakivi granites have the greatest influence on the concentration of radon in Estonian soils.
In the southern part of the Gulf of Finland and throughout Estonia the crystalline basement is overlain by Vendian and Palaeozoic sedimentary rocks (Figure 7). These formations are sub-parallel beds that dip slightly southward (ca 3 m per km) with west–east orientated belts, whereby the oldest rocks occur in the north and increasingly younger rocks gradually follow towards the south. The thickness of the sedimentary cover increases southwards reaching approximately 600 m in southern Estonia. This fairly uniform bedding is displaced by low-amplitude tectonic faults, such as the Viivikonna, Aseri and Tapa faults, residual uplift of the crystalline basement near Uljaste and Assamalla, the Mõniste and Lokno tectonic uplifts, and impact craters, such as Kärdla (ca 4 km in diameter) and the much smaller Kaali and Ilumetsa impact craters (Geology..., 1997).
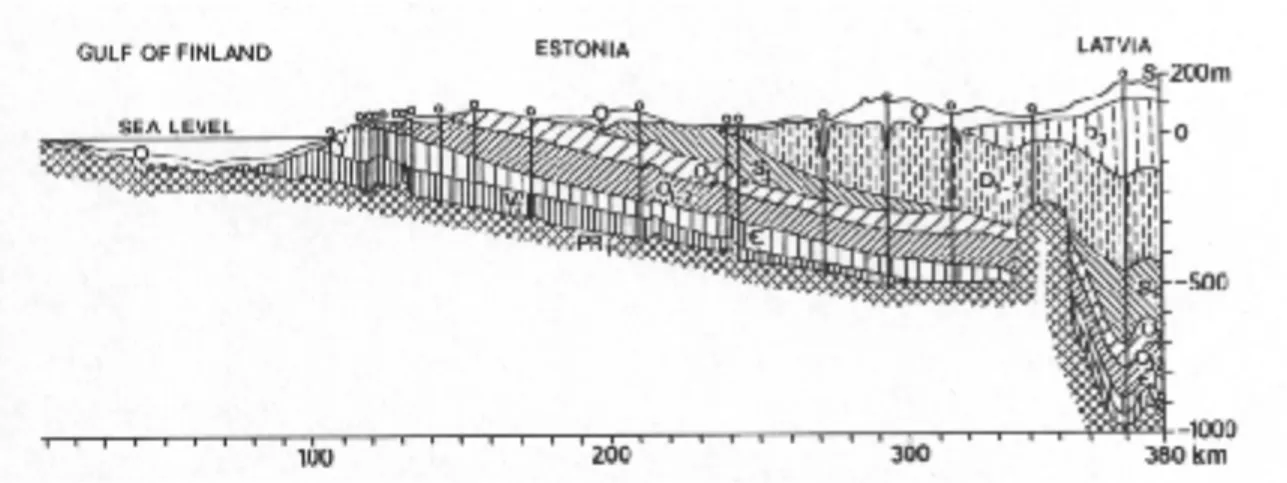
Figure 7. N-S cross-section from the Gulf of Finland through Estonia to north Latvia along a profile of deep boreholes. PR1, Paleoproterozoic crystalline basement; V3, Upper Vendian; ª,Cambrian; O1-2, Lower and Middle Ordovician; O3, Upper Ordovician; S1, Silurian; D1-2, Lower and Middle Devonian; D3, Upper Devonian; Q, Quaternary [5].a
Vendian and Cambrian clays, siltstones and sandstones lie directly on the crystalline basement. The thickness of these formations in the North-Estonian outcrop area decreases from 160–180 m in the east to 110–130 m in the west. These deposits were deposited in shallow seas and consist mainly of quartz, feldspars, mica and clay minerals – kaolinite, illite and some chlorite and montmorillonite. Carbonates, if present, are uncommon (Viiding et al., 1983). Minerals rich in uranium and thorium occur irregularly, mainly as varieties resistant to weathering (zircon, monazite, xenotime and apatite).
22
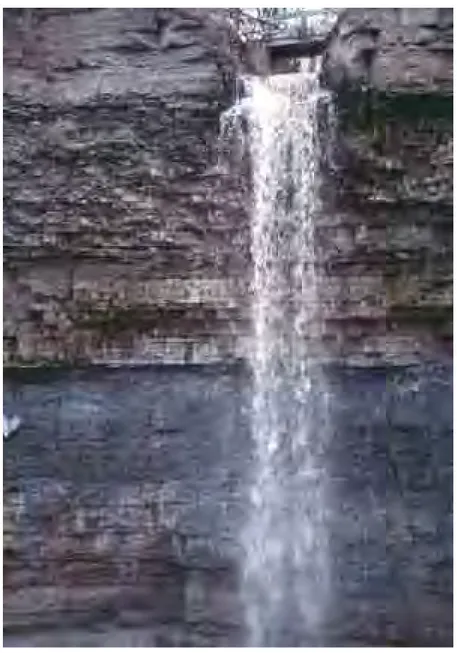
Lower-Ordovician rocks (Obolus sandstone, phosphorite, Dictyonema shale, clay and glauconite sandstone lie discordantly on the Cambrian sedimentary rocks. These form the Lower-Ordovician terrigenous complex and outcrop in the Klint escarpment (Figure 8) and in valleys cutting the limestone plateau. Their outcrops occur along the entire Klint from Paldiski to Narva and on the sea floor west of the Pakri Islands. Some formations of the Lower-Ordovician complex – Dictyonema shale and Obolus sandstone (phosphorite) – are typically rich in uranium, potassium and a number of other trace elements (Loog and Petersell, 1994; Petersell, 1991). Ordovician and Silurian carbonate rocks (limestones, dolomites, marlstones and domerites) either underlie the Quaternary cover or lie directly on the ground surface south of the Lower-Ordovician outcrop area from Navesti to Mustvee. The oil shale (kukersite) beds, which form the Estonia and Tapa deposits, are parts of the Middle-Ordovician Uhaku and Kukruse stages. All these formations are shallow sea deposits.
Figure 8. The Klint escarpment at the Valaste waterfall. From top to bottom: Ordovician limestone, Dictyonema shale (black), Obolus sandstone with phosphorite.
Devonian sandstones and siltstones, with occasional clays, underlie the Quaternary cover or outcrop in a few localities south of Navesti–Mustvee line in southern Estonia. Marlstones of the Narva stage outcrop irregularly on the western bank of the Narva River and as a narrow belt in central Estonia, and dolomite, domerite and dolomitised sandstone is distributed in south-eastern Estonia. The Devonian sedimentary rocks consist primarily of quartz, feldspars, micas, illite, and less commonly kaolinite and chlorite. The sandstones poor in clay minerals are often enriched with zircon and orthite, monazite, apatite and Fe-minerals.
The Devonian marls were deposited primarily in shallow coastal waters or in lagoons, and the carbonates in shallow seas. Sandstones, siltstones and clays are usually red, laminated and cross-bedded (Rõõmusoks, 1983). The colour formed during sedimentation when colloidal ferric hydroxides precipitated from the percolating water (Viiding, 1961). These rocks are typical of riverbeds, deltas, lakes and shallow near shore seas. They were transported to the depositional area from the Caledonides in northern Scandinavia and from the Fennoscandian Shield.
The average concentrations of major and trace elements in the rocks of the Fennoscandian Shield approximate the average concentrations in the Earth’s crust. Except for the Lower-Ordovician Tremadocian complex, the major and trace element content in Estonian bedrock has been inadequately studied. However, given its mineral composition and the results of mineral exploration, the average elemental abundance likely approximates those calculated globally for clays, sandstones or carbonate rocks, respectively (Turekian and Wedepohl, 1961).
The Devonian was followed by a long and likely uninterrupted continental period of 400 million years. During this period the present-day Estonian territory and the Fennoscandian Shield migrated through tropical and subtropical climatic zones to arrive finally the temperate zone. The deep (200 m and more) preserved valleys reveal that the territory rose and was intensely eroded at the end of the Devonian. The weathered surface formed under the different climatic conditions was subject to denudation and accumulation. A weathered crust of variable mineral composition and degree of weathering had been formed at the onset of the continental glaciations.
6.2. Quaternary deposits (Map Sheet 1.5)
The Quaternary cover in Estonia consists of Pleistocene deposits formed by several continental glaciers and their melt waters, and Holocene marine, aeolian and lacustrine sediments. In the north and northwest, these deposits are usually less than 5 meters thick (Raukas, 1993), because the soil was largely removed by glacial erosion and wave-action during uplift. On the limestone and dolomite plains (alvars) almost all soil was removed. The deepest soils, 50 to 200 m, are located in the buried valleys, the Saadjärv drumlin field and in the Haanja and Otepää heights in southern Estonia (Geology …,1997). Deep soils also occur near Viljandi and on the outwash plains in western Estonia (Figure 9). Deep soils are often associated with deposits from more than one glaciation. The principal direction of ice movement was southward, but deviated both eastward and westward.
24
The continental glaciers carried to Estonia large amounts of crushed material from the crystalline Precambrian rocks on the bottom of the Baltic Sea (chiefly the Gulf of Finland), Finland and northern Scandinavia. The Pleistocene soils are dominated by tills deposited by the different glaciers; as many as five till units have been discerned in Estonia (Geology …., 1997). In places these tills contain, or are separated by, sorted sediments such as sands, silts and clays from interglacials and interstadials. Organic material in these sediments can be dated by C14 (Liivrand, 1992, Raukas, 1992). The stages of the Pleistocene are presented in Table 3. Each glacial stage is disassociated by shorter free interstadials. At least two ice-free periods occurred during the Weichsel, the latest glaciation. During glacial advances the ice mass eroded, deformed or displaced both tills and sorted sediments. Ice margin features were formed during pauses in glacial advance or retreat.
Table 3 Pleistocene stratigraphy of Estonia (Geology..., 1997)
The most prominent ice marginal zone, the Palivere zone, features end moraines (Saaremaa and Haapsalu), marginal eskers (NW Estonia) and glaciofluvial deltas (between Tallinn and Kunda and on Hiiumaa) (Raukas, 1992). Further south the older Pandivere zone stretches from Narva in the east over the Pandivere Upland to Pärnu on the western coast. The Pandivere Upland was a part of the ice-shed zones between the Baltic and the Finnish ice streams. During late glacial time, the ice cover formed numerous ice lobes with individual dynamics (Salonen, 1992; Karukäpp, 2003). The Pandivere Upland features eskers and esker systems in addition to kame fields, hummocky moraines and glaciolacustrine deposits.
Drumlins occur in clusters in Estonia. The best known drumlin field is the Saadjärv drumlin field. The composition of drumlins varies; many drumlins contain sorted sediments as well as older tills (Rõuk & Raukas, 1989).
Glaciofluvial sediments, which are overlain by relatively thin (<2 m) till layers deposited during the latest glacial stage are fairly common. These sediments have often been encountered in drillcores and in open pit excavation, e.g. in the Rapla area.
Division
Sub-division
Subformations Facies Litostratigraphy/vegetation
Estonia North Europe
H
olocene
Continental and marine deposits
Võrtsjärve Stadial
Grey till in North Estonia, reddish-brown till in South Estonia
Savala Interstadial Dry periglacial vegetation Valgjärve Stadial Grey till in North Estonia,
purplish-grey till in South Estonia Keinase Interstadial Tundra vegetation
Prangli Eem Interglacial Forest vegetation, marine and continental deposits
Upper Ugandi Stadial Brown till in North Estonia, grey till in South Estonia Middle Ugandi Interstadial Periglacial vegetation
Lower Ugandi Stadial Brown till in North and South Estonia
Karuküla Holstein Interglacial Forest vegetation
Sangaste Elster Sangaste Stadial Shaly brownish till in Central and South Estonia
Saale Ugandi Middle P leistocene Pl eistocene Main formations Units Järva Weichsel U pper P leistocene
Carbonate-rich silty and sandy tills are common in north-west Estonia (Kadastik & Ploom, 2000). Three till units dating from late Weichsel have been distinguished on the west Estonian Islands: two basal tills and a clayey, cacao-brown melt-out till. The youngest basal till, the Palivere till, was deposited during the latest glacial advance. This till is rich in Rapakivi granite and granites originating from Åland and southwest Finland. The Palivere till overlies the older basal Pandivere till, except in the eastern part of Saaremaa, which was beyond the last glacial advance (Kadastik & Kalm, 1998, Kalm & Kadastik, 2001).
Hilly moraine topography is characteristic of south and south-eastern Estonia, where the Devonian sandstone is overlain by as many as five till layers and by glaciofluvial and glaciolacustrine deposits. These deposits are thickest in the Haanja and Otepää heights and in the buried valleys. The tills can be distinguished by colour, granulometric composition and stratigraphic position. The uppermost layer consists of a silty reddish-brown till, which is underlain by a clayey purplish-grey till in many areas. Some tills are rich in carbonaceous clasts, whereas others are abundant in crystalline clasts. The composition of the uppermost till layer (Late Valdian) was influenced by the underlying bedrock (Raukas, 1978). Quartz, garnet and zircons in the light fine sand fraction are more common in the south than in the north, whereas carbonates are more common in the north (Raukas, 1969). The local variations are frequently overshadowed by regional differences or differences in age of bedrock strata (Raukas, 1974). Zircon may attribute to greater uranium content in the sediments. The granulometric composition of the tills varies from very compact clayey tills to coarse-grained sandy tills with high permeability.
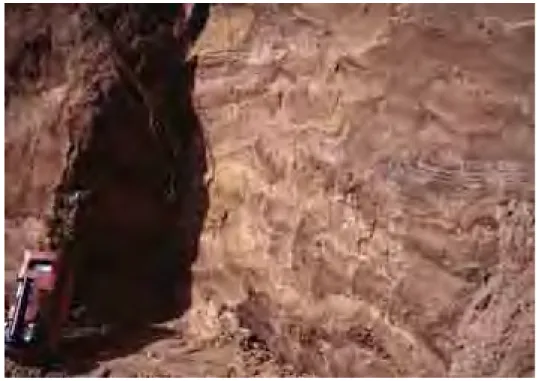
Figure 10. Sand rich in fragments of Dictyonema shale in a gully south of the Klint at Voka.
The main cause for high radon and uranium contents in soils is the Dictyonema shale and phosphorites that outcrop in the lower part of the Klint and in valley walls south of the Klint. Various glaciers have eroded and crushed material from the Klint zone and transported it southwards with some eastward and westward movement, depending on the particular ice flow. However, the amount of uranium-rich material that the glaciers could remove from the Klint zone was limited. The glacially dispersed uranium-rich material was deposited throughout Estonia and can even be found in small amounts in southern Estonia. During the last glaciation nappes of the Klint were displaced 4–5 kilometres southwards to form e.g. Vaivara Blue Hills (Raukas, 1993). These hills feature both vertical and folded Lower Ordovician beds containing Dictyonema shale with till either overlying or in-bedded in the bedrock layers. In other places along the northern Klint zone, abundant shale fragments occur in the sediments above the Klint or along the south-oriented valleys (Figure 10). In the Klint zone near Kunda, ridge like forms are found associated with the Klint. These ridges were formed initially by glaciers and have been subsequently reworked by coastal processes. The ridges
ge-26
nerally contain coarse gravel and pebbles, but till is also found together with fine-grained sediments (Geology…, 1997; Karukäpp, 2003).
Despite southward dispersal of uranium-rich material, little uranium-rich material was detected in upper soils south of the Klint zone in our surveys. Our gamma-ray spectrometry measurements show that Dictyonema shale and phosphorites occur in all soil types in the Klint zone. The Devonian bedrock in southern Estonia has influenced till composition, which may have enhanced their radon- and uranium-concentrations.
Marine and lake sediments, such as sand, silt and clays have been deposited during interglacials and interstadials as well as the present postglacial period. The silty and clayey sediments on the outwash plains north and north-east of Pärnu are in buried valleys often more than 50 m thick. In late glacial times northern Estonia and other areas were covered periodically by large ice lakes. Glaciolacustrine sediments in the form of varved clays, silt and sand are found on the Võru and Valga plains, Peipsi Lowland and Pärnu River basin and in the hilly areas south-east of Tartu. Younger sediments covered these late glacial sediments during different stages of the Baltic Sea: the Yoldia Sea, Ancylus Lake, Litorina Sea and the Limnea Sea. The Holocene marine deposits consist of pebbles, gravel, sand and silt and are dominated by carbonaceous material. Alluvial deposits are found in the river valleys and dune sands can be found both along the present shorelines in northern and western Estonia as well as along old coastlines (Häädemeeste and northern coast of Lake Peipsi).
The sediments in the fore-Klint zone have considerable thickness in some areas, up to 143 m in the ancient Harku valley but are generally thinner (Geology…, 1997). Several till layers with inter-morainic sediments have been identified. The tills on the outcrops of Vendian and Cambrian clays are bluish-grey and the pebble-cobbles consist entirely of crystalline rocks from the Gulf of Finland or Finland (Raukas 1992). These tills are almost entirely covered by Holocene marine sediments consisting of gravel, sand and silt. Erosion of the Klint area has resulted in uranium-rich material being transported and redeposited in the fore-Klint zone. Gamma spectrometry reveals enhanced uranium concentrations in the soils in many localities north of the klint. This indicates the presence of Dictyonema shale and phosphorites fragments.
Permafrost phenomena are common among Younger Dryas sediments in Estonia (Geology…, 1997). These phenomena disturb the generally horizontal bedding of the sediments through cryoturbation and ice wedges, which can provide means for transport of radon containing soil air.
7. METHODS
The Radon Risk Map of Estonian Soil is based on the available geologic information, earlier measure-ments and chemical analyses of natural radioactive elemeasure-ments and nuclides in bedrock and soil, surveys made by airborne gamma-ray spectrometers and measurements of radon in existing Estonian homes and workplaces, as well as on the surveys undertaken especially for this project. These surveys included measure-ments of radon concentrations in the soil air, gamma-ray spectrometric in situ analyses of the concentrations of radium-226, thorium-232 and potassium-40 in soils and chemical analyses of uranium, thorium and potassium in soils samples.
7.1. Site location
Site selection of locations was based on the following criteria:
- The concentration of U, Th and K in soils in the Geochemical Atlas of the Parent Rocks of Estonian Soils (Petersell et al., 2000),
- Bedrock geological maps and maps of Quaternary deposits (Geological Survey of Estonia), - Arial gamma-spectrometric maps (Reðetov et al., 1993),
- Radon measurements in existing buildings and workplaces (Estonian Radiation Protection Centre, 2004),
Other geological reports (see References).
Field surveys were conducted during the summer and autumn of 2002 and 2003. Radon in soil air was measured and gamma spectrometric determinations of radium-226, thorium-232 and potassium-40 were performed at 254 locations in 2002 and at 312 locations in 2003. These locations were located throughout Estonia, but the sampling density was greater near the North-Estonian Klint (between Muraste and Narva). The local geology was noted at all locations. Holes were dug at each site to record soil profiles to a depth of 1 m and to measure natural nuclides by gamma spectrometry. Soil samples were collected from the bottom of some of the holes.
Fieldwork as well as the number of measurements, samples and analyses had to comply with financial constraints.
The sites were selected on the grounds of the above listed information. It was deemed that the sites must characterise possible radon risk regions, and that more observations should be made in the most densely populated areas than in rural areas. Taking into account the existing geological information and the Swedish experience, areas of potential radon hazards were northern Estonia where Dictyonema argillite and phosphorite form the outcropping bedrock and where fragments of these rock units occur in soils. Other areas of special interest were those with elevated and high concentration of uranium identified by geochemical mapping and aerial gamma-ray spectrometry, as well as ancient valleys, eskers, drumlins, kames and tectonic fault zones. The preliminary site locations were selected at 1:50 000 scale topographic maps. The final locations were established during the fieldwork and determination of their coordinates made by Garmin GPS 76. The error of geodetic marking was +10 m.
7.2. Field measurements
Instruments belonging to the Swedish Radiation Protection Authority, the Geological Survey of Sweden and the Estonian Radiation Protection Centre were used for the fieldwork. All instruments were checked and calibrated at the Swedish Radiation Protection Authority and at the Geological Survey of Sweden in April and May 2002 and 2003 prior to the fieldwork.
Before the exact location of an observation point was determined, the site was checked by gamma measurements to ensure that the point chosen was representative of the geology of the location. This entailed assurance that the gamma radiation level would be characteristic of the area with no visible evidence of technogenic pollution.
The radon-222 concentration in the soil air was established by direct measurement of radon in the soil air and by calculating the 222Rn concentration based on the measured concentration of 226Ra in the soil.
28
Radon in the soil air, measured in kBq/m3, was determined with a Gammadata MARKUS-10 emanome-ter calibrated by the manufacturer (Gammadata, 2005). Under optimal conditions, instrument precision is ±10% at a radon concentration of 200 kBq/m3 and ± 20% at 20 kBq/m3, given that the instrument is used in an atmosphere of the temperature of +20o C, 80% relative air moisture and free movement of air. However, in practice, temperature changes, high soil moisture, and the hindering of soil air migration by water in the pores (which can restrict the volume of air sucked into the instrument) often results in a reduced accuracy. The measured value may in some cases considerably differ from the true radon concentration in the soil air at the measured point.
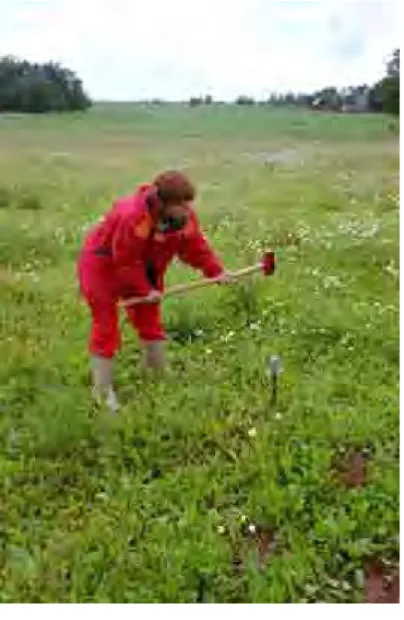
Figure 11. Krista Täht hammering the steel pipe to sample soil air.
At each site the soil air was sucked from a depth of 80 cm via a steel pipe into the emanometer (Figure 4 and 11). The radon concentration of the sampled air was then analysed by the instrument by measuring the decay of the radon daughter polonium-218 for 15 minutes. At sites where the soil contained abundant stones the measurement was made at the depth of 60 cm.
The 2003 field season was very moist, especially in southern Estonia, which hampered the radon measurements. The soil pores were often filled with water in moist glaciolacustrine clays and the clayey tills in southern Estonia. In such cases the device was unable to collect soil air. This difficulty curtailed direct measurement of radon in soil air at 59 (10.5%) observation points in 2003. These problems were not encountered in 2002.
Figure 12. Valter Petersell digging a hole to measure with the gamma spectrometer.
The field measurements were checked by repeated analysis at the same point or hole with different instruments. The U (226Ra), 232Th and 40K concentration in the soil was measured at the bottom of the same hole, but also in a nearby duplicate hole. In addition, repeated measurements of the concentration of radon in the soil air were made at the same point or at another point ca 2–3 metres away. These control measurements are shown in Table 4 and they show that the results are reliable.
At each site where radon was measured, one or two 0.8–1 m deep holes were dug (Figure 12), from which the genetic type and lithologic composition of the soil was determined. The gamma radiation at the bottom of the holes was measured with a handheld scintillometer. In addition, the concentrations of 226Ra (equivalent uranium, eU), 232Th (Th) and 40K (K) in the soil at the bottom of the holes were determined with a portable gamma ray spectrometer (Exploranium GR-256, 1989) (Figure 3). The gamma spectrometers were calibrated in Sweden on SGU’s calibration pads at the Dala airport, Borlänge, before the fieldwork. The measurement error in the field was approximately ±10% with a measuring time of 400 seconds.
The detector unit was placed at the bottom of the hole for measurement. As the spectrometers are adjusted for a 2 π configuration (an infinite flat surface) the recorded values required conversion from 4 π
to 2 π configuration with a factor of 0.65. The spectrometer also recorded the number of radioactive impulses (decays) per a certain time unit. This allowed a continuous check of the gamma spectrometer’s reliability and on the accuracy of the elemental composition. Soil samples were taken from the bottom of the holes for laboratory analyses of uranium, thorium and potassium if needed.