VOC EMISSIONS FROM A LANDFILL AND THE
IMPACT ON TROPOSPHERIC OZONE
Sérgio Machado Corrêa
Jorgina Rosete Teixeira
Eduardo Delfino Sodré
Carolina Vieira de Souza
State University of Rio de Janeiro, Brazil
sergiomc@uerj.br
ABSTRACT
This paper attempts to demonstrate the impact on tropospheric ozone according to VOC emissions from a landfill, located in the Rio de Janeiro Metropolitan Area (RJMA) at Niteroi city. It is well known that ozone is formed by the reactions of VOC, NOx and sunlight. The actual situation of this area is a low-medium ozone concentration due to high levels of NOx. The contribution of high VOC values from the landfill emissions will lead to a new situation with higher ozone values. The emissions of Morro do Céu Controlled Landfill (ACMC) (Niterói) were compiled together with meteorological data using OZIPR trajectory model coupled with SAPRC chemical mechanism. The input data for SAPRC were obtained using a VOC speciation by a representative sample collected at December, 2009 above the landfill soil. The samplings were done using evacuated electropolished canisters, and the chemical analyses were done by GC-MS following U.S.EPA TO-15 methodology. The base case used was adjusted for the RJMA using the annual emissions inventory done by INEA (Environmental Agency of Rio de Janeiro State) and the VOC speciation was performed at Rio de Janeiro downtown area. The ozone modeled for RJMA was compared with the ozone modeled for the landfill area, where the differences between the modeling procedures were the VOC speciation and hourly emissions. The results indicated an increase of 27% for ozone in the region of the landfill, indicating that the VOC emissions have to be considered.
KEYWORDS
Atmosphere; Modeling; Ozone; Volatile Organic Compounds; NOx.
1 INTRODUCTION
Most landfills in Brazil are not well dimensioned, and therefore become potential sources of volatile organic compounds (VOC) emissions to the atmosphere. According to the literature, the VOC have a significant influence on the formation of tropospheric ozone, a secondary pollutant harmful to the environment and humans.
The formation of ozone in the troposphere occurs through the interaction between the VOC, nitrogen oxides (NOx) and sunlight. The amount of ozone generated depends on the reactivity
carbonyls, and to a lesser extent aromatic and cyclic compound, the potential for ozone formation in the troposphere is increased.
To identify the main molecules which form ozone it was created reactivity scale, which relates the increase in ozone due to the increment of an individual VOC. For the cities of Rio de Janeiro and São Paulo (Brazil), we identified that the main ozone precursor is formaldehyde [1, 2].
This work evaluated the emissions of volatile organic compounds (VOC) from a controlled landfill named Morro do Céu (ACMC) and its impact on the ozone formation.
This landfill is located in the surroundings of the city of Niteroi (RJ), Brazil. The area has some vegetation around and a high population density.
2 METODOLOGY
The impact of VOC emitted from the landfill was evaluated using an empirical trajectory model implemented in OZIPR [3, 4]. In this model a well-mixed box moves at the average wind speed along a trajectory through the urban area. As the box moves, its height increases because of the rise in the mixing height from the sun’s heating. This rise results in a decrease in the concentrations of the species in the box. At the same time, fresh emissions are added through the bottom face of the box, increasing the concentrations of primary species. It was not possible to use a sophisticated urban airshed model, which requires very detailed information as input data, including the meteorology and emissions resolved in both time and space, which is not available for Rio de Janeiro. Therefore the use of a 3D airshed model would not have yielded meaningful results.
This model is based on the assumption, widely accepted, that the chemistry of VOC and NOx leads to the formation of ozone and a change in a single individual VOC can lead to surprising results. A more detailed description of the physics and chemistry of the model is given in our earlier work [5, 6].
The ozone modelled for the landfill was compared with the ozone modelled for the base case of the RJMA, because it is representative of the urban area of Rio de Janeiro, which area of the ACMC is inserted.
The input data for modelling were:
• Hourly emissions of total VOC, NOx and CO;
• The initial concentrations of total VOC, NOx and CO; • Speciation of VOC;
• Local hourly weather data of temperature, pressure, humidity and height of mixing layer; • Geographical coordinates to calculate the intensity of sunlight;
• A chemical model with chemical reactions and their rate constants. 2.1 Input data for modelling the base case.
Samples for modeling air quality to the base case which were compared with the ACMC scenario were collected next to the downtown area of the Rio de Janeiro using an automatic air quality monitoring station (685978 E and 7465946 S) that also collects meteorological data (temperature, humidity, pressure, and solar flux) and criteria pollutants (NOx, O3, SO2,
CO, total hydrocarbons, and particulate matter). The location and site conditions were the same as described in previous works [7, 8, and 9].
For the speciation of VOC, the sampling was performed over three days (June 12, 13 and 15, 2007) at two different times (9:00 AM. and 3:00 AM) using 1.8 L electropolished, stainless-steel, evacuated canisters. To collect each whole-air sample, a stainless-steel valve was slightly opened and the canister was filled to ambient pressure in about two minutes. The samples were analyzed within three days as has been previously described [10].
The samples were analyzed by gas chromatography with flame ionization detection (GC-FID) and mass spectrometry (GC-MS). The method follows the U.S. EPA guidelines [11, 12] and analyses were done using a Varian CP3800 gas chromatography with a Saturn 2200 mass spectrometer. Samples for carbonyls were collected and analyzed following U.S.EPA TO-11A [13] methodology, based on the reaction of atmospheric carbonyls with 2,4-dinitrophenyl hydrazine, with the formation of the respective hydrazones. The analyses were performed with a Perkin Elmer series 200 Liquid Chromatography with UV detection.
In this study VOC were grouped according to their reactivity with the OH radical into a total of 12 different groups. The average concentration of each compound was determined using the experimental data obtained from the TO-14 and TO-15 U.S.-EPA methodologies [11, 12]. The rate and stoichiometric coefficients were calculated as weighted averages of all the components within a species group.
The initial concentrations of total NOx, VOC and CO were provided by INEA (Environmental Agency of Rio de Janeiro) [14] through automatic monitoring station of air quality were obtained in one minute intervals and were averaged over periods of an hour. Concentrations of CO, NOx, O3, CH4, SO2, NMHC (Non-methanic hydrocarbons) and PM10
were measured along with the temperature, air humidity and atmospheric pressure [14]. The initial concentrations (06:00 AM) used in the simulation were 1.10 and 0.15 ppm for CO and NOx, respectively, which were the mean experimental values obtained by the automatic monitoring station for June 2007. The VOC initial concentration was set as 0.90 ppmC following the TO-14A US-EPA results.
For emissions data, it were used the annual emissions inventory developed by INEA.
The VOC/NOx/CO emission ratios were calculated to be consistent with the most recent vehicle emission inventory for the city of Rio de Janeiro and the INEA emission inventory for the RJMA [15]. On a mass basis, values of 0.243 and 0.210 for the VOC/CO and NOx/CO ratios, respectively, were used. These ratios were kept constant during the simulation, and because they depend on the characteristics of the vehicular fleet, they were considered as non-adjustable parameters. Absolute emission rates were adjusted to fit the measured ambient concentrations of CO (the average hourly values for the June 2007 period). This adjust is choose due to the low reactivity of CO and its concentrations is mainly dependent to the emissions and transport parameters.
Hourly meteorological data of temperature, pressure and humidity were calculated as an average in June 2007.
The initial and maximum mixing heights were set as 600 m and 1600 m, respectively, which are typical values for Rio de Janeiro [16]. The main effect of the mixing height is the dilution of gases. In this work, because the absolute values of CO emissions were also used as adjustable parameters, an error in the mixing height may be corrected by changing the emissions.
The actinic solar flux was calculated according to the geographic location and date. This procedure is done by OZIPR software according to the geographical coordinates and the day of the modelling.
The photochemical model SAPRC [17] was used to describe the reactions in the atmosphere. This model has been extensively studied and validated and has been used both in our previous studies and in many simulations around the world.
2.2 Modelling for the ACMC
Input data for the base case, as the initial concentrations, the hourly emissions of CO, HC and NOx, and the variation in the mixing layer, as representative of the urban area of Rio de Janeiro, were also used to ozone modelling for the ACMC. An additional adjustment was considered unnecessary, because the main objective of the simulation was to analyze the effect of VOC concentrations and their speciation in the landfill and not exactly reproduce a particular day or scenery. Therefore, the construction of the base case was considered representative of air quality of Rio de Janeiro downtown area.
Emission rates (kg km-2h-1) and speciation of VOC from the landfill were obtained by representative samples collected in December 2009 at the landfill above the ground. The collections were done using electropolished and evacuated canister and chemical analysis were performed using GC-MS following the methodology TO-15US.EPA. Air samples were collected from the soil of the landfill, as described by Corrêa et al [18]. Briefly, a flow PVC chamber was positioned on the landfill soil and the VOC were sampled using activated charcoal cartridges and analyzed by gas chromatography (Varian 450GC) with mass selective detection (Varian 220).
3 RESULTS AND DISCUSSION
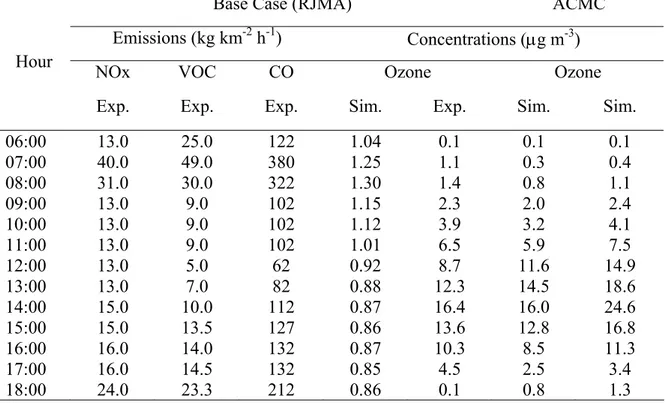
Hourly emissions values for NOx and CO used in the model input data for both modelling and data from experimental CO and ozone were used to adjust the base case model are presented in Table 1. As shown, the simulated and experimental data for ozone concentrations are in reasonably agreement throughout the period of time. Table 1 also shows the total hourly emissions of VOC used in the base case and the output data of the two modelling, which represent hourly concentrations of ozone. Emissions of VOC from the ACMC for the simulation were considered constant throughout the day and the value of 1.980 kg km-2 h-1 [18]. The simulated ozone peak was obtained at 2:00 PM (24.6 μg m-3). As a reference, the
CONAMA resolution No. 03 of 1990 states that the average concentration of ozone of 160 μg m-3 of air during one hour shall not be exceeded more than once per year [19].
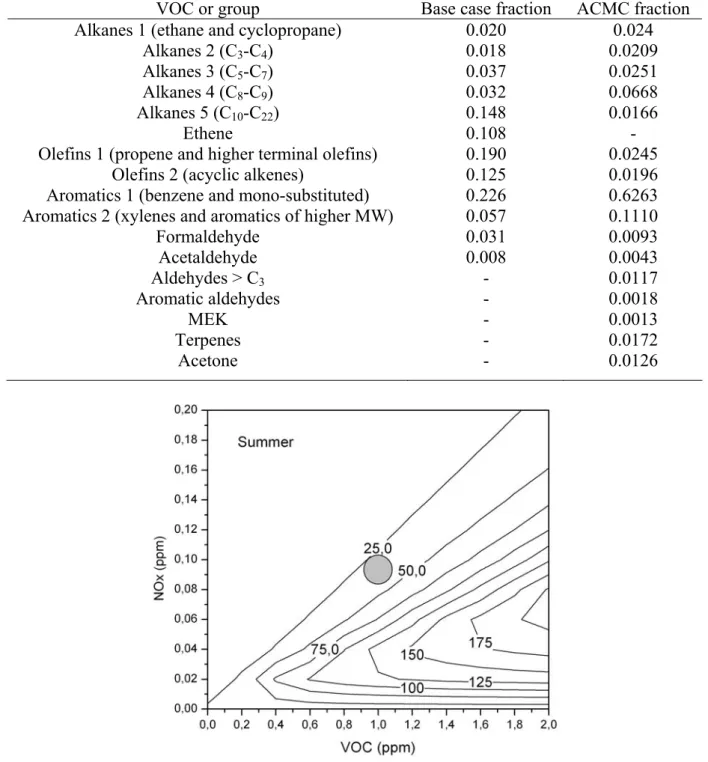
increment can be explained by the equilibrium between the amount of VOC and NOx for RJMA. As can be visualized by Figure 1, our city is situated in a region where an increase of VOC emission will lead to an increase on the ozone region. In other words, the low ozone concentration is controlled by the high levels of NOx, mainly originated by diesel and compressed natural gas vehicles.
Table 1 Input (experimental) and output (simulated) data of the ozone modelling for the RJMA and the ACMC.
Base Case (RJMA) ACMC
Emissions (kg km-2 h-1) Concentrations (μg m-3)
NOx VOC CO Ozone Ozone
Hour
Exp. Exp. Exp. Sim. Exp. Sim. Sim. 06:00 13.0 25.0 122 1.04 0.1 0.1 0.1 07:00 40.0 49.0 380 1.25 1.1 0.3 0.4 08:00 31.0 30.0 322 1.30 1.4 0.8 1.1 09:00 13.0 9.0 102 1.15 2.3 2.0 2.4 10:00 13.0 9.0 102 1.12 3.9 3.2 4.1 11:00 13.0 9.0 102 1.01 6.5 5.9 7.5 12:00 13.0 5.0 62 0.92 8.7 11.6 14.9 13:00 13.0 7.0 82 0.88 12.3 14.5 18.6 14:00 15.0 10.0 112 0.87 16.4 16.0 24.6 15:00 15.0 13.5 127 0.86 13.6 12.8 16.8 16:00 16.0 14.0 132 0.87 10.3 8.5 11.3 17:00 16.0 14.5 132 0.85 4.5 2.5 3.4 18:00 24.0 23.3 212 0.86 0.1 0.8 1.3 Table 2 shows the speciation of volatile organic compounds used for the simulation of the base case and ACMC.
Table 2. Average composition of VOC used for the simulation of the base case for ACMC (units are given in ppmC and fractions are the sum of a ppmC of total.
VOC or group Base case fraction ACMC fraction
Alkanes 1 (ethane and cyclopropane) 0.020 0.024
Alkanes 2 (C3-C4) 0.018 0.0209
Alkanes 3 (C5-C7) 0.037 0.0251
Alkanes 4 (C8-C9) 0.032 0.0668
Alkanes 5 (C10-C22) 0.148 0.0166
Ethene 0.108 -
Olefins 1 (propene and higher terminal olefins) 0.190 0.0245
Olefins 2 (acyclic alkenes) 0.125 0.0196
Aromatics 1 (benzene and mono-substituted) 0.226 0.6263
Aromatics 2 (xylenes and aromatics of higher MW) 0.057 0.1110
Formaldehyde 0.031 0.0093 Acetaldehyde 0.008 0.0043 Aldehydes > C3 - 0.0117 Aromatic aldehydes - 0.0018 MEK - 0.0013 Terpenes - 0.0172 Acetone - 0.0126
Figure 1. Isopleths plot for Rio de Janeiro area
4 CONCLUSIONS
This study indicates that the emissions from a landfill and its VOC speciation contribute to the increment of the tropospheric ozone in a local scale. Some aspects have to be taking in
the impacts of the plume on the surroundings and the potential to form secondary pollutants, as was demonstrated to ozone, a harmful photochemical oxidant.
REFERENCES
1. CORRÊA, S. M., ARBILLA, G., MARTINS, E. M., QUITERIO, S. L., GUIMARAES, C. S., GATTI, L. V., 2010. Five years of formaldehyde and acetaldehyde monitoring in the Rio de Janeiro downtown area. Atmospheric Environment 44, 2302-2308.
2. ORLANDO, J. P., GATTI, L. V., ALVIM, D. S., YAMAZAKI, A., CORREA, S. M; 2010. Ozone precursors for the São Paulo metropolitan area. The Science of the Total
Environment 408, 1612-1620.
3. GERY, M.W., CROUSE, R.R. User’s Guide for Executing OZIPR, U.S. Environmental Protection Agency, Research Triangle Park, N.C., EPA-9D2196NASA, 1990.
4. TONNESEN, G. S. User’s Guide for Executing OZIPR Version 2.0. 2000, North Caroline, USEPA.
5. MARTINS, E. M., ARBILLA, G., BAUERFELDT, G. F., PAULA, M., 2007. Atmospheric levels of aldehydes and BTEX and their relationship with vehicular fleet changes in Rio de Janeiro urban area. Chemosphere 67, 2096-2103.
6. CORREA, S. M., ARBILLA, G., 2003. Formaldehyde and acetaldehyde in a high traffic street of Rio de Janeiro, Brazil. Atmospheric Environment, 37, 23-29.
7. CORRÊA, S. M., ARBILLA, G., MARTINS, E. M. 2003. Formaldehyde and acetaldehyde in a high traffic street of Rio de Janeiro, Brazil. Atmospheric Environment 37, 23-29.
8. MARTINS, E. M., ARBILLA, G., 2003. Computer modeling study of ethanol and aldehydes reactivities in Rio de Janeiro urban air. Atmospheric Environment 37, 1715-1722.
9. CORRÊA, S. M., ARBILLA, G. 2005. Formaldehyde and acetaldehyde associated with the use of natural gas as a fuel for light vehicles. Atmospheric Environment 39, 4513-4518.
10. MARTINS, E. M., ARBILLA, G., GATTI, L. V., 2009. Volatile Organic Compounds in a Residential and Commercial Urban Area with a Diesel, Compressed Natural Gas and Oxygenated Gasoline Vehicular Fleet. Bulletin of Environmental Contamination and Toxicology. Available On line.
11. U.S.EPA, 1999a. Compendium Method TO-14A - Determination of Volatile Organic Compounds (VOCs) in Ambient Air Using Specially Prepared Canisters with Subsequent Analysis by Gas Chromatography, Center for Environmental Research Information, 2 ed., Cincinnati, OH 45268, EPA/625/R-96/010b.
12. U.S.EPA, 1999b. Compendium Method TO-15A - Determination of Volatile Organic Compounds (VOCs) in Air Collected in Specially-Prepared Canisters And Analyzed by Gas Chromatography/ Mass Spectrometry, Center for Environmental Research Information, 2 ed., Cincinnati, OH 45268, EPA/625/R-96/010b.
13. U.S.EPA. Compendium Method TO-11A. Determination of Formaldehyde in Ambient Air Using Adsorbent Cartridge Followed by High Performance Liquid Chromatography (HPLC). EPA-625/R-96/010b. Cincinnati, OH: U.S. Environmental Protection Agency, 1997.
14. INEA, 2009. State Environmental Institute. Private communication.
15. GUIMARÃES, C. S., VARANDAS, L. S., ARBILLA, G., 2009. Formaldehyde and acetaldehyde concentrations in the idle and taxiway areas of an urban airport. Journal of
16. ARBILLA, G., MARTINS, E. M., MOREIRA, A., MOREIRA, L. F. 2002. Ozone Air Quality Modeling. A Case Study: A Heavily Vehicle Impacted Urban Avenue in Rio de Janeiro, Brazil. Journal of the Brazilian Chemical Society 13, 308-317.
17. CARTER, W. P. L., 1990. A detailed mechanism for the gas-phases atmospheric reactions of organic compounds, Atmospheric Environment, 24, 481-518.
18. CORRÊA, S. M., TEIXEIRA, J. R., SODRÉ, E. D., SOUZA, C. V., 2010. Emissions of VOC from a landfill and its plume dispersion modeling. Linnaeus ECO-TECH´ 10, Kalmar, Sweden, November 22-24.
19. NATIONAL COUNCIL ON THE ENVIRONMENT (Brazil).Resolution N° 03 of 28 June, 1990. Sets standards of primary and secondary air quality and even the criteria for acute episodes of air pollution. Official journal [of] the Federative Republic of Brazil, Brasilia, DF, 23 out.1990