Institutionen för naturvetenskap och teknik
E
NERGY INTAKE
OF
C
OMMON
G
UILLEMOT
,U
RIA AALGE
,
CHICKS
AT
S
TORA
K
ARLSÖ
,
S
WEDEN
I
NFLUENCE OF CHANGES IN THE
B
ALTIC
S
EA
Elisabeth Enekvist
Examensarbete i biologi 20 poäng, 2003
Bilderna på framsidan föreställer:
Bohylla i Västerberget (vä)
Sillgrisslehona med nyfångad skarpsill (hö)
Fotograf: Elisabeth Enekvist
Denna uppsats är författarens egendom och får inte användas för publicering utan författarens eller dennes rättsinnehavares tillstånd. Elisabeth Enekvist
CONTENTS
ABSTRACT ... 4
INTRODUCTION ... 5
MATERIAL AND METHODS ... 6
Study species ... 6 Common guillemot ... 6 Sprat ... 6 Observations ... 7 Fish analyses ... 8 RESULTS ... 9
Feeding behaviour and feeding rate ... 9
Attendance behaviour ... 10
Feeding fish ... 10
Mass and energy intake ... 12
DISCUSSION ... 13
Feeding and attendance behaviour ... 14
Representative fish ... 14
Changes in size of sprat ... 15
Estimations ... 15
Energy density ... 15
Mass and energy intake in relation to requirements ... 16
FINAL COMMENTS ... 17
ACKNOWLEDGMENTS ... 18
REFERENCES ... 18
ABSTRACT
Observations of feeding behaviour of common guillemots, Uria aalge, in June 2002 at the island Stora Karlsö in the Baltic Sea proper, and measurements of morphology and energy density in the prey fish sprat, Sprattus sprattus, showed that fish delivered to chicks at present are shorter and weigh less than in the 1970s. Long lasting attending periods and a feeding rate of 4.6 feeds per day indicate that parents are feeding their chicks at a maximum rate. Because of a decline in the energy density in sprat (22.4 kJg-1 dry weight) the daily energy intake of common guillemot chicks have declined noticeably. This could probably explain the observed decrease in fledging body weight of chicks through the 1990s. Baltic common guillemots do not seem to be able to select more energy-dense prey sizes or to switch to other prey species.
INTRODUCTION
Studies of the behaviour of marine birds can provide useful information on several aspects of the marine environment in general (Monaghan, 1996). Although care must be taken when interpreting seabird data as a reflection of fish abundance (Furness and Camphuysen, 1997), seabirds, particularly Uria species, and their feeding behaviour can be good short-term indicators of marine ecosystem health (Zador and Piatt, 1999). Number of adult guillemots is a poor indicator of environmental change because of their high survival rate and late maturity. Instead food choice, chick growth and chick survival are good indicators of environmental change since they all respond rapidly to changes in food availability and oceanographic conditions (Barrett, 2002). For example, commercial overexploitation of key fish species in the SW Barents Sea has caused major stock fluctuations resulting in dramatic responses by some top predators, e.g. Uria aalge (see ref. in Barrett, 2002).
Sprat, Sprattus sprattus, a member of the Clupeid family, is both a major forage and a commercial fish species in the Baltic Sea. It is pelagic, usually occurring at 30-40 m depth in summer and twice as deep in winter (Andersson, 1942). Due to intense fishing of cod, which has contributed to a dramatic decrease in the cod stock, the populations of clupeids (e.g. sprat and herring Clupea harengus) have increased. This increase is assumed to be a result of reduced predation pressure. The cod-dominated system in the Baltic Sea has changed to a clupeid (sprat)-dominated system (Hansson, 2001; Kornilovs et al., 2001).
In addition to fishing pressure, changes in forage fish populations can also be related to environmental changes (Robards et al., 2002), although the specific effects of different factors can be difficult to identify (Carscadden et al., 2002). Changing temperature and salinity have influenced zooplankton (the main food of sprat) communities and caused dramatic changes in the pelagic food chains and ecosystem (Vuorinen et al., 1998). The eutrophication of the sea has great impact on the production of zooplankton and thus indirectly on the sprat production (bottom-up control) (e.g. Hansson, 2001).
There are several indications on a substantial increase in sprat stock in the Baltic Sea during the last decade, such as increasing catches, zooplankton migration and cod egg predation, and decreasing age specific weights. Fishing of sprat became extensive during the late 1990s. In 1997 the greatest fish catch up to now in the Baltic Sea was 520 000 tons of sprat (Hansson, 2001). The increased stock of sprat in the 1990s and a sequence of strong year classes have influenced the stock structure and behaviour of zooplankton species (Arrhenius, 1998; Kornilovs et al., 2001). Studies have shown that increased sprat stock size in the Baltic Sea influence zooplankton to increase their vertical migration (Arrhenius, 1998; Kornilovs et al., 2001). There was also a substantial predation on cod larvae in the Baltic Sea 1988-1995 due to extraordinarily high abundance of sprat larvae (Köster and Möllmann, 2000).
An observed decrease in mean age specific weight (= weight-at-age or condition acc. to ICES) of sprat and herring also indicates an increase in numbers of pelagic fish in the Baltic proper and a reduction in food availability (Cardinale and Arrhenius, 2000; Cardinale et al., 2002). An increased competition for food is probably one cause to the presumed deteriorated condition of sprat (ICES 2002).
In various studies on responses of seabirds to variable prey abundance, limited prey
availability often is the main factor for decreasing fledging body weight or reduced growth rate (e.g. Uttley et al., 1994; Bryant, 1999). In contrast, it seems like the increase in prey fish abundance, which in turn seems to lead to limited fish-food availability (Kornilovs et al., 2001), has been a problem to common guillemot chicks in the Baltic Sea during the last decade. Their fledging body weight has decreased constantly during the 1990s (Österblom et
al., 2001), even though the number of feeds has been doubled compared to the middle of the 1970s (Hedgren and Linnman, 1979; Österblom and Olsson, 2002). In 1974-76 (Hedgren, 1976) and in 1998 (Österblom and Olsson, 2002) common guillemot chick diet at Stora Karlsö was studied, but there is no earlier study that relates the changes in the Baltic Sea during the last decades to the diet.
The aim of this study was to analyse if changes in the fledging body weight of common guillemot chicks in the colony at Stora Karlsö could be related to the quality of their food. I have observed feeding behaviour of adult common guillemots during the chick-rearing period, and performed laboratory analyses of energy density of their main feeding fish sprat. This study also presents information on fish actually brought to, and eaten by, common guillemot chicks. The analysed fish is obtained from a possible feeding area. Estimated daily energy intake of the chicks is compared to that in earlier studies to test the suggested decrease in net energy gained by the chick (Österblom et al., 2001). A decrease in the daily energy intake would be in accordance to the junk food hypothesis (ref. in Litzow et al., 2002) that holds that even when fish are abundant the energy density (kJg-1) in low energy fish is inadequate to meet the energetic demands of the predator. This study was carried out as a part of a larger project that is carried out in the area.
MATERIAL AND METHODS Study species
Common guillemot Uria aalge
The Stora Karlsö colony of common guillemots is the largest in the Baltic Sea and probably serves as a source of the entire Baltic Sea population. The colony consists today of about 8000-10 000 breeding pairs (Olsson et al., 2000). Since the end of the 19th century the number of pairs have increased (Hedgren, 1975), unlike some other colonies e.g. in the Norwegian Sea and the Barents Sea regions where common guillemots have experienced dramatic population decreases in recent years (Barrett, 2002 and references therein).
Sprat Sprattus sprattus
An increase in sprat biomass may cause a decline in the individual energy content due to increased intraspecific and interspecific competition for food (Cardinale and Arrhenius, 2000; Kornilovs et al., 2001). The accepted idea is that larger fish have a larger energy content and also that the calorific value (= measure of energy density, kJg-1) is positively correlated with weight. Both mean weight-at-age and body weight of fish of the same length (=condition acc. to Cardinale et al., 2002) of sprat have continuously decreased between 1986 and 1998. The mean weight-at-age has decreased by about 40 % in 1990-1998 (Cardinale et al., 2002; ICES, 2002).
Fish demonstrate intraspecific length-related and seasonal changes in energy density and consequently in total energy content. In summer there is considerable individual variation in the energy content of sprat of a given length (Hislop et al., 1991) depending on the fat content and the spawning status (e.g. Robards et al., 1999). Marine prey fish often display a seasonal energy cycle with an increase in energy density during the feeding periods before and after spawning period, where ‘fall-spawners’ (e.g. Ammodytes sp.) peak in summer and ‘spring-spawners’ (e.g. clupeids) peak in fall (Arrhenius, 1998; Robards et al., 1999). Corresponding to the onset of spawning the energy densities are reduced. According to Andersson (1942) the Baltic Sea sprat spawn in April-August (mainly in May-July) when they have reached an age of 2-3 years.
Most of the variability of Baltic sprat condition between 1989 and 1998 is explained by density-dependent effects connected to a decline in the individual food intake caused by an
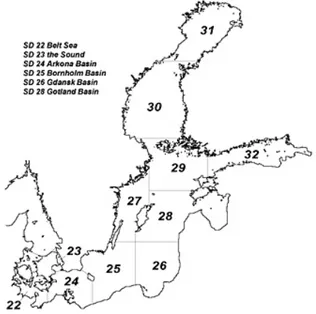
increased fish biomass (Cardinale et al., 2002). Also an abiotic factor like salinity may affect the condition of pelagic fish, directly via fish metabolism or indirectly affecting zooplankton community. For example in ICES subdivision 27 (Figure 1), the western part of Baltic proper, where salinity levels are lower than in the southern part, Cardinale et al., (2002) found that the variation in salinity explained around 42 % of the variation in sprat condition. The
geographical source of the prey fish can be important to consider in foraging studies since specimen of the same species can show great disparity in growth (Robards et al., 2002).
Figure 1. Map of the Baltic Sea and ICES subdivisions (SD) 22-32.
Different studies on sprat food in the Baltic Sea reach different conclusions. Arrhenius (1998) and Cardinale and Arrhenius (2000) accentuate that sprat is strictly zooplanktivorous. Köster and Möllmann (2000) and Hansson (2001) have the opinion that zooplankton is the main food of sprat, but also hold sprat as a major predator on its own and other fish’s egg and larvae, and occasionally having a great influence on cod reproductive success.
Observations
I observed the feeding behaviour of 32 breeding pairs of common guillemots on one ledge about 35 m above sea level on the western part of the island Stora Karlsö (57o17’N, 17o58’E) in the Baltic Sea proper. The ledge is situated about 4 m beneath the observing point where I could observe without disturbing the birds. Occasionally I used binoculars and telescope. The observations were carried out during totally 56 hours between June 9 and June 29, 2002. To study the feeding and attendance behaviour in detail, 24 breeding pairs were filmed from the same point with a Sony video hi 8-camera during three dusk-dawn observations (03.00-22.00) in June 17, 20 and 23. Among these 24 pairs, 15 birds wore an individual two-letter plastic tarsus ring and I was therefore able to identify the sex of adults in 13 pairs.
Measurements were made on feeding rate of males and females respectively. Every breeding site was checked in every thirty minutes of its content (number of adults) to measure adult attendance behaviour. In five pairs the egg never hatched during the film-period, but in 19 pairs the egg hatched and both adults were chick rearing. The birds were directed towards me and observed diagonally from above, and so almost every fish was actually seen swallowed by the chick. Due to lethal accidents, late hatched or early-fledged chicks not all chicks were
present during all watches. The number of studied chicks during the three film-days was 18, 18 and 15 respectively.
Fish analyses
It was not possible to discriminate between the clupeids sprat and herring in field, but referring to earlier studies, which have shown sprat being the main feeding fish in this and other Baltic common guillemot colonies (Hedgren, 1976; Lyngs and Durinck, 1998; ref. in Österblom and Olsson, 2002) I assumed sprat was the main prey and I therefore made my laboratory analyses on sprat.
All analyses on sprat are made on fish caught by a commercial fishing vessel. The fish were sampledand frozen immediately on board and later transported to the laboratory at the Ar Research Station, Gotland. The sample used was trawled in June 12th at Knolls grund (outside north point of Öland) in the area of ICES subdivision 27, which most likely includes the foraging area of the guillemots of Stora Karlsö (see Figure 1). The catch was taken from a depth of approximately 45 meters. Random sample of 50 fishes were thawed and length (mm) and wet weight (g) was obtained. The fishes were sorted into size-classes by length (small = < 110 mm, medium = 110-120 mm, large = >120 mm) and by wet weight (small = < 9 g,
medium = 9-11 g, large = > 11 g).
All specimens were then dried in 60º C for 48 hours, which is the appropriate time for drying sprat (M. Petersson, pers. com.) and weighed again (dry weight). From a sample of about ten fishes of each size class pellets of 1 g were made from each dried fish. The pellets were then combusted in a Gallenkamp Adiabatic Bomb Calorimeter. The calorific value (= energy density, kJg-1 dry weight) of each fish was calculated from the formula:
(final temp. - initial temp., Co) × (heat capacity of apparatus - corrections for wires and acid, kJ) / fuel, g.
For comparison of methods, wet weight and wet calorific value was calculated from length according to the Harris and Hislop (1978)-model.
Energy content of whole fish (total energy content, kJfish-1) was calculated as dry calorific value× dry weight of each specimen. No corrections for effects of the deep-freezing were
made.
Estimations of delivered fish sizes were made of six fish from photos, taken on parents holding a fish in the bill, using multiples of the average adult bill-length of 46.8 mm as a guide (Cramp 1998; Harris and Wanless, 1985). I also made a size classing (small, medium and large) of directly observed (= filmed) delivered feeding fish by estimating the size of the projecting part of the fish in relation to the bill-length.
The daily energy intake of the chicks was estimated from number of feeds of the different length-classes respectively multiplied by the mean calorific value of the same class, and the products were then added up for each chick. The mean energy intake for all chicks was then calculated from these values. Since length and wet weight were strongly correlated (the fish in the length-classes were nearly the same specimen as those in the wet weight-classes) I
estimated the daily food intake of each chick in similar way, but multiplying by the mean wet weight of each size-class.
To see if the adult common guillemots were selective when catching the prey, I compared the size distribution of delivered and trawled fish.
RESULTS
Feeding behaviour and feeding rate
The chicks were only fed in daylight (i.e. approx. 03.00-22.00). One fish was delivered at a time, except for one occasion when an adult was observed bringing two fishes in its bill. These fishes were much smaller than normal feeding fish (pers. obs.).
During the three film-days, i.e. 51 chick-days, the total number of feeds was 233. The average number of feeds per chick per day was 4.6 (SE = 0.21, range 2-8, n = 51 chick-days). Mean feeds per chick per hour during the film-days were 0.24 (SE = 0.02, n = 57 feeding-hours) (Figure 2). Most feeds were delivered in the early morning. The peak during the second hour, with a mean frequency of 0.47 feeds per chick per hour, was more than three times higher than that recorded five hours later. During the last hours before dark very few fishes were delivered. 0 0.1 0.2 0.3 0.4 0.5 3 5 7 9 11 13 15 17 19 21
Hour of the day
F e e d s / c h ic k / h o u r
Figure 2. Mean number of feeds delivered to guillemot chicks each hour of the day during three dusk-dawn film-days, June 17, 20 and 23 (mean 0.24, SE 0.02, n = 57 analysed one-hour periods).
There were differences between pairs in the activity of the parents, but on average males and females did not feed their chicks at a different rate (Chi2 = 2, df = 1, NS). Out of 98 directly observed feeds males carried out 42 (43 %) and females 56 (57 %).
Using known age of five chicks and estimated minimum age of the rest I found a weak positive relationship between age and number of feeds (r = 0.35, P < 0.05, n = 51). All chicks received at least one fish during film-days.
Foraging trips ending with a feeding fish on average lasted for 3.8 hours (= 228 minutes, SE = 0.2, n = 182 trips), and nearly half the number of them lasted for between 1.5 and 4 hours (= 90-240 minutes) (Figure 3). The shortest successful foraging trip observed was 25 minutes and the longest was 12.5 hours.
0 0.05 0.1 0.15 0.2 < 1 1 2 3 4 5 6 7 8 9 10 11 12 13
Duration of foraging trip (hours)
Pr o p o rt io n o f fo ra g in g t ri p s ( % )
Figure 3. Proportion of foraging trips ending with fish delivered to a chick during three film-days, June 17, 20 and 23, in relation to the duration of the trip.
Attendance behaviour
Both adults of chick rearing pairs were together at the breeding site on average during 29 %, (SE = 2, range 5-68, n = 57 film-hours) of the observed time spent on ledge. During night (22.00-03.00) only one parent was attending.
Feeding fish
98.3 % (229 out of 233) of all fish delivered by the adult birds to the chicks were sprat (clupeids) and 1.7 % (4 out of 233) was assumingly sand eel (Ammodytes sp.).
Mean length of fish (from photos) fed to chicks was 115 mm (SD = 12, SE = 4.9, range 106-131, n = 6 photos) and mean length of the trawled sample was 117 mm (SD = 8, SE = 1.5, range 104-136, n = 50 measured sprat). There was no difference between the means (t-test; P > 0.05).
Mean wet weight of the trawled sample was 10.26 g (SD = 2.2, SE = 0.4, range 7.48-15.45) and mean dry weight 2.49 g (SD = 0.6, SE = 0.1, range 1.64-3.85). Correlation between length and wet weight was strong (r = 0.93, n = 50 measured sprat). Correlation between length and dry weight was modest (r = 0.64, n = 50).
The overall mean calorific value was 22.39 kJg-1 (dry weight, SD = 1.6, SE = 0.3, range 19.75-24.83, n = 33 bombed sprat). Mean calorific value (kJg-1) of each length-class was: small 23.24 (SD = 1.7, SE = 0.6, n =8), medium 22.47 (SD = 1.5, SE = 0.4, n = 14) and large 21.67 kJg-1 (SD = 1.3, SE = 0.4, n = 11), all estimated from dry weight. Between the two length-classes small and large there was a significant difference of the mean calorific value (t-test, P < 0.05). Small sprat had greater energy density than large, 23.2 kJg-1 versus 21.7 kJg-1 respectively.
There was a negative correlation between length and calorific value (r = -0.42, P < 0.05 (0.015), n = 33) (Figure 4), but there was no correlation between either wet or dry weight and calorific value.
18 20 22 24 26 102 107 112 117 122 127 132 137 Length mm C a lo ri fi c v a lu e k J /g d ry w e ig h t
Figure 4. Calorific value (kJ/g dry weight) of each fish in relation to length (mm) (r = -0.42, P < 0.05, n =33).
The overall mean total energy content was 56 kJfish-1 (SD = 13.7, SE = 2.4, n = 33), and the mean total energy content in each length-class was: small 47.2 (SD = 8.5, SE = 3, n = 8), medium 55.1 (SD = 15, SE = 4, n = 14) and large 63.5 kJfish-1 (SD = 11, SE = 3.4, n = 11). Correlations between total energy content and dry weight (Figure 5), wet weight and length respectively were all significantly positive (r = 0.96 P < 0.001, r = 0.69 < 0.001 and r = 0.51 P < 0.01 respectively, n = 33). 20 35 50 65 80 95 1.5 2 2.5 3 3.5 4 Dry weight g T o ta l e n e rg y c o n te n t k J /f is h
Figure 5. Estimated total energy content (kJfish-1) in relation to the dry weight of the fish (r = 0.96, P < 0.001, n = 33).
A comparison of data on the calorific value in relation to length from this study to data from Hislop et al. (1991) is presented in Table 1. The result in this study is reversed to the Hislop et al.-data.
Table 1. Mean calorific values (kJg-1 dry mass) ± SD of sprat of certain mean length.
Data from Hislop et al. (1991) (sprat from The North Sea) compares with Baltic sprat (this study).
Mean length mm 1991
The North Sea
2002 The Baltic Sea
85 21,57 (3,1)
106 23,24 (1,7)
115 26,23 (2,6) 22,47 (1,5)
127 21,67 (1,3)
135 27,00 (1,4)
There was no difference in the distribution of the three length-classes between the trawled sample and the delivered fish (Chi2 = 5.5, df = 2, P > 0.05).
Mass and energy intake
The chick’s daily food mass intake was on average 46.7 g (SE = 2.3, range 18.5-85.4, n = 51 chick-days). The mean daily energy intake was 250 kJ (SE = 12, range 102-450, n = 51). There was a weak relationship between chick age and daily energy intake, where older chicks received more energy, at least up to the age of 15 days (r = 0.36, P < 0.01, n = 51) (Figure 6).
0 100 200 300 400 500 0 5 10 15 20 Chick-age (days) D a il y e n e rg y i n ta k e ( k J /d a y )
Figure 6. Daily energy intake (kJday-1) of guillemot chicks in relation to the age of the chick during three dusk-dawn film-days, June 17, 20 and 23 (mean = 250 kJday-1, SD = 85, r = 0.36, P = 0.01, n = 51).
The mean daily energy intake-data from this study is compared to other studies’
corresponding results in Table 2. The estimations are made with somewhat different methods (direct = measured values, indirect = calculated values), on different feeding species, at different study sites and in different years. In this comparison the values from this study, using both methods, are the lowest and the highest depending on method.
Table 2. The mean daily energy intake (kJday-1) of common guillemots in this study in comparison to results in some earlier studies and estimations with different methods.
Study Method Study site kJday-1
Hedgren (1976) in Harris and
Wanless (1985) b Stora Karlsö, The Baltic Sea 368
Birkhead and Nettleship (1987) c Gannet Islands, North Atlantic 296-336
Harris and Wanless (1988) b Isle of May, The North Sea 356
Hatchwell (1991) b Skomer Island, East Atlantic 278-323
Barrett et al. (1997) c Hornöya, Barents Sea 302-333
This study (2002) a Stora Karlsö 250
This study b Stora Karlsö 502
a = sprat, dry weight, direct method; b = sprat, wet weight, indirect method; c = capelin, wet or dry weight, direct method (direct = measured values, indirect = calculated values).
DISCUSSION
The common guillemot feeding behaviour observed in this study is similar to Österblom and Olsson (2002), i.e. high feeding frequency and a relatively high proportion of the day spent resting at the breeding site. This potentially indicates that parents could work more if the chicks were able to eat more. The energy content of sprat and the calculated daily energy intake of common guillemot chicks support the idea that the decreasing fledging body weight has its origin in the changes in the Baltic Sea environment and the incurred decline in the calorific value of sprat.
Feeding and attendance behaviour
Most feeds were given in the early morning in accordance with several other feeding studies (e.g. Harris and Hislop, 1978; Hedgren and Linnman, 1979; Harris and Wanless, 1985). Feeds/chick/hour each hour of the day was about similar to that in 1998 (Österblom and Olsson, 2002) except for the early morning peak. This peak in feeding rate just after dawn is probably due to the easily taken fish near the surface depending on sprat’s movements upwards during nights (Harris and Wanless, 1985; Benvenuti et al., 2001). As in Harris and Wanless (1985) there was no significant difference in the total numbers of fish brought by males and females, but a difference between pairs was noticed. In some pairs the female was most active and in others the male was.
The parents did not seem to be selective when catching the prey. My result from the distribution-test indicates that they simply catch available sizes.
Unlike Österblom and Olsson (2002) this study shows a week positive correlation between chick-age and the number of feeds. The number of feeds tends to increase with age, at least up to an age of 15 days. It seemed as some of the chicks started to leave the colony soon after that age (cf. 18 days in Harris and Wanless, 1985). However, since several chicks’ ages in this study are uncertain it would be unwise to draw any far-reaching conclusions about the
relationship between age and number of feeds from this material.
Foraging trips in this study are meant as the interval between feeds, and therefore includes time spent at the site with social behaviour and on the sea near the colony. The duration of foraging trips in this study, i.e. 228 minutes, was longer than in other studies, i.e. about 200 minutes (Harris and Wanless, 1985), 78-94 minutes (Birkhead and Nettleship, 1987), about 70 minutes (Hatchwell, 1991), 178 minutes (Monaghan et al., 1994) and 129 minutes (Österblom and Olsson, 2002). In comparison to Österblom and Olsson (2002) where 36.5 % of all
foraging trips were shorter than one hour, the proportions of the trips in this study were more equally distributed over the time scale and the mean duration of trips was nearly twice as long.
Shorter trips usually are considered indicating good food availability (e.g. Furness and
Barrett, 1985; Uttley et al., 1994). The divergences in trip duration between the studies on the Baltic guillemots thus could indicate a braking of the increase of sprat biomass, which catch-data from ICES also are pointing at (ICES, 2002). Although Monaghan et al. (1994) found that only 2.7-6.9 % of the trip duration is spent flying, another explanation could be that in 2002 possibly more Stora Karlsö-guillemots were foraging at a large distance (e.g. 50 km) from the colony, such as the north of Öland than in 1998 (Österblom and Olsson, 2002) due to poorer fish availability near the colony.
Attendance behaviour of common guillemots is an indirect but valuable indicator of changes in fish stock and ecosystem health (e.g. Harris and Wanless, 1985; Zador and Piatt, 1999). Harris and Wanless (1985) reported good food abundance and a mean time-share of 32 % of breeding pair’s attendance time. Zador and Piatt (1999) made a comparison between two adjacent common guillemot colonies experiencing different food availability. They found that breeding pairs were present together at nest sites in average 8.2 % of daytime in the declining and 24.2 % in the increasing colony and that time budgets of attendance by breeding pairs are sensitive to fluctuations in prey abundance. Greater share of time spent together indicates greater prey abundance. In this study both adults of chick rearing pairs were together at the breeding site during on average 29 % (68 % at a maximum) of the time spent on ledge. Compared to 22.6 % in Österblom and Olsson (2002), which is data from 1998 when sprat abundance is supposed to be greater than in 2002 (this study), this seems to be opposed to the foraging trip discussion above. This remains to be explained.
Because of the increased population of sprat in the Baltic Sea (Hansson, 2001; Kornilovs et al., 2001) during the 1990s, also the abundance of prey fish has increased and consequently the decrease in fledging body weight of common guillemot chicks during the 1990s cannot depend on a lack of food. Common guillemots at Stora Karlsö would have been able to deliver more fish than they did considering the spare time they spent on the ledge (Monaghan et al., 1994; pers.obs). This however would probably not increase chick fledging body weight, judging from circumstances in this study where they seem to be digesting fish at a maximum rate. Chicks were sometimes observed refusing fish from their parents (pers. obs.), in
accordance with seabird chicks in North Norway in 1983 when food was considered
superabundant (Furness and Barrett, 1985). Hatchwell (1991) found that increase in the rate at which chicks are fed over a certain threshold-provisioning rate has no appreciable effect on chick growth parameters.
Representative fish
Harris and Wanless (1985) considered a realistic estimation of a normal foraging range among guillemots to be 40-50 km and del Hoyo et al. (1996) hold that food infrequently is obtained up to 50 km away. Cairns et al. (1987) found that maximum potential foraging ranges during chick rearing period were 80 km. Some authors even talk about foraging trips of 150 km. In addition, in this study the mean length and range of photographed delivered fish is in conformity with the measures of the trawled fish, and furthermore many recaptures of adult common guillemots are accomplished at the north end of Öland during breeding period (RC, unpublished).
In view of this information about size of fish and feasible distances for foraging, all
corresponding with the distance between Stora Karlsö and the point where sprat examined in this study were trawled at, I conclude that common guillemots of Stora Karlsö probably feed now and then in that area, and so the analysed fish very likely is representing the feeding fish.
Changes in size of sprat
The difference in mean length of delivered fish between the 1970s (132 mm, Hedgren, 1976) and today (115-117 mm, this study) speaks for an obvious change in the size of delivered sprat, although some caution must be taken when comparing since my measurements were made on photos and on fish that had been deep-frozen. However the mean length of sprat brought to chicks in this study was nearly the same as of the trawled specimen. According to this, the mean weight of the trawled sprat, 10.3 g, probably is appropriate even for sprat delivered to chicks, and this points to the fact that mean weight of fish brought to the chicks in this study is much lower than the mean weight of 13.3 g in Hedgren (1976). This could
indicate high prey abundance in this study andlower in the 1970s, corresponding with Uttley et al. (1994) and Barrett (2002), who found that prey items were larger in poor food year, which they thought support the idea that larger mean size of fish are fed to chicks when the abundance is low.
Supporting the density-dependence hypotheses (= “The increase in pelagic fish abundance negatively affects Baltic sprat growth rate possibly via a decrease of the individual food intake”) Cardinale et al. (2002) found a significant effect of the pelagic fish abundance (sprat and herring) in the Baltic Sea on growth rates of sprat. Actually the mean weight-at-age have decreased by about 40 % from 1990 to 1998, e.g. in the age-class 1 year old from 10.4 g to 4.6 g, in 2 years old from 12.6 g to 7.6 g and in 3 years old from 14.9 g to 8.3 g (ICES, 2002). Andersson (1942) too considered growth of individual fish to be much lower in rich age-classes because of high competition for food. Competition for food in the Baltic Sea is also mentioned in Cardinale and Arrhenius (2000) and in Kornilovs et al. (2001). In rich years when there is an increase both in sprat stock and in fishing efficiency, the numbers of sprat of younger age-classes consequently increases too. This has probably great impact on the fish energy content that affects the common guillemot chicks at Stora Karlsö.
Estimations
When comparing my model results (method described in Harris and Hislop, 1978 and Hatchwell, 1991) with my results from direct measurements I found great conformity concerning sprat wet weight calculated from length and the wet weight from weighing (r = 0.94, n = 33). However the estimated mean daily energy intake using the model was as much as 502 kJ, which is twice the value estimated with the direct method, 250 kJ (see Table 2). Calculated wet weight also gives higher values of energy content for whole fish than estimations from measured dry weight. The choice of method is obviously very important. By estimating energy content (kJfish-1) from dry calorific value multiplied by dry body weight, one for example avoid problems with dehydration, which always occur while
handling the fish (Hislop et al., 1991). Hislop et al. (1991) therefore recommended the use of dry calorific values and dry weight/length relationships. Not all studies until today have used this method and this makes comparisons of the values in Table 2 uncertain. To get better comprehension of the effects of changes in fish calorific value, further studies using the most reliable method are necessary.
Energy density
Larger (longer) fish normally contents more energy than smaller (shorter), though correlation between kJfish-1 and length in this study was modest (r = 0.51). Due to larger fat content calorific value (measure of energy density) has in earlier studies also been considered to increase with size for sprat (Hislop et al., 1991; Arrhenius, 1998). The model-relationship between length and calorific value in Harris and Hislop (1978) also shows this. My study however does not show such a relationship, but on the contrary Figure 4 indicates that larger
fish has lower fat content per gram. Calorific value decreases significantly with length (see Table 1). The Harris and Hislop-model does not seem to fit the current conditions in the Baltic Sea and an implication for the common guillemots therefore seems to be to choose a larger amount of smaller prey size to deliver maximum energy to the chicks. Unfortunately they do not seem to be able to do so.
One possible explanation to the reverse length/calorific value relationship in this study could be that the result is an effect of spawning time. Larger fish are probably older and therefore spawn earlier in the period (A. Nissling, pers. com.). Consequently when the common guillemot chicks are being fed during the same period, they occasionally are fed with just spent fish having low energy content. Since sprat in the Baltic Sea spawn in April-August and the guillemots feed their chicks mainly in June they always have had to deal with varying energy density of prey fish, some still gravid before spawning, of high calorific value, and others of low or recovering caloric value after spawning (e.g. Hatchwell, 1991). These values can have a range of over 20 kJg-1. Related to variation of 1.5 g (between 1.8 g and 3.3 g) in the dry weight of sprat of the same length this is of importance for the predator, “but there is always some fish of high quality available” (Furness and Barrett, 1985; Harris and Wanless, 1985).
Another explanation could be that this is a result of food competition being more severe among older and larger fish, and as a consequence the calorific value probably gets its
maximum in smaller sizes. Most fish available at feeding schools though are juveniles, which have lower calorific values (Davoren and Burger, 1999). It can also be a matter of methods. Wet weight calculations give both positive correlations with calorific values and higher values of total energy content than dry weight calculations (see Estimations).
Mass and energy intake in relation to requirements
The daily food intake of the chicks in this study of 46.7 g seems to be in accordance with what is required in mass (Coulson and Pearson, 1985), and more than the 32 g chicks were receiving in 1972-76 (Hedgren 1976). However the daily energy intake of the chicks, averaging only 250 kJday-1, seems to be much below what is needed for maintenance and normal growth, even though my result shows that older chicks received more energy (see Figure 6). According to Coulson and Pearson (1985) a normal growth rate at 9 gday-1 implies a food intake of between 28 g and 89 g depending on the age of the chick, and an energy intake of in average 318 kJday-1. They also state that in older chicks maintenance
requirements are much greater than growth requirements. Uttley et al. (1994) estimated the energy intake required for chicks of 10 days or older to range between 360 and about 500 kJday-1.
Another approach is that a common guillemot daily food requirement is about 30 % of body mass (Hedgren, 1976 and ref. therein). For a chick of 230 g (a low fledging body weight of a Baltic guillemot chick, see Österblom et al., 2001) this would imply a daily food intake of about 76 g = 7.4 feeds, calculated on mean weight of sprat in this study. However, if this would imply sufficient energy intake depends on the energy content of the fish. With the mean energy content of 56 kJfish-1 (this study) 7.4 feeds would lead to a daily intake of 414 kJ. As the average feeds/chick/day in this study is ‘only’ 4.6, many chicks possibly have not received satisfaction of their energy requirements, even though the requirements are
depending on the chick age. Thus a decrease in energy content of sprat results in more food needed.
Common guillemots are usually able to adjust their foraging behaviour or change their chicks’ diet as response to changing abundance of traditional prey fish (e.g. Monaghan et al., 1994; Bryant, 1999; ref. in Österblom et al., 2001), but when traditional prey fish is in great abundance, though of low energy content, common guillemots very likely are not able to
compensate with increasing feeding rate (Bryant, 1999). Diet composition is a factor of great importance to provisioning rate (kJ/chick/h) (Litzow et al., 2002), but since the Stora Karlsö colony common guillemots, like other Baltic colonies, feed their chicks mainly with sprat (Hedgren, 1976; Lyngs and Durinck, 1998) they do not seem to be able to alter the
composition of their diet. ‘Specialist’ foragers like the common guillemots, which specialise on readily digestible, energy dense fish prey have a rapid and inefficient digestion strategy (Hilton et al., 2000). This strategy may restrict their ability to process less digestible foods and constrain them to select only energy-dense prey type. On the other hand according to this study they do not seem to be able to select the energy-densest size among their favourite prey species.
It is important to know the relationship between fat content and energy density of fish when estimating the chick’s energy intake and the consequences. The condition of fish varies in relation to the fat content (Robards et al., 1999; Bignert, 2002) so that low fat content implies low condition and consequently low calorific value. Thus a low calorific value of the fish, due to low fat content, leads to a low energy intake of the chick. In addition the metabolic
efficiency of the chick decreases with decreasing fat content of the fish. Since fat reduces the digestive rate and prolong the time for absorption of other nutrients, high fat content improves the nutrient input (Brekke and Gabrielsen, 1994).
The result of this study shows that the daily energy intake, 250 kJday-1, for common guillemot chicks at Stora Karlsö was subjected to a decrease of over 100 kJ compared to 1975 (Hedgren, 1976) (see Table 2). These values though must be interpreted with caution. If the earlier results from indirect methods are overestimated, the decline in chick’s energy intake then may not be conspicuous to the same extent. Harris and Wanless (1988) pointed out that “The calorific value of fish varies from year to year; therefore the calorific intake of chicks should be treated as orders of magnitude rather than absolute values”.
FINAL COMMENTS
The decline in mean energy density of sprat is probably a factor of major importance for the decreasing fledging body mass of common guillemot chicks during the 1990s. From 255 g in 1991 the mean fledging body mass declined to 233 g in 1999. Common guillemots in the Baltic Sea seems neither being able to compensate for the low weight and energy content of available prey by switching to another prey (Hedgren, 1976), nor to increase the number of feeds as chicks possibly are digesting food at a maximum rate. Because of the low energy intake among the chicks, though a normal food intake, the junk food hypothesis seems to be verified.
The connection between guillemots, sprat and zooplankton provides an interesting example of complex trophic interactions in the Baltic Sea. Since this study shows a strong correlation between sprat weight and energy content of whole fish it is of major importance for the future reproduction success of the common guillemots that mean weight of sprat doesn’t continue to decrease, as low weight often implies low fat content and low calorific value. A low level of weight-at-age in sprat that might continue to decrease would possibly influence by lower chick survival. Probably there is a threshold value of chick body weight that allows of survival (H. Österblom, pers. com.). Decreasing weight-at-age due to low fat content in sprat would also influence and decrease man fishery and marketing in that fish being unsuitable for human consumption (Cardinale and Arrhenius, 2000), and this would be unfortunate since the condition of sprat is partly depending on continued fishery.
Recently high exploitation however has resulted in a reduction of the sprat stock and mean weight-at-age have turned upwards again the last two years. The weights have increased since 1998 and the 2000-2001 estimates are 10-20% higher than the 1998 values (ICES, 2002). In
relation to this, it is of interest that preliminary results from ringing of common guillemot chicks indicate that fledging body weight now might be increasing (Österblom, pers. com.). Continued investigations and learning from the concurrence between different biotic
organisms and abiotic environmental factors is of great importance. How will for example decreased salinity level or increased temperature of the Baltic Sea water affect the spawning site and period of sprat, and to what extent will this affect the energy intake of common guillemots in the future? To continuously get useful information of the marine environment also further studies on the behaviour of marine birds, especially at sea, are necessary.
ACKNOWLEDGMENTS
I am most grateful to my supervisors, Henrik Österblom for inspiring guidance and support throughout this work, and Kjell Larsson for his valuable comments on the statistics. I am also grateful to Olof Olsson for lending me the video camera and for useful criticism on the manuscript. Great thanks goes to Anders Nissling and Magnus Petersson at The Research Station Ar for indispensable help with the fish analyses. I also would like to warmly thank fisherman Roland Pettersson for supplying me with the fish, and Karlsö Jagt- och
djurskyddsförening AB, Fredrik Sigsarve, Jonas Sundberg and Gunnar Enekvist for logistical support.
REFERENCES
Andersson, K.A. (ed) 1942. Fiskar och Fiske I Norden, Band I: 246-254. Bokförlaget Natur och Kultur. Stockholm.
Arrhenius, F. 1998. Food intake and seasonal changes in energy content of young Baltic Sea sprat (Sprattus sprattus L.). ICES Journal of Marine Science 55: 319-324.
Barrett, R.T., Asheim, M. and Bakken, V. 1997. Ecological relationships between two sympatric congeneric species, Common Murres and Thick-billed Murres, Uria aalge and
U. lomvia, breeding in the Barents Sea. Can. J. of Zoology 75: 618-631.
Barrett, R.T. 2002. Atlantic puffin Fratercula arctica and common guillemot Uria aalge chick diet and growth as indicators of fish stocks in the Barents Sea. Mar Ecol Prog Ser. 230: 275-287.
Benvenuti, S., Dall’Antonia, L. and Lyngs, P. 2001. Foraging behaviour and time allocation of chick-rearing Razorbills Alca torda at Graesholmen, central Baltic Sea. Ibis 143: 402-412.
Bignert, A. 2002. Comments Concerning the National Swedish Contaminant Monitoring Programme in Marine Biota. Swedish Museum of Natural History, Stockholm.
Birkhead, T.R. and Nettleship, D.N. 1987. Ecological relationships between Common Murres,
Uria aalge, and Thick-billed Murres, Uria Lomvia, at the Gannet Islands, Labrador. III.
Feeding ecology of the young. Canadian Journal of Zoology 65: 1638- 1649.
Bradstreet, M.S.W. and Brown, R.G.B. 1985. Feeding Ecology of the Atlantic Alcidae. Pp. 263-318 in The Atlantic Alcidae, The Evolution, Distribution and Biology of the Auks Inhabiting the Atlantic Ocean and Adjacent Water Areas. (Nettleship, D.N. and Birkhead, T.R. eds). Academic Press, London.
Brekke, B. and Gabrielsen, G.W. 1994. Assimilation efficiency of adult Kittiwakes and Brünnich’s Guillemots fed Capelin and Arctic Cod. Polar Biology 14: 279-284.
Bryant, R., Jones, I.L. and Hipfner, J.M. 1999. Responses to changes in prey availability by Common Murres and Thick-billed Murres at the Gannet Islands, Labrador. Can. J. Zool. 77: 1278-1287.
Cairns, D.K., Bredin, K.A. and Montevecchi, W.A. 1987. Activity budgets and foraging ranges of breeding Common Murres. The Auk 104: 218-224.
Cardinale, M. and Arrhenius, F. 2000. Decreasing weight-at-age of Atlantic herring (Clupea
harengus) from the Baltic Sea between 1986 and 1996: a statistical analysis. ICES Journal
of Marine Science 57: 882-893.
Cardinale, M., Casini, M., and Arrhenius, F. 2002. The influence of biotic and abiotic factors on the growth of sprat (Sprattus sprattus) in the Baltic Sea. Aquatic Living Resources, 15: 273-281.
Carscadden, J.E., Montevecchi, W.A., Davoren, G.K. and Nakashima, B.S. 2002. Trophic relationships among capelin (Mallotus villosus) and seabirds in a changing ecosystem. ICES Journal of Marine Science 59: 1027-1033.
Coulson, J. C. and Pearson, T. H. 1985. Food intake and weight increments of the Common Guillemot Uria aalge; the use of conversion rate. Ibis 127: 565-566.
Cramp, S. (ed) 1998. The Complete Birds of the Western Palearctic on CD-ROM. Oxford University Press, New York.
Curry-Lindahl, K. 1985. Våra fiskar. Norstedts.
Davoren, G.K. and Burger, A.E. 1999. Differences in prey selection and behaviour during self-feeding and chick provisioning in rhinoceros auklets. Animal behaviour 58: 853-863. del Hoyo, J., Elliott, A. and Sargatal, J. (eds) 1996. Handbook of the Birds of the World. Vol
3: 709-710. Lynx Edicions, Barcelona.
Furness, R.W. and Barrett, R.T. 1985. The food requirements and ecological relationships of a seabird community in North Norway. Ornis Scandinavica 16: 305-313.
Furness, R. W. and Camphuysen, C. J. 1997. Seabirds as monitors of the marine environment. ICES Journal of Marine Science, 54: 726-737.
Gabrielsen, G.W. 1994. Energy Expenditure in Arctic Seabirds. Ph.D. theses. University of Tromsø, Tromsø.
Hansson,S. 2001. Östersjöns fisk, i kläm mellan fiske och övergödning. Fauna och Flora 95:4. Harris, M.P. and Hislop, J.R.G. 1978. The food of young Puffins Fratercula arctica. J. Zool.,
Lond. 185: 213-236.
Harris, M.P. and Wanless, S. 1985. Fish fed to young Guillemots, Uria aalge, and used in display on the Isle of May, Scotland. J.Zool., Lond. (A) 207: 441-458.
Harris, M.P. and Wanless, S. 1988. The breeding biology of Guillemots Uria aalge on the Isle of May over a six year period. Ibis 130: 172-192.
Hatchwell, B.J. 1991. The feeding ecology of young Guillemots Uria aalge on Skomer Island, Wales. Ibis 133: 153-161.
Hedgren, S. 1975. The breeding population of Guillemot Uria aalge in the Baltic Sea. Vår Fågelvärld 34: 43-52.
Hedgren, S. 1976. On the food of the Guillemot Uria aalge at the island of Stora Karlsö, the Baltic Sea. Vår Fågelvärld 35: 287-290.
Hedgren, S. and Linnman, Å. 1979. Growth of Guillemot Uria aalge chicks in relation to time of hatching. Ornis Scandinavica 10: 29-36.
Hilton, G.M., Furness, R.W. and Houston, D.C. 2000. A comparative study of digestion in North Atlantic seabirds. Journal of Avian Biology 31:36-46.
Hislop, J.R.G., Harris, M.P. and Smith, J.G.M. 1991. Variation in the calorific value and the total energy content of the lesser sandeel (Ammodytes marinus) and other fish preyed on by seabirds. J. Zool., Lond. 224:501-517.
ICES. 2002. Report of the Working Group of Baltic Fisheries Assessment /CM2002/ACFM: 12.
Konarzewski, M., Taylor, J.R.E. and Gabrelsen, G.W. 1993. Chick energy requirements and adult energy expenditures of Dovekies (Alle alle). The Auk 110(2): 343-353.
Kornilovs, G., Sidrevics, L. and Dippner, J.W. 2001. Fish and zooplankton interaction in the Central Baltic Sea. ICES Journal of Marine Science 58: 579-588.
Köster, F.W. and Möllman, C. 2000. Trophodynamic control by clupeid predators on recruitment success in Baltic cod? ICES Journal of Marine Science 57: 310-323.
Litzow, M.A., Piatt, J.F., Prichard, A.K. and Roby, D.D. 2002. Response of pigeon guillemots to variable abundance of high-lipid and low-lipid prey. Oecologia online 7 June 2002.DOI 10.1007/s 00442-002-0945-1.
Lyngs, P. and Durinck, J., 1998. Diet of Guillemots Uria aalge in the central Baltic Sea. Dansk Orn. Foren. Tidsskr. 92: 197-200.
Monaghan, P., Wlaton,P., Wanless, S., Uttley, J.D. and Burns, M.D. 1994. Effects of prey abundance on the foraging behaviour, diving efficiency and time allocation of breeding Guillemots Uria aalge. Ibis 136: 214-222.
Monaghan, P. 1996. Relevance of the behaviour of seabirds to the conservations of marine environments. Oikos 77: 227-237.
Olsson, O., Nilsson, T. and Fransson, T. 2000. Long-term study of mortality in the common guillemot in the Baltic Sea. Swedish Environmental Protection Agency Report 5057. Robards, M.D., Anthony, J.A., Rose, G.A. and Piatt, J.F. 1999. Changes in proximate
composition and somatic energy content for Pacific sand lance (Ammodytes hexapterus) from Kachemak Bay, Alaska relative to maturity and season. Journal of Exp Mar Biol and Ecol 242: 245-258.
Robards, M.D., Rose, G.A. and Piatt, J.F. 2002. Growth and abundance of Pacific sand lance,
Ammodytes hexapterus, under differing oceanographic regimes. Environmental Biology of
Fishes 64: 429-441.
Uttley, J.D., Walton, P., Monaghan, P. and Austin, G. 1994. The effects of food abundance on breeding performance and adult time budgets of Guillemots Uria aalge. Ibis 136: 205-213.
Vuorinen, I., Hänninen, J., Viitasalo, M., Helminen, U. and Kuosa, H. 1998. Proportion of copepod biomass declines with decreasing salinity in the Baltic Sea. ICES Journal of Marine Science 55: 767-774.
Zador, S.G. and Piatt, J.F. 1999. Time-budgets of Common Murres at a declining and increasing colony in Alaska. The Condor 101: 149-152.
Österblom,H., Bignert, A., Fransson, T. and Olsson, O. 2001. A decrease in fledging body mass in common guillemot Uria aalge chicks in the Baltic Sea. Mar Ecol Prog Ser 224: 305-309.
Österblom, H. and Olsson, O. 2002. Changes in feeding behaviour and reproductive success in the Common Guillemot Uria aalge on the island of Stora Karlsö. Ornis Svecica 12: 53-62.
SAMMANFATTNING
ENERGIINTAG HOS SILLGRISSLEUNGAR, URIA AALGE, VID STORA KARLSÖ Påverkan av förändringar i Östersjön
INTRODUKTION
Studier av marina fåglars beteende kan ge användbar information om den marina miljön ur många aspekter. Särskilt Uria arter och deras matningsbeteende kan vara goda kortsiktiga indikatorer på förändringar i havens ekosystem (Zador & Piatt, 1999). I Barents hav har till exempel kommersiellt fiske av nyckelarter orsakat betydande fluktuationer i bestånden vilka gett dramatiska effekter bland toppredatorer som till exempel Uria aalge (se ref. i Barrett, 2002). Födoval, ungtillväxt och ungöverlevnad speglar miljöförändringar eftersom de svarar snabbt på förändringar av tillgång på föda och oceanografiska villkor (Barrett, 2002).
Den pelagiska fisken skarpsill, Sprattus sprattus, som både är en viktig födofisk för sillgrisslor och en kommersiell art i Östersjön har ökat starkt i antal på grund av intensivt industrifiske av torsk. Denna ökning antas bero på ett minskat predationstryck från torsken (Hansson, 2001; Kornilovs et al., 2001). Förändringar i fiskbestånden kan också vara relaterade till fiskens krav på sin omgivning (Robards et al., 2002). Temperaturförändringar och ändrade salthalter har påverkat zooplankton, skarpsillens viktigaste föda, och orsakat dramatiska förändringar i näringskedjor och ekosystem i den fria vattenmassan (Vuorinen et al., 1998). Övergödningen har stort inflytande på produktionen av zooplankton och sålunda även indirekt på skarpsillsproduktionen (t ex Hansson, 2001).
Egentliga Östersjön har upplevt avsevärda förändringar under de senaste decennierna av vilka en minskning i torskbeståndet och en dramatisk ökning av skarpsillbeståndet är särskilt
nämnvärda. Det torskdominerade systemet har ändrats till ett skarpsilldominerat system. Detta verkar ha fått konsekvenser för sillgrisslorna.
I flera studier av havsfåglars respons på varierad tillgång på bytesfisk har begränsad tillgång på denna ofta varit huvudorsak till minskad tillväxt eller minskade hoppvikter (Uttley et al., 1994; Bryant, 1999). I motsats till detta verkar den ökade mängden födofisk, med påföljande begränsad tillgång på fiskföda, ha varit ett problem för Östersjöns sillgrissleungar. Trots en ökning av matningsfrekvensen har ungarnas ’hoppvikter’ (den vikt ungen har när den lämnar boplatsen) minskat kontinuerligt under 1990-talet (Österblom et al., 2001; Österblom and Olsson, 2002).
Syftet med denna studie var att analysera om förändringarna i sillgrissleungarnas hoppvikter skulle kunna relateras till kvaliteten på deras föda. Mätningar på sillgrisslors
matningsbeteende under uppfödningstiden, och laboratorieanalyser av energidensitet hos deras huvudföda skarpsill (från ett tänkbart födosöksområde) har utförts. Denna studie presenterar också information om fisk som verkligen levererats till och ätits av Stora Karlsökolonins sillgrissleungar.
MATERIAL OCH METODER Studiearter
Sillgrissla Uria aalge
Sillgrisslekolonin vid Stora Karlsö som är den största i Östersjön, och sannolikt källan till andra kolonier, består idag av 8 000-10 000 häckande par (Olsson et al., 2000). Antalet par
har ökat stadigt under förra seklet (Hedgren, 1975) till skillnad mot vissa andra kolonier till exempel i Norska havet och Barents hav där populationerna har minskat dramatiskt under de senaste åren (ref. i Barrett, 2002).
Skarpsill Sprattus sprattus
En ökning av skarpsillbiomassan kan ha orsakat en minskning av det individuella
energiinnehållet på grund av ökad inom- och mellanartskonkurrens om föda (Cardinale and Arrhenius, 2000; Kornilovs et al., 2001). Den rådande uppfattningen är att energiinnehållet ökar med fiskstorleken och att kalorivärdet (= mått på energitäthet, kJg-1) korrelerar positivt med massa. Mellan 1986 och 1998 minskade både skarpsillens medelvikt och kondition (= åldersspecifik vikt enl. ICES). Årsmedelvikten minskade med cirka 40 % mellan 1990 och 1998 (Cardinale et al., 2002; ICES, 2002).
Bland skarpsill är den individuella variationen stor vad gäller energiinnehåll hos fisk av en viss längd under sommaren (Hislop et al., 1991) vilket bland annat beror på fettmängd och lekstatus (Robards et al., 1999). Bytesfisk i havet uppvisar ofta en årstidsbunden energicykel med en ökning av energidensiteten under födoperioderna före och efter lektiden. I samband med leken är energidensiteten låg (Arrhenius, 1998; Robards et al., 1999). Östersjöskarpsill leker mellan april och augusti, i huvudsak i maj-juli, när de har uppnått en ålder av 2-3 år (Andersson, 1942).
För skarpsill kan det mesta av variationen i kondition förklaras av täthetsberoende effekter knutna till minskning av födointaget på grund av ökning av fiskbiomassan. Även medelvikten hos strömming, Clupea harengus, har setts minska till följd av konkurrens om föda (Cardinale and Arrhenius, 2000; Cardinale et al., 2002). Övergödning har påverkat de djurplankton som utgör skarpsillens viktigaste föda negativt. En abiotisk faktor som salthalt kan också direkt eller indirekt påverka skarpsillens kondition. I ICES underavdelning (subdivision) 27, en del av västra Egentliga Östersjön, förklarade variationer i salthalten ungefär 42 % av variationen i skarpsillens kondition (Cardinale et al., 2002).
Observationer
Jag observerade matningsbeteende bland 32 häckande par sillgrisslor på en hylla cirka 35 meter över havet på västra sidan av Stora Karlsö. Observationerna gjordes bland annat med kikare och med tubkikare. Hyllan är belägen ungefär fyra meter nedanför observationsplatsen, från vilken jag kunde observera utan att störa fåglarna. Observationerna utfördes under totalt 56 timmar mellan 9 och 29 juni, 2002.
För att studera matnings- och tillsynsbeteende i detalj filmades 24 av de häckande paren från samma observationsställe med en Sony video hi8-kamera under tre heldygnsobservationer (03.00-22.00) den 17, 20 och 23 juni. 15 av dessa fåglar bar en kodad plastring runt ena tarsen och därför kunde jag identifiera kön på de vuxna i 13 par. Bland dessa gjordes mätningar på matningsgrad. Varje häckningsplats kollades på sitt innehåll (antal vuxna) var trettionde minut för att få mått på tillsynsbeteende.
Laboratorieanalyser
Då skarpsill antas vara huvudföda för Östersjöns sillgrisslor (Hedgren, 1976; Lyngs and Durinck, 1998; ref. i Österblom and Olsson, 2002), gjorde jag mina analyser endast på skarpsill. Analyserna gjordes på kommersiellt fångad fisk som trålats på cirka 45 meters djup 12 juni vid Knolls grund utanför Ölands norra udde, inom ICES SD 27 vilket troligtvis inrymmer Stora Karlsösillgrisslornas födosöksområde. Ett stickprov frystes ned omedelbart och transporterades till Forskningsstationen Ar på Gotland. Av dessa mättes och vägdes 50 fiskar och sorterades i längd- och viktklasser. Alla exemplar torkades i 60o C i 48 timmar och vägdes sedan igen (torrvikt). Av ett stickprov om cirka tio fiskar från varje längdklass
Kalorivärde (= mått på energidensiteten, kJg-1, torrvikt) beräknades enligt särskild formel, och för en jämförelse beräknades även våtvikt och kalorivärde utifrån längd enligt formel
beskriven i Harris and Hislop (1978). Varje unges dagliga födo- och energiintag uppskattades utifrån antalet svalda fiskar ur respektive längdklass.
För att se om de vuxna sillgrisslorna fiskade selektivt testade jag det trålade stickprovet mot den levererade fisken med avseende på fördelningen på de olika storleksklasserna.
RESULTAT
Totala antalet matningar under de tre filmdagarna (51 ungdagar) var 233. Medelantalet matningar per unge var 4.6 dag-1 (SE = 0.21). De flesta matningarna utfördes på morgnarna. Medelantalet matningar per timme var 0.24 (SE = 0.02). En födosökstur varade i genomsnitt i 228 minuter. Den kortaste uppmätta turen varade i 25 minuter och den längsta i 12,5 timmar. Båda vuxna i ett häckande par var tillsammans på boplatsen i medeltal under 29 % av tiden som spenderades på hyllan under dagen. Under natten stannade endast en förälder på hyllan. Medellängden på den trålade fisken var 117 mm (SD = 7.8, SE = 1.5, omfång 104-136, n = 50) och medelvikterna var för våtvikt 10.26 g respektive torrvikt 2.49 g. Medellängden på den fisk som ungarna matades med (den levererade, uppmätt på 6 foton) var 115 mm.
Medelkalorivärdet för respektive längdklass var: liten 23.24 (SD = 1.7, SE = 0.6, n = 8), mellan 22.47 (SD = 1.5, SE = 0.4, n = 14) och stor 21.67 kJg-1 (SD = 1.3, SE = 0.4, n = 11). Det totala medelkalorivärdet var 22.39 kJg-1 (SD = 1.57, SE = 0.3, omfång 19.75-24.83, n = 33). Kalorivärdet hos skarpsillen korrelerade negativt med längden, vilket är det motsatta förhållandet mot det i Hislop et al., 1991 där de större fiskarna hade högre energidensitet. Totala energiinnehållet per fisk i de olika längdklasserna var i medeltal 56 kJfish-1 (SD = 13.7, SE = 2.4, n =33).
Det var ingen skillnad mellan de trålade och de levererade fiskarna med avseende på hur de fördelade sig på de olika storleksklasserna.
Ungarnas genomsnittliga dagliga födointag var 46.7 g vilket gav ett medelenergiintag på 250 kJdag-1 (SD = 85, SE = 12, omfång 102-450). Äldre ungar, åtminstone upp till 15 dagars ålder, verkade ha ett större energiintag (r = 0.36, P = 0.01, n = 51).
DISKUSSION
Sillgrisslornas matningsbeteende i denna studie liknar det i Österblom och Olsson (2002), det vill säga med hög matningsfrekvens och en relativt stor andel av dagen tillbringad på
bohyllan. Detta kan indikera att föräldrarna skulle kunna mata mer om ungarna orkade äta mer. Energiinnehållet i skarpsillen och det beräknade dagliga energiintaget för ungarna stödjer idén att de minskande hoppvikterna har sitt ursprung i förändringarna i Östersjömiljön och den uppkomna minskningen av skarpsillens energivärde.
En genomsnittlig födosökstur i denna studie varade nästan dubbelt så lång tid som under år 1998 (Österblom och Olsson, 2002). Korta födosöksturer anses indikera god tillgång på födofisk. Skillnaden i födosökstid kan alltså vara tecken på att ökningen av skarpsillbeståndet har bromsat upp, vilket också ICES fångstsiffror pekar på (ICES, 2002). Möjligen fiskade fler av sillgrisslorna långt från Stora Karlsö 2002 till exempel 50 km bort som vid Ölands norra udde (se avsnittet om skarpsill) jämfört med 1998, just på grund av sämre tillgång på fisk i närheten av kolonin.
Sillgrisslors tillsynsbeteende är en indirekt men värdefull indikator på förändringar i
fiskbestånd och ekosystems hälsotillstånd (Harris and Wanless, 1985; Zador and Piatt, 1999). I den här studien var de båda vuxna i ett häckande par tillsammans som mest under 68 % av tiden som spenderades på hyllan (medel 29 %). Detta kan jämföras med 32 % (Harris and Wanless, 1985), 24.2 % (Zador and Piatt, 1999) och 22.6 % (Österblom and Olsson, 2002). Eftersom mängden bytesfisk ökade under 1990-talet beror troligtvis inte nedgången i sillgrissleungarnas hoppvikter på brist på mat. Att döma av den stora andel tid som
spenderades på hyllan skulle sillgrisslorna kunna leverera mer fisk. Detta skulle emellertid troligen inte öka ungarnas hoppvikter eftersom sillgrissleungarna verkade äta så mycket de klarar av att smälta. Vid ett par tillfällen vägrade en unge ta emot mer fisk, vilket även sågs i Nordnorge 1983 där födofisk antogs finnas i överflöd (Furness and Barrett, 1985). Hatchwell (1991) fann också att en ökning av matningsfrekvensen över ett visst tröskelvärde inte gav någon mätbar effekt på ungens tillväxt.
Att kalorivärdet sjunker med ökad fisklängd i den här studien, i motsats till tidigare
vedertagna resultat, kan ha sin förklaring i att de större fiskarna leker tidigt under perioden därför att de är äldre (A. Nissling, direkt samtal). En annan förklaring skulle kunna vara att konkurrensenom föda är större bland äldre och större fiskar. Följaktligen uppnår
energidensiteten sina högsta värden i mindre storlekar, även om de flesta tillgängliga fiskarna i stimmen är juveniler vilka inte har uppnått så höga kalorivärden (Davoren och Burger, 1999). Eftersom skarpsillen i Östersjön leker mellan april och augusti och sillgrissleungarna matas i juni kommer de alltid att stöta på fisk med lågt kalorivärde då detta är som lägst genast efter leken (t ex Hatchwell, 1991).
Sillgrissleungarnas dagliga födointag i den här studien på 46.7 g verkar stämma överens med vad som krävs (Coulson and Pearson, 1985) och är mer än de 32 g ungarna fick 1972-76 (Hedgren 1976). Emellertid verkar det genomsnittliga dagliga energiintaget på 250 kJdag-1, från 4.6 fiskar, vara mycket under vad som behövs för normal tillväxt. En viss försiktighet måste dock iakttas när det gäller att dra slutsatser av värden på energiintag eftersom olika beräkningsmetoder kan ge värden av olika storleksgrader.
Fiskens kondition varierar med fettinnehållet (Robards et al., 1999; Bignert, 2002) på sådant sätt att lågt fettinnehåll medför lågt kalorivärde. Sålunda leder lågt fettinnehåll hos fisken till lågt energiintag för sillgrissleungen, och dessutom till låg metabolisk effekt eftersom denna sjunker hos ungen med sjunkande fettinnehåll i fisken (Brekke och Gabrielsen, 1994). Sambandet mellan sillgrisslor, skarpsill och zooplankton är ett intressant exempel på en komplex näringsväv i Östersjön. Nedgången i skarpsillens energidensitet är antagligen en betydelsefull faktor för minskningen av sillgrissleungarnas hoppvikter. Sillgrisslorna i Östersjön verkar varken kunna kompensera för skarpsillens låga vikt och energiinnehåll genom att ändra bytesfisk, då skarpsill sedan länge utgör huvudfödan (Hedgren, 1976), eller genom att öka antalet matningar, eftersom ungarna troligen smälter födan så snabbt det går. Inte heller verkar de vuxna fåglarna kunna välja bytet selektivt med avseende på storlek. Då denna studie visar ett starkt samband mellan skarpsillens vikt och energiinnehåll är det mycket viktigt för sillgrisslornas framtida reproduktionsframgång att skarpsillens medelvikt inte fortsätter att sjunka, eftersom låg vikt innebär låg fetthalt och följaktligen låg
energidensitet. Fortsatt sjunkande skarpsillsvikter skulle antagligen föra med sig låg
ungöverlevnad för sillgrisslorna då det troligen finns ett gränsvärde på deras kroppsvikt för överlevnad (H. Österblom, direkt samtal).