Product- and process development
Tutor, Billerudkornsäs: Magnus Björklund Tutor, Mälardalens University: Bengt Gustafsson 1st Examiner: Mikael Johnsson
2nd Examiner: Janne Carlsson
Academy for Innovation, Design and Technology
The effect of humidity and
temperature on paper properties
Malin Elvin
2021-06-04
Bachelor thesis work Basic level, 15 credits
ABSTRACT
The study was performed at Billerudkorsnäs at the section Box Lab which offers knowledge and solutions for packaging. Paper that can be used to create packaging interacts with the surrounding environment, but has only been tested for a few climates. This thesis aims to investigate more climates and see how paper is affected by humidity and temperature and try to determine the cause of the results.
The methods used to measure this was primary tensile test and moisture content analysis but also a test to evaluate creep was performed in climates with high humidity. From this, the mechanical properties of the paper were calculated. The test was performed in a climate chamber and the choice of methods was limited by what could be performed in the climate chamber. The materials tested were chosen to give a good representation of what is commonly used in the containerboard business. The climates for testing were selected from the ability of the climate chamber as well as interesting climates for the company.
The results show that the papers are weakest at high RH, but the results indicate that the temperature solely impacts the properties of the paper. The highest moisture content does not necessarily mean the lowest value for a chosen property. The causes for the results are not clear since the patterns found are not bound to a certain quality but rather to paper in general. Therefore, more research on the area is suggested to try to determine what causes the material to react to temperature.
Keywords
PREFACE
This thesis was the final assignment at Mälardalens University to withhold a Bachelor of Science in Engineering with a focus on product- and process development. The work was made in collaboration with Billerudkornäs at Gruvön Mill in Grums, Sweden.
I would like to begin by thanking my tutors at the company Magnus Björklund, Christophe Barbier and Mikaela Arvidsson who has supported me throughout the work and for giving me the opportunity to conduct the work at Billerudkorsnäs.
My gratitude also goes to Bengt Gustafsson, my tutor at Mälardalens University who has offered knowledge and encouragement during the work.
I would also like to send my thoughts to my father who introduced me to the area of paper and awoke my interest for the engineering trade.
Eskilstuna, May 2021 Malin Elvin
Table of Contents
1. INTRODUCTION ... 1
1.1. COMPANY BACKGROUND ... 1
1.2. BACKGROUND ... 1
1.3. PROBLEM STATEMENT ... 2
1.4. PURPOSE AND AIM ... 2
1.5. LIMITATIONS ... 2
2. METHODOLOGY ... 3
2.1. ANALYTICAL METHODOLOGY ... 3
2.1.1 Literature review... 3
2.2. EXPERIMENTAL METHODOLOGY ... 3
2.2.1 Choice of test environments ... 4
2.2.2 Monitoring of climate ... 4
2.2.3 Choice of qualities ... 5
2.2.4 Conditioning of material ... 5
2.2.5 Tensile test ... 5
2.2.6 Creep ... 5
2.2.7 Moisture content and moisture ratio ... 6
2.2.8 Reference Values... 7 3. THEORETICAL FRAMEWORK ... 8 3.1. PAPER ... 8 3.2. FIBRES ... 8 3.2.1 Cellulose ... 9 3.2.2 Hemi-cellulose ... 9 3.2.3 Lignin ... 9 3.3. PULPING ... 9 3.3.1 Mechanical pulping ... 9 3.3.2 Chemical Pulping ... 10 3.3.3 Semi-chemical pulping ... 10 3.3.4 Recycled fibres ... 10 3.4. PAPERMAKING PROCESS ... 11
3.5. CONVERTING TO CORRUGATING BOARD ... 12
3.6. MECHANICAL PROPERTIES... 13 3.6.1 Tensile strength ... 13 3.6.2 Tensile stiffness ... 14 3.6.3 Elongation ... 14 3.6.4 Creep ... 14 3.6.1 Geometric Mean ... 15
3.7. THE EFFECT OF HUMIDITY ON PAPER ... 15
3.8. THE EFFECT OF TEMPERATURE ON PAPER ... 17
3.9. SUMMARY ... 18 4. RESULTS ... 19 4.1. MOISTURE ... 19 4.2. TENSILE STRENGTH ... 20 4.2.1 Tensile Strength 90% RH ... 20 4.2.2 Tensile Strength 50% RH ... 21 4.2.3 Tensile Strength 20% RH ... 21 4.2.4 Normalized Strength Vs. MR ... 22 4.3. TENSILE STIFFNESS ... 23 4.3.1 Tensile Stiffness 90% RH ... 23 4.3.2 Tensile Stiffness 50% RH ... 23 4.3.3 Tensile Stiffness 20% RH ... 24 4.3.4 Normalized Stiffness Vs. MR ... 24 4.4. ELONGATION ... 25 4.4.1 Elongation 90% RH ... 25 4.4.2 Elongation 50% RH ... 25 4.4.3 Elongation 20% RH ... 26 4.5. CREEP ... 26 5. ANALYSIS ... 27 6. DISCUSSION ... 29 7. CONCLUSION ... 31 8. FURTHER RESEARCH ... 32 REFERENCES ... 34 APPENDIX ... 36
TABLE OF FIGURES
Figure 1: Isochronous creep curve. ... 6
Figure 2: Primary structure of cellulose. ... 9
Figure 3: Papermaking machine, overview. With courtesy of Billerudkorsnäs ... 11
Figure 4: The three directions of paper. ... 12
Figure 5: Different types of corrugated board. With courtesy of Billerudkorsnäs. ... 12
Figure 6: Tensile test paper strip with definitions. Redrawn from M. Ek, G. r. Gellerstedt, and G. Henriksson (2009c, p. 31) ... 13
Figure 7: Force-elongation curve. ... 13
Figure 8: Three creep curves at different stress. Redrawn from Ek et al. (2009c, p. 50) ... 15
Figure 9: Hysteresis phenomenon ... 16
Figure 10: Moisture content vs temperature, results from test on kraft paper. Redrawn from Skogman and Scheie (1969) ... 17
Figure 11:Temperatures effect on paper at constant moisture content. Redrawn from Wink (1961) ... 17
Figure 12: Moisture Content 90% RH ... 19
Figure 13: Moisture Content 50% RH ... 20
Figure 14: Moisture Content 20% RH ... 20
Figure 15: Tensile Strength Index MD 90% RH ... 21
Figure 16: Tensile Strength Index CD 90% RH ... 21
Figure 17: Tensile Strength Index MD 50% RH ... 21
Figure 18 : Tensile Strength Index CD 50% RH ... 21
Figure 19: Tensile Strength Index MD 20% RH ... 22
Figure 20 : Tensile Strength Index CD 20% RH ... 22
Figure 21: Normalized Tensile Strength vs. MR ... 22
Figure 22: Tensile Stiffness Index MD 90% RH ... 23
Figure 23: Tensile Stiffness Index CD 90% RH ... 23
Figure 24: Tensile Stiffness Index MD 50% RH ... 23
Figure 25: Tensile Stiffness Index CD 50% RH ... 23
Figure 26: Tensile Stiffness Index MD 20% RH ... 24
Figure 27: Tensile Stiffness Index CD 20% RH ... 24
Figure 28: Normalized Stiffness vs. MR ... 24
Figure 30: Elongation CD 90% RH ... 25 Figure 31: Elongation MD 50% RH ... 25 Figure 32: Elongation CD 50% RH ... 25 Figure 33: Elongation MD 20% RH ... 26 Figure 34: Elongation CD 20% RH ... 26 TABLE OF TABLES Table 1:Test Environments ... 4
Table 2: Chemical composition of two different wood types ... 8
Table 3: Paper name in graphs ... 19
Table 4: Normalized creep stiffness ... 26
TABLE OF EQUATIONS Equation 1: Normalized creep stiffness ... 6
Equation 2:Moisture content ... 6
Equation 3:Moisture Ratio ... 7
Equation 4: Moisture Ratio in relation to Moisture Content ... 7
Equation 5: Tensile strength ... 13
Equation 6: Tensile Strength Index ... 14
Equation 7: Tensile stiffness ... 14
Equation 8: Tensile stiffness Index ... 14
Equation 9: Geometric Mean ... 15
Equation 10: Calculation of RH. ... 15
ABBREVIATIONS
α Creep parameter
b Width
BKL Brown Kraft Liner CD Cross Machine Direction
Tensile Stiffness Tensile Stiffness Index ε Elongation
εT Maximum elongation at break
F Force
FT Maximum force
ISO International Organization for Standardization
l Length
∆l Change in length
𝑚 mass in grams before drying
𝑚 mass in grams after drying to constant mass MC% Moisture Content
MD Machine Direction MR Moisture Ratio
NSSC Neutral Sulphite Semi-Chemical
P Property
RF Recycled fibre fluting RH Relative Humidity SC Semi-Chemical
Maximum slope for the force elongation curve Tensile Strength
Tensile Strength Index
w Grammage
WTKL White Top Kraft Liner ZD Out of plane direction
1
1. INTRODUCTION
The company background, as well as the general background of this thesis, is presented first which will lead to the problem statement and research questions. Lastly, the limitations of the work are presented.
1.1. Company background
The company Billerudkorsnäs is a leading supplier of renewable packaging materials and solutions. Their ambition is to “challenge conventional packaging for a sustainable future” (Billerudkorsnäs, 2021a). By merging the two companies, Billerud and Korsnäs in 2012, the company today named Billerudkorsnäs more than 150 years of experience in the forestry and paper industry.
One part of the company is the section called Box Lab which offers packaging knowledge and guidance for packaging solutions which is located at Gruvön Mill in Grums, Sweden. The lab is equipped with a climate chamber which enables testing on various materials in a controlled environment that simulates reality (Billerudkorsnäs, 2021b). This section is where the work took place.
1.2. Background
It is known that paper interacts with the surrounding environment, but the studied climates are few. The standard climate that paper usually is studied in is 23ºC and 50% relative humidity(RH) according to ISO 187 (International Organization for Standardization [ISO] 1990). To get a better understanding of how both temperature and relative humidity interact with paper a broader range of climates needs to be studied. This information could then help understand the material better as well as creating more suitable packaging.
Climates that could appear naturally are mostly RH above 50% all the time with the only exception for the desert climate that can go under 20% RH (Ek et al., 2009c, p. 115). This shows how the RH can vary depending on location and that there is a variation in the climates that appear naturally and therefore a broader range of test climates would reflect this better. Linvill and Östlund (2014) claim that no study has attempted to explore the effect on the tensile, mechanical response of paper caused by temperature and that there is a need for further experiments on the combination of moisture and temperatures effect on paper. This indicates that there is an area yet to be explored.
2 1.3. Problem statement
The knowledge gap that is described in the background has led to a vague understanding of how paper properties are affected by humidity and especially temperature in non-standardized climates. This could be of great importance when investigating how different types of packaging perform when exposed to a certain climate in a specific part of the world. This information is of great importance to create durable and environmental-friendly packaging.
This thesis will contribute to the understanding of the behaviour of paper in non-standard testing climates and could, later on, form the basis for further research with a more in-depth approach.
1.4. Purpose and aim
The purpose of this report is to gather information about the mechanical properties when tested in non-standardized test environments and attempt to define what could be plausible causes for the results. This information can later be used to optimize different types of packaging for the needs of the customers. The thesis aims to gather information about a selection of paper qualities to find what could be the causes for the results.
This led to the formulation of the following research questions:
RQ1: How are the mechanical properties of paper affected by temperature and humidity in non-standard climates?
RQ2: What could be the causes of the results?
1.5. Limitations
The materials tested were only paper used for production of corrugated board due to the extent of this study. The possible test environments were limited by the ability of the climate chamber in which the testing took place. The size of the study is also limited by which of all available test methods could be performed in the accurate climate to evaluate the mechanical properties. Preferably, a compression test would have been performed since that information is more important when calculating the box compression strength (McKee, Gander, & Wachuta, 1963). The study was also limited by the amount of material available at the time, therefore not every material was tested in every climate.
3
2. METHODOLOGY
The following chapter is divided into two sections where the first part touches upon the methods used to conduct the analytical part. The second section describes the methods used to conduct the experiments.
2.1. Analytical methodology
The research is of experimental form to explore and gather information about paper and how it is affected by relative humidity and temperature. To try to find the cause-and-effect the independent variable was set to temperature and relative humidity and the dependent variable was the mechanical properties as well as moisture content (Säfsten, Gustavsson, & Ehnsiö, 2020).
The study started with a literature review to gather an understanding of what material there was on the subject and what it might predict the results to be. In the next chapter, it will be described more thoroughly how the information was collected.
2.1.1 Literature review
The main keywords that were used for the search of the literature were humidity (or relative humidity), temperature, tensile strength, paper, and mechanical properties. From that, a collection of articles and books was gathered using both the library search Primo as well as other databases provided by the university library. Google was also used to find literature but was later found through other databases to confirm their trustworthiness. Some articles lead to others by using snowballing (Säfsten et al., 2020). The relevant literature was structured in an excel sheet with short notes about each one of them. After that, a few main pieces of literature were chosen as the starting point and more literature was added when necessary. Some relevant literature was already in the possession of the author and was not searched for like the other literature. The literature is a combination of books and articles. An age span was not set since a lot of relevant research on the subject was made around 1960.
2.2. Experimental methodology
The following chapter describes the methodology used to conduct the experiment. The methods are based on what the company uses in the standard climates.
4 2.2.1 Choice of test environments
The climates were selected from the ability of the climate chamber where the test was to be performed as well as input from the company of interesting climates. Due to a limited amount of material, not all qualities were tested in all environments. What material should be tested in which environment was discussed with the company. The resulting test environments consisted of four different temperatures combined with three different RH with the standard environments included. From this, a total of 10 climates were set. In table 1 some cells are marked in red to visualize that those climates will not be tested.
Table 1:Test Environments
2.2.2 Monitoring of climate
The climate was monitored and logged during the whole test period. This to ensure that the climate was stable during the conditioning as well as when performing the tensile test. Since the climates are non-standard climates, the variation according to standard ISO 2233 (Standardization, 2000) is allowed to ± 5 % RH and ± 2 ºC.
RH% Temperature ºC 20 50 90 5 X X X 13 X X 20 X X 33 X X X
5 2.2.3 Choice of qualities
Based on the focus of the department for which the study is performed the paper qualities were chosen from liner and fluting to match their business area. This was discussed with the company to ensure that there could be samples available at the time of the testing. The paper was chosen to give a good representation of what is commonly used for packaging and also to be able to find possible causes of eventual variations. The qualities chosen were brown kraft liner (BKL), white top kraft liner (WTKL), semi-chemical fluting (SC), and recycled fibre fluting, in this paper referred to as RF.
2.2.4 Conditioning of material
All of the materials were pre-conditioned according to ISO 187 (ISO, 1990). For this study, the conditioning time of the material was set to a minimum of 16 hours. This was discussed with the company and it was considered to be enough time for the samples to reach equilibrium between the sample and the atmosphere. According to the standard, 4 hours usually are enough for the paper if there is good air circulation. Storage of the material before conditioning for the test was in 23ºC and 50% RH.
2.2.5 Tensile test
The mechanical information about the papers was collected by doing a tensile test. The samples used are cut out with a width of 15 mm. The number of samples for the tensile test is 10 in MD and 10 In CD which becomes a total of 20 samples for each quality and climate. The tensile test was performed according to ISO standard 1924-3 (ISO, 2005) with a constant rate of elongation with a speed of 100 mm/min. The data collected is used to calculate tensile strength, tensile stiffness and the elongation up to break. The data collected is then run through a Matlab code provided by the company to obtain the values for tensile strength and stiffness along with the 95% confidence interval. The elongation of the paper is available directly from the test program without additional calculations.
2.2.6 Creep
The creep test was performed in the climates with 90% RH with one quality. The amount of samples is the same as for tensile test, 10 in MD and 10 in CD.
The creep test takes place under approximately 17 minutes with a constant load of ½, 1/3 respectively 1/6 of the tensile strength. From the test program, text files with data are created. These files are run through a MATLAB code provided by the company to get creep values that
6
are of interest. Through curve fitting, the time dependence of the determination is captured using a power law with a single parameter, called α. (Internal Billerudkorsnäs standard)
This parameter can be used to construct an isochronous creep curve at time t0, i.e. the relationship
between the strain expected after exposing a paper to a certain stress during time t0 (Panek,
Fellers, & Haraldsson, 2004). The creep stiffness is calculated using equation 1. In figure 1, a typical isochronous curve is represented. The initial slope of the isochronous curve is called the creep stiffness. A higher creep stiffness means that the deformation of the paper will be lower at same load level. By normalizing the creep stiffness, it can be estimated how much stiffness that has been lost compared to if there was no creep.
Equation 1: Normalized creep stiffness
𝑁𝑜𝑟𝑚𝑎𝑙𝑖𝑧𝑒𝑑 𝐶𝑟𝑒𝑒𝑝 𝑠𝑡𝑖𝑓𝑓𝑛𝑒𝑠𝑠 𝑎𝑓𝑡𝑒𝑟 𝑡 𝑠𝑒𝑐𝑜𝑛𝑑𝑠 = 1 (1 + 𝑡)
2.2.7 Moisture content and moisture ratio
This test is to determine the moisture content in a sample piece. The moisture content (MC%) expressed as a percentage mass fraction can be calculated with the equation 2.
Equation 2:Moisture content
𝑀𝐶%= 𝑚 − 𝑚
𝑚 × 100
7
m0 is the mass of the test piece, in grams, before drying.
m1 is the mass of the test piece, in grams, after drying to constant mass (ISO, 2008).
The specimen was weighed after being conditioned for at least 16 hours. The samples were then sent to another lab at the area for drying in an oven at a temperature of 105 ºC. And then measured again. An additional drying will be made and weighed again to ensure that it has been dried properly. This is the procedure as described in standard 638 (ISO, 2008).
Another measure that can be used to express the amount of moisture in a paper is moisture ratio (MR) and is calculated with equation 3. The relation to MC is presented in equation 4. This measure is a linear measure of the amount of water in a paper (Ek et al., 2009c, p. 111).
Equation 3:Moisture Ratio
𝑀𝑅 =𝑚 − 𝑚 𝑚
m0 is the mass of the test piece, in grams, before drying.
m1 is the mass of the test piece, in grams, after drying to constant mass.
Equation 4: Moisture Ratio in relation to Moisture Content
𝑀𝑅 = 𝑀𝐶%
100 − 𝑀𝐶%
2.2.8 Reference Values
To normalize the results and show percental change the value for 20ºC and 50% RH was used. For those qualities not tested in the climate linear curve fitting was used to estimate the values.
8
3. THEORETICAL FRAMEWORK
This chapter begins with general information about paper and the pulping processes to give an understanding of the material itself. Thereafter, the mechanical properties of paper that are important for this study are presented. Lastly, the influence of humidity and temperature on paper will be presented.
3.1. Paper
Paper is a material commonly made of fibres from wood but could also come from other cellulose-containing materials. This thesis focuses on wood-based papers only. Paper can be produced from virgin fibres or it could be made from recycled paper (Jerzy, 2017). According to Jerzy (2017) paper is defined to be material which has lower or equal to a grammage of 225 g/m2
and above that it could be categorized as cardboard. Paper belongs to the group polymer materials and has viscoelastic properties.(Fellers, Norman, & Westerlund, 1996, p. 283)
3.2. Fibres
Wood fibres consists of three major organic substances which are cellulose, hemicellulose and lignin. Softwood has longer fibre and is used when creating long fibre pulp. Hardwood, on the other hand, has shorter fibres and the pulp is therefore called short fibre pulp. The pulping process for the two fibre types is usually different and they also have different properties. Hence, the pulps are often mixed to achieve suitable properties. (M. Ek, G. Gellerstedt, & G. Henriksson, 2009a)
The wood types also have different chemical compositions with different amounts of the three major components mentioned earlier. The distribution of these are presented in table 2. Johansson (2011) states that the length of the fibres is one of the most important properties for paper strength, but the thickness of the fibre wall also is important.
Table 2: Chemical composition of two different wood types
Wood Type Fibre length [mm] Cellulose [%] Hemi-cellulose [%] Lignin [%]
Temperate Softwood 2,5-4,5 40-45 25-30 25-30
9 3.2.1 Cellulose
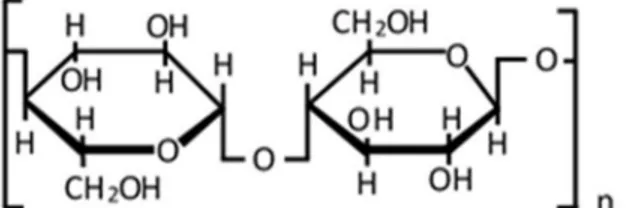
Cellulose is the main component in the cell walls of wood. The function is to reinforce the fibre and can do so because of its high stiffness and fibrillar structure. It is a linear unbranched polymer with covalent glycosidic bonds between the glucose monomers. Figure 2 shows the primary structure of cellulose. The hydroxyl group (-OH) in the cellulose interacts with water which is discussed further in chapter 3.7 The effect of humidity on paper. (Fellers et al., 1996)
3.2.2 Hemi-cellulose
Hemi-Cellulose is a branched polysaccharide and consists of several monomers but varies depending on what type of wood. The task of hemicellulose is to give flexibility to the material and is also considered to act as a glue between cellulose and lignin. (Fellers et al., 1996, p. 49)
3.2.3 Lignin
Lignin is the component in wood that gives it its “woody” properties as Ek et al. (2009a) express it. It is a hydrophobic polymer that fills up between the hemicellulose and cellulose and fixates them. Lignin is not linear like cellulose but is built up more like a 3D-web (Ek et al., 2009a, p. 122).
3.3. Pulping
Two main pulping processes are used, mechanical and chemical pulping. There is also a third one that is common which is Semi-chemical pulping. The three processes give the pulp and the paper different properties. They could also be mixed to achieve certain properties.
3.3.1 Mechanical pulping
With this type of pulping the yield is very high, around 96-98%. The groundwood process starts with logs that are treated with a rotating grindstone. This causes the fibres and fragments of fibres to be torn from the wood. Another process uses a refiner to break out fibres and fibre fragments from woodchips by working them between refiner discs. These two are the main processes that have given rise to several variants with the most distinguished variations in temperature at preheating and processing of the wood. The mechanical pulp has a high amount of lignin and a
10
mix of fibres, fibre fragments and fines. Mechanical pulp is suitable e.g. for newspaper because of its high capacity but cannot be used in e.g. liner that has high strength demands. In the bleaching process for mechanical pulp, the goal is to bleach the pulp without losing the lignin. Usually, the bleaching is performed by using hydrogen peroxide or hydrosulphite. (M. Ek, G. Gellerstedt, & G. Henriksson, 2009b)
3.3.2 Chemical Pulping
In this process, the lignin is removed to release the fibres. The most dominant process is Kraft cooking where sodium hydroxide and sodium sulphide are used. Another process, sulphite cooking, uses sulphurous acid and bisulphite ions. The fibres that are chemically pulped are more flexible than the ones mechanically pulped.
The small amounts of lignin that is left after the pulping process makes the fibres brownish and needs to be bleached to obtain a white finish. This could be made in several ways, but the most common today is to use oxygen, chlorine dioxide or hydrogen peroxide which all decrease the amount of lignin in the paper to make it brighter. Since the sulphite pulp is brighter after the cooking stage it needs less bleaching than the kraft pulp to obtain full brightness (Ek et al., 2009b).
3.3.3 Semi-chemical pulping
Semi-chemical process or neutral sulphite semi-chemical (NSSC) is commonly used for fluting which is the corrugated middle layer in corrugated board. This is pulp in between the mechanical- and chemical pulp. The process is made with a sulphite solution with a neutral pH and relatively low energy is used compared to the mechanical pulp. (Persson, 1996)
3.3.4 Recycled fibres
There are three main steps in the recovered paper production; Repulping, removal of contaminants (e.g. glue, metal objects and ink) and bleaching.
The fibres can come from a various range of products such as newspapers and packaging paper. There has been discussion about how many times fibres can be reused and there is no clear answer. It has been shown losses of bonding properties because the fibres are less prone to swell when recycled. (Ek et al., 2009b)
11 3.4. Papermaking process
Paper can be produced using only fibres but usually, some additives are used as well to obtain certain properties. The paper machine consists of several components which each has its own task including forming, dewatering, press and at last drying (Persson, 1996). Mainly it could be divided into two parts: the wet end and the dry end (Ek et al., 2009b). In figure 3 an overview of a paper machine is presented. The wet end is from the start up to the drying section and from there it is the dry end.
The first step, forming, is where the fibres are placed in a certain direction in the network. It is easiest to get the short fibres to align nicely. Long fibres cling to each other more easily and can create bunches of fibres called flocks instead of nice alignment. The fibre orientation that is considered tight depends on which quality is referred to. It is the orientation of the fibres that makes the paper anisotropic in plane (Jerzy, 2017).
Dewatering can be done by either filtration or thickening. The binding force between the fibres will increase with the increasing dryness.
In the pressing step as much water as possible need to be removed for economic reasons. Time is also an important factor when it comes to limited press flow. The last step is drying, where the paper will dry to about 90-95%. This will cause the fibres to shrink, and how much depends on what fibres are used. If the fibres are crossed the shrinking will lead to the paper being stronger in tensile- or compressive load. This is because the shrinkage will make more fibres tensioned and therefore active and carries a load. Since more fibres will take load the strain of the individual fibre will be less. (Persson, 1996)
12
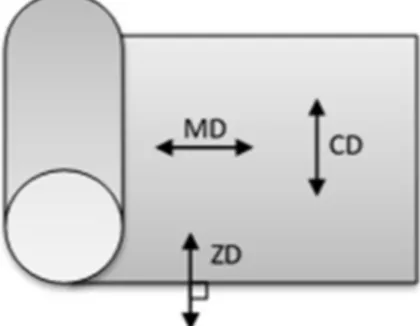
It is from the making of paper and the paper machine the definition of directions is determined. Machine direction (MD) is along with the machine and cross machine direction (CD) is as the name suggests is the cross-machine direction (Fellers et al., 1996, p. 28). The thickness of the paper is the out-of-plane direction (ZD). This is visualised in figure 4.
3.5. Converting to corrugating board
Corrugated boards usually consist of three layers of paper; two layers of liner and one layer of fluting. It could also consist of more layers of both fluting and liner as well as only one layer of fluting and one of liner. These are illustrated in figure 5 with a) single face board, b) single wall board, c) double wall board, d) triple wall board. The mid-layer is fluted to create the wave-like form and is glued onto the other papers that are flat. The corrugated board follows the beam principle and therefore more bending stiffness can be obtained compared to a solid board with the same weight. After the paper has been converted to a corrugated board it can be cut and creased to create different types of boxes and packaging.(Ek et al., 2009c, p. 259)
Figure 5: Different types of corrugated board. With courtesy of Billerudkorsnäs. a)
b)
c)
d)
13 3.6. Mechanical properties
When performing a tensile test, a load will be applied to a specimen until the break. The definitions of a paper strip used is described in figure 6. The length l is the initial length, b is the width of the test piece, w is the grammage often expressed as gram per square metre. In addition to this it is of course the force F that is applied during the test and the change in length ∆l. The results will be a force-elongation curve which is illustrated in figure 7. Where FT is the maximum
force and εT is the maximum elongation at break. The units presented in the following chapters
are collected from standards.
3.6.1 Tensile strength
The tensile strength 𝜎 , is calculated as the maximum force 𝐹 , related to the width 𝑏, of the test piece and is expressed in kN/m (Standardization, 2005). This is expressed in equation 5.
Equation 5: Tensile strength
𝜎 =𝐹 𝑏 Elongation, ε Force, F FT εT
Figure 7: Force-elongation curve.
Figure 6: Tensile test paper strip with definitions. Redrawn from M. Ek, G. r. Gellerstedt, and G. Henriksson (2009c, p. 31)
14
However, this measure does not consider the grammage of the paper. Another measure, the tensile strength index 𝜎 , responds better to the use of paper in practice. The tensile index is expressed as kNm/kg. This is expressed in equation 6, where w is the grammage in g/m2.
Equation 6: Tensile Strength Index
𝜎 =1000𝐹 𝑏𝑤
3.6.2 Tensile stiffness
Another measure that will be analysed is the tensile stiffness 𝐸 . With help of Matlab the mean maximum slope, 𝑆̅ , for the force elongation curve is calculated to use in equation 7.
Equation 7: Tensile stiffness
𝐸 =𝑆̅ 𝑙 𝑏
Were l being the initial test length of the test piece and b is the width of the test piece.
As for the tensile strength, this measurement does not take the grammage into consideration and another measure could be used, the tensile stiffness index 𝐸 . This is presented in equation 8 where w is the grammage in g/m2.
Equation 8: Tensile stiffness Index
𝐸 =𝐸
𝑤
3.6.3 Elongation
The elongation is measured at the tensile test in percentage with a standard deviation. Since every test piece has a clamping length of 100 mm the result is presented in percentage. This describes the length change of the test piece until break.
3.6.4 Creep
Creep is another property that can be measured, and it is when the elongation increases with time when a specimen is maintained at a constant load (Fellers et al., 1996).
15
The creep can be recorded as seen in figure 8 with strain recorded as a function of time but can also be presented as an isochronous-stress strain curve instead (see figure 1). By doing this the first part, which is linear, corresponds to the linear viscoelastic behaviour. The second part which is non-linear corresponds to the non-linear viscoelastic behaviour.
3.6.1 Geometric Mean
To evaluate the mechanical properties for the paper not based on the direction of the fibres. The geometric mean is calculated using equation 9 where P is the chosen property (Wahlström, 2013).
Equation 9: Geometric Mean
𝐺𝑒𝑜𝑚𝑒𝑡𝑟𝑖𝑐 𝑚𝑒𝑎𝑛 𝑜𝑓 𝑐ℎ𝑜𝑠𝑒𝑛 𝑝𝑟𝑜𝑝𝑒𝑟𝑡𝑦 = 𝑃 ∗ 𝑃 3.7. The effect of humidity on paper
Relative humidity (RH) can be calculated with equation 10.
Equation 10: Calculation of RH.
𝑅𝐻 = 𝑝𝑎𝑟𝑡𝑖𝑎𝑙 𝑣𝑎𝑝𝑜𝑢𝑟 𝑝𝑟𝑒𝑠𝑠𝑢𝑟𝑒 𝑚𝑎𝑥𝑖𝑚𝑢𝑚 𝑣𝑎𝑝𝑜𝑢𝑟 𝑝𝑟𝑒𝑠𝑠𝑢𝑟𝑒
It could also be estimated using equation 11.
Equation 11: Alternative calculation of RH.
𝑅𝐻 ≈ 𝑘𝑔 𝑣𝑎𝑝𝑜𝑢𝑟 / 𝑘𝑔 𝑑𝑟𝑦 𝑎𝑖𝑟 𝑘𝑔 𝑣𝑎𝑝𝑜𝑢𝑟 / 𝑘𝑔 𝑠𝑎𝑡𝑢𝑟𝑎𝑡𝑒𝑑 𝑎𝑖𝑟
Figure 8: Three creep curves at different stress. Redrawn from M. Ek, G. r. Gellerstedt, and G. Henriksson (2009c, p. 50)
16
When adsorption of moisture into the cellulose fibres happens, or in other words when water diffuses into paper, it is done with an exothermal process. Therefore, the cellulose will at a given RH have lower moisture content at a higher temperature. Depending on how high RH, the paper will take up water in different ways. At low RH the adsorption takes place on the surface and it is the OH-group of the molecules that bind the water. At slightly higher RH it is still surface, but it is swelling of the fibres like gel that causes it. At very high RH the larger capillaries of the fibres are filled with liquid and the adsorption happens by capillary condensation. (Fellers et al., 1996, pp. 337-345)
However, the humidity will generally increase the moisture content in paper. Marin (2020) found a linear relation of moisture ratio and the mechanical properties when performing a test on paperboard in 23 ºC with varied RH. This for example means that the strength will decrease with an increased moisture ratio. Paper will eventually turn back into pulp if it gets wet. This is because the moisture weakens the bonds between the fibres which are created in the paper-making process(Jerzy, 2017).
The moisture decreases the strength of the paper. Jerzy (2017) states that the optimal moisture rate is 7%. Studies show that the strength of paper decreases 50% when the moisture content is 14% which can be obtained by conditioning the paper at 90% RH. Małachowska, Dubowik, Boruszewski, Łojewska, and Przybysz (2020) strengthen this by concluding that an increase of relative humidity will decrease the strength properties.
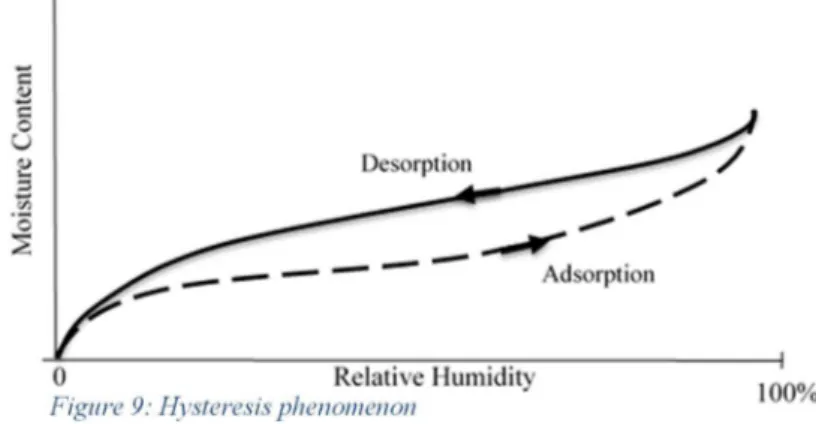
In figure 9, a simplified hysteresis curve is presented. This shows that paper will have different moisture content at a given RH depending on if there is adsorption or desorption. The smallest difference between adsorption and desorption is found at very high and very low levels of humidity. The adsorption curve always lies slightly lower than the desorption curve. (Ek et al., 2009c)
17 3.8. The effect of temperature on paper
According to Skogman and Scheie (1969) the moisture content will be at its highest between 0ºC and +5ºC, figure 10. This was the case for all the used RH% from 30% up to 95%. Their range of temperature was between -20ºC to +20ºC. The experiment was made on Kraft paper, but it indicates how other paper qualities might behave in similar environments. Jerzy (2017) strengthens this by claiming that in humid and cold conditions the highest level of moisture is absorbed.
Wink (1961) on the other hand brings up temperatures effect on its own at constant moisture content. Note that the relative humidity may vary to achieve the same moisture content around 6%. The percentage loss of tensile strength is 25% going from a temperature of 15.5ºC (60ºF) to 48.8ºC (120ºF) which can be seen in figure 11. In the figure stretch, tensile energy absorption and apparent modulus is presented as well. The stretch increase with increased temperatures and apparent modulus decreases with increased temperature. The energy absorption behaves slightly different and increase at first to then decrease again at higher temperatures but has in the end increased compared to the starting temperature. The study was performed with five different paper qualities including kraft, rag, sulphite and two types of newsprint.
This indicates it is not only the moisture content that affects the mechanical properties but rather a combination of both moisture and temperature. Małachowska et al. (2020) say that higher temperature will weaken the paper which strengthens Winks tests. However, it is hard to say why paper reacts to temperature the way it does. All of the above says that differences appear but does not investigate further what the reason could be.
Figure 11:Temperatures effect on paper at constant moisture content. Redrawn from Wink (1961)
Figure 10: Moisture content vs temperature, results from test on kraft paper. Redrawn from Skogman and Scheie (1969)
18 3.9. Summary
From the literature that has been studied a few assumptions can be drawn for the outcome of the test. Firstly, the highest moisture content should appear in climates with 5ºC no matter the RH (Skogman & Scheie, 1969), but papers made from mechanical pulp will have higher moisture content than the rest. Since there are no pure mechanically pulped papers in the study it could be assumed that it might show in the semi-chemical pulped paper.
It could be assumed that there will be lower moisture content in higher temperatures because of the exothermal process which strengthens the findings by Skogman and Scheie (1969).
Depending on the RH the moist will be taken up by the paper in different ways and could therefore affect the paper differently.
The recycled material could be weaker than the other because the bonding is assumed to be weaker because the fibres are less prone to swell.
According to Wink (1961) the tensile strength will decrease 25% with a temperature rise of 33,3ºC.
19
4. RESULTS
All of the measured properties will be presented individually for clarity. The results are presented with all the qualities in the same graph. The papers are presented with only letters. In table 3 it can be seen which letter belongs to which paper. The grammage used to index the results are the given grammage of the paper and was not measured at the time of the testing.
Table 3: Paper name in graphs
A Semi-chemical fluting (SC) B White top kraft liner (WTKL) C Brown kraft liner (BKL) D Recycled fibre fluting (RF)
4.1. Moisture
This is not a mechanical property of the paper but the results play an important role in understanding the impact of moisture compared to temperature. Therefore, the moisture content is individually presented in the following section. These results are then used frequently to present the following mechanical properties.
At 90% RH, the moisture content is relatively stable for each quality with a slight increase at 33ºC for every quality except WTKL which increases at 13ºC and then decreases at 33ºC. This is presented in figure 12.
20
The pattern seen at 90%RH does not continue at 50% RH. Instead, all the papers decrease in moisture content from 5ºC to 20ºC as seen in figure 13. The difference is rather small with 0,4-0,6 percentage points. There is an even smaller decrease or none from 20ºC to 33ºC. For 20% RH, the results are more sprawling but decrease when the temperature increases up to 20ºC and begin to increase again at 33ºC. This is presented in figure 14.
The distribution of the different qualities follows the same pattern for all RH. The recycled fibre fluting generally has the lowest moisture content and the others are very close to each other.
4.2. Tensile Strength
The tensile strength is presented in groups divided by the RH%. Lastly, a combined graph is presented to show the relation between the normalized strength and the moisture ratio. The error bars represent the 95% confidence interval.
4.2.1 Tensile Strength 90% RH
For the climates with 90% RH, all the qualities decrease in strength with increased temperature, presented in figure 15 and 16. There are significant losses for all the qualities when comparing the results for 5ºC with 33ºC in both MD and CD. The same pattern is found if looking at the geometric mean presented in Appendix A. The strength loss in percentage compared to 20ºC 50% RH are quite large for 33ºC slightly under 45% in MD. The losses at 5 ºC in MD are smaller with a loss around 20-25%. The graphs for percentage change are found in Appendix E.
Figure 14: Moisture Content 20% RH Figure 13: Moisture Content 50% RH
21 4.2.2 Tensile Strength 50% RH
The climates with 50% RH, presented in figure 17 and 18, follow the same pattern as for those with 90% RH. The strength loss is not as large as in 90% RH. The geometric mean found in Appendix A also shows this.
4.2.3 Tensile Strength 20% RH
In the 20% RH climates presented in figure 19 and 20, the pattern is not as clear as for the other climates since it does not necessarily decrease in strength with increased temperature. The SC also becomes stronger but in the CD direction at 13 ºC, but not significantly stronger. The paper becomes stronger in this RH compared to 20ºC and 50% RH. Nevertheless, there is a trend that the strength decreases at higher temperature since all qualities in both directions are weakest at 33 ºC, except from the recycled fibre fluting that has the same strength at 33 ºC as for 5 ºC.
Figure 16: Tensile Strength Index CD 90% RH
Figure 18 : Tensile Strength Index CD 50% RH Figure 15: Tensile Strength Index MD 90% RH
22 4.2.4 Normalized Strength Vs. MR
The following graph in figure 21 shows the strength normalized to the value at 20 ºC and 50% RH in relation to MR. The coefficient of determination is R2 =0,7713. In the graph all the
qualities are presented in both MD and CD. A similar graph with the qualities printed out can be found in Appendix D.
Figure 20 : Tensile Strength Index CD 20% RH
Figure 21: Normalized Tensile Strength vs. MR Figure 19: Tensile Strength Index MD 20% RH
23 4.3. Tensile stiffness
The tensile stiffness is presented in groups divided by the RH%. The error bars represent the 95% confidence interval. The percentage change for tensile stiffness is found in Appendix F.
4.3.1 Tensile Stiffness 90% RH
Figure 22-23 shows a clear decrease in tensile stiffness for all the qualities in both directions when the temperature increases. The greatest loss occurs in the recycled fibre fluting in both MD and CD. The same pattern appears when looking at the geometric mean, Appendix B.
4.3.2 Tensile Stiffness 50% RH
The pattern at 90% RH continues for 50% RH as seen in figure 24-25. The loss is not as large for any quality as it was at 90 % RH, but they all decrease with increased temperature.
Figure 25: Tensile Stiffness Index CD 50% RH Figure 23: Tensile Stiffness Index CD 90% RH Figure 22: Tensile Stiffness Index MD 90% RH
24 4.3.3 Tensile Stiffness 20% RH
As for the strength, the results for 20% RH, presented in figure 26-27 are not as clear as for the previous climates. In CD, there is still a loss in tensile stiffness for each quality with the increased temperature. Compared to the values from 20ºC and 50% RH the stiffness of the paper increases a few percent depending on the temperature. The graphs for percentage change are found in Appendix F.
4.3.4 Normalized Stiffness Vs. MR
The graph in figure 28 shows the stiffness normalized to the value at 20 ºC and 50% RH in relation to MR. The coefficient of determination is R2 =0,7833. In the graph all the qualities are
presented in both MD and CD. A similar graph with the qualities printed out can be found in Appendix D.
Figure 27: Tensile Stiffness Index CD 20% RH
Figure 28: Normalized Stiffness vs. MR Figure 26: Tensile Stiffness Index MD 20% RH
25 4.4. Elongation
The elongation of the paper is presented in groups divided by the RH%. In every RH, WTKL has the highest elongation in both MD and CD. The error bars represent the standard deviation. The geometric mean for all of the RH is found in Appendix C.
4.4.1 Elongation 90% RH
The elongation presented in figure 29-30 does not follow a distinct pattern as the previous mechanical properties. It varies between the qualities and could go either up or down or maintain stable. In CD, there is a tendency that the elongation increases with increased temperature for all the qualities. There is no significant difference for on quality in different temperatures.
4.4.2 Elongation 50% RH
Unlike for 90% RH, there is a tendency for a pattern at 50% RH. There is an increase in the elongation when the temperature increases for every quality in both directions, seen in figure 31-32, with the exception for WTKL and recycled fibre fluting in MD, but there is no significant difference of the elongation within one quality.
Figure 30: Elongation CD 90% RH
Figure 32: Elongation CD 50% RH Figure 29: Elongation MD 90% RH
26 4.4.3 Elongation 20% RH
When down at 20% RH the pattern yet again disappears. However, there are no signs that the elongation would decrease at 33ºC compared to the lowest temperature at 5ºC. The elongation is lower than for the other RH, but the WTKL still has the highest elongation which is seen in figure 33-34.
4.5. Creep
Creep was only measured for one quality, SC, at the 90% RH climates. The normalized creep stiffness after 10 days is presented in table 4. The value α used to calculate the creep stiffness can be found in Appendix G. The values that stand out is for 5 ºC in CD that has greater loss than the rest1.
Table 4: Normalized creep stiffness
MD CD
Temperature Ecreep10/Eb Standard deviation Ecreep10/Eb Standard deviation
5 ºC 46,5% 3,8% 33,5% 3,2%
13 ºC 50,5% 4,7% 41,1% 3,9%
33 ºC 44,0% 2,9% 40,6% 3,3%
1 The tests for the climate with 5 ºC in CD would have been re-made under other circumstances with more time
since the results differs more than expected.
Figure 34: Elongation CD 20% RH Figure 33: Elongation MD 20% RH
27
5. ANALYSIS
For 50% RH and 20% RH the highest moisture content appears at 5ºC as for Skogman and Scheie (1969), but in the highest tested RH, it appears either at 13ºC or 33 ºC. However, the differences are very small at high RH and it is hard to draw any conclusions. Due to the exothermal process that appear when moisture is absorbed in cellulose fibres (Fellers et al., 1996) the paper should have a lower moisture content in higher temperature at a given RH. Temperature does seem to have a larger impact on the moisture content at low RH.
The differences in moisture content between the qualities are relatively small except for the recycled fibre fluting that has significantly lower MC in both 90% RH and 50% RH. This could be an effect of the inability of the fibre to swell like new fibre products and therefore are less prone to collect moisture.
At higher temperatures, the strength and the stiffness are lower compared to low temperatures no matter the RH. This result, in combination with the previous one indicates that it is not only the moisture that affects the mechanical properties. The elongation does not seem to be affected by the temperature the same way it is seen for the other properties. Since both the stiffness and the strength decrease with increased temperature it indicates that the temperature itself influences the paper and those properties. This behaviour appears on every quality which means the cause is not bound to a specific aspect in paper but rather connected to any paper at all. This strengthens the findings by Wink (1961) that showed a 25 % loss in strength when increasing the temperature from 15.5ºC (60ºF) to 48.8ºC (120ºF). Since the methods used for that research was based on maintaining a stable moisture content it is hard to compare the exact percentage to the results from this study where the moisture content varies but the RH remains stable. Nevertheless, the RH seems to have a larger impact on the properties than the temperature. The effect of temperature also seems to be larger at higher RH and the paper weakens with increased RH which is consistent with the statement by Małachowska et al. (2020). This indicates that it depends on the combination of the two how great the impact they have on the mechanical properties.
The linear relation that Marin (2020) found does not appear as strongly neither in strength or stiffness when the climates do not only vary in humidity but in temperature as well. This strengthens the previous statement that temperature influences mechanical properties due to a softening of the material and not only due to change in moisture absorption.
28
The creep results had one value that stood out from the rest. The cause for this is unclear. It could be an error from some part of the test, but it should have shown. The climate was stable during the test and could not be the cause. The creep does not seem to be affected by the temperature as clearly as the other mechanical properties.
29
6. DISCUSSION
The testing methods for the experimental part of this study were selected in consultations with supervisors from the company. Compression testing had to be excluded because the equipment could not be placed in the climate chamber where the tests needed to be performed. The paper could not be transferred to this equipment without changing its condition in both humidity and temperature. This would lead to invalid results and would not add anything to the research. It would have been valuable to perform since the results from compression testing is an important factor to calculate the box compression strength (McKee et al., 1963).
If the reference point is set to 20 ºC and 50% RH which was used to normalize the values as well as for the percentage change, the papers become stronger at lower temperatures and weaker at higher temperatures. A stronger paper does not affect a box negatively whilst a weaker paper could have severe consequences. As seen from the climate chart of possible climates the warm and moist climates are the most common. This means the performance of the box in the lab environment might not match the true performance. The loss in strength and stiffness will impact the performance of a packaging. In practice, it could mean a packaging does not withstand the predicted load when exposed to another climate than tested in.
The climates at low RH% was not as stable as it should have been, and this could have affected the outcome of the results. The rise of RH happened rather quickly during the test. How much moist the test pieces might have absorbed is impossible to say. However, the adsorption curve slope is flatter at lower RH than higher and is lower than the desorption curve. This means the moisture content does not increase as much in low RH as compared to high RH. The results were presented as if the climates were upheld. This needs to be taken into consideration when viewing the results. Nevertheless, all the test pieces were conditioned in the right climates.
The grammage used to index the results was the given grammage of the quality and was not measured at the time of the testing. This could have had a little effect on the index values presented.
As said in the analysis the climates with high humidity and temperature seem to affect the paper the most. However, this did not mean the highest moisture content. Therefore, it makes it hard to believe that it is the water itself that is mostly affected but rather other components of the
30
paper that react to temperature. This thesis does not cover all of the chemistry behind papermaking, and it is therefore hard to draw any conclusion or even give a qualified guess.
31
7. CONCLUSION
To conclude, the findings for the first research regarding how the mechanical properties are affected by humidity and temperature, the results show that stiffness and strength suffer losses with increased temperature no matter the RH for all qualities, with only a few exceptions. The effect of moisture on paper is known from before, though the results indicate the temperature solely affects the properties as well. The highest content does not directly mean the lowest value for the mechanical property. However, creep does not seem to be affected as clearly as the other properties. The change in mechanical properties of paper need to be taken into consideration when making a packaging since it will affect the properties of a packaging as well.
Moving on to the second research question what the cause for the results may be is a bit unclear, but the effect of temperature does not seem to be bound to a certain quality but rather paper in general. However, it seems like the combination of high RH and high temperature has the largest impact even though it does not always mean the highest moisture content. The question what aspect in paper causes the results is harder to determine since few researchers have explored this area before and there needs to be a deeper analysis of the chemical components of the paper to draw any further conclusions.
32
8. FURTHER RESEARCH
The following chapter has been divided into smaller parts for clarity.
Complementing testing methods
Since not all sorts of test to evaluate the mechanical properties could be performed it would be valuable to add more types of tests to gather additional information to get a broader understanding of the behaviour. Especially compression test would be valuable since those results are of great importance when calculating box compression test(McKee et al., 1963).
Broader range of climates
This thesis does not investigate how the paper is affected in below zero temperatures. This would be interesting to investigate since some corrugated boards are for example used in freezers. In contrast to this, higher temperature would be interesting to investigate as well since the results show losses in strength in higher temperatures. If the results at even higher temperatures follow the same pattern, it may be possible to find an explanation to the behaviour for all temperatures. Another interesting research point would be to explore how the behaviour of paper differs when exposed to a series of different climates. How much strength is lost and how much will the moisture content be affected? To complement this hysteresis curves at different temperatures could also be made.
Testing corrugated board and packaging
Even though paper is the base for corrugated board and later packaging it also needs to be tested. Other things could be evaluated as well such as how the glue is affected by temperature.
More creep
The creep property was only investigated for the climates with high RH and one quality. This would preferably be extended in further research to gather as much information about this property as any other mechanical property of paper.
33 Breaking point
There was an indication that the temperature solely could affect the paper. However, it is clear that moisture mostly has a larger impact than temperature. If there is a change in hierarchy, it would be interesting to try to find the breaking points when one is more important than the other. If this could be found it would be easier to predict the behaviour of paper when the largest impact factor in certain climates is known. More research needs to be done to examine the effect of temperature more thoroughly to see how much impact the temperature itself can have on paper. When that is determined there would be a chance to determine what aspects in the paper-making process can impact the outcome of the effect of temperature.
34
REFERENCES
Billerudkorsnäs. (2021a). About Us. Retrieved from https://www.billerudkorsnas.com/about-us
Billerudkorsnäs. (2021b). Our Story. Retrieved from https://www.billerudkorsnas.com/about-us/our-story
Ek, M., Gellerstedt, G., & Henriksson, G. (2009a). Pulp and Paper Chemistry and Technology. Volume 1, Wood Chemistry and Wood Biotechnology. Berlin ;: De Gruyter.
Ek, M., Gellerstedt, G., & Henriksson, G. (2009b). Pulp and Paper Chemistry and Technology. Volume 2, Pulping Chemistry and Technology. Berlin ;: De Gruyter. Ek, M., Gellerstedt, G. r., & Henriksson, G. (2009c). Pulp and Paper Chemistry and
Technology. Volume 4, Paper Products Physics and Technology. Berlin: Walter de Gruyter.
Fellers, C., Norman, B., & Westerlund, Ö. (1996). Pappersteknik. Stockholm: Kungliga Tekniska Högskolan.
Jerzy, F. L. (2017). Paper in architecture: Research by design, engineering and prototyping. A+BE (Delft.)(19), 1-534. doi:10.7480/abe.2017.19
Johansson, A. (2011). Correlations between fibre properties and paper properties. (Master thesis).KTH, Retrieved from
https://www.diva-portal.org/smash/get/diva2:505453/FULLTEXT01.pdf
Linvill, E., & Östlund, S. (2014). The Combined Effects of Moisture and Temperature on the Mechanical Response of Paper. Experimental Mechanics, 54.
doi:10.1007/s11340-014-9898-7
Małachowska, E., Dubowik, M., Boruszewski, P., Łojewska, J., & Przybysz, P. (2020). Influence of lignin content in cellulose pulp on paper durability. Scientific Reports, 10(1), 19998. doi:10.1038/s41598-020-77101-2
Marin, G. (2020). On the relation between paperboard properties and packaging performance. (Degree of Licentiate of Engineering ). KTH Royal Institute of Technology
Stockholm, Sweden. Retrieved from
http://kth.diva-portal.org/smash/record.jsf?pid=diva2%3A1508084&dswid=6047 (Paper A)
McKee, R. C., Gander, J. W., & Wachuta, J. R. (1963). Compression Strength Formula for Corrugated Boxes. Paperboard Packaging(August).
Panek, J., Fellers, C., & Haraldsson, T. (2004). Principles of evaluation for the creep of paperboard in constant and cyclic humidity. Nordic Pulp & Paper Research Journal, 19(2), 155-163. doi:10.3183/npprj-2004-19-02-p155-163
Persson, K.-E. (1996). Papperstillverkning. Markaryd: SUM AB.
Skogman, R. T., & Scheie, C. E. (1969). The effet of temperature on the moisture adsorption of kraft paper. Papper och trä, 4a, 259-261.
Standardization, I. O. f. (1990). ISO 187. In Paper, board and pulps - Standard atmosphere for conditioning and testing and procedure for
monitoring the atmosphere and conditioning of samples
Switzerland
Standardization, I. O. f. (2000). ISO 2233. In Packaging — Complete, filled transport packages and unit loads — Conditioning
for testing
35
Standardization, I. O. f. (2005). ISO 1924-3. In Paper and board — Determination of tensile properties
Switzerland.
Standardization, I. O. f. (2008). ISO 638. In Paper, board and pulps — Determination of dry matter content — Oven-drying
method Switzerland
Säfsten, K., Gustavsson, M., & Ehnsiö, R. (2020). Research methodology : for engineers and other problem-solvers: Studentlitteratur AB.
Wahlström, T. (2013). Torbjörn Wahlström. Advances in Pulp and Paper Research, 673–710.
Wink, W. A. (1961). The effect of relative humidity and temperature on paper properties. Tappi, 44(6), 171A-178A.
36
APPENDIX
Appendix A
37
Appendix B
38
Appendix C
39
Appendix D
40
Appendix E
41
Appendix F
42
Appendix G
Values of α.
MD CD
Temperature α Standard deviation α Standard deviation
5 ºC 0,056 0,006 0,080 0,007
13 ºC 0,051 0,007 0,065 0,007