1(3)
SAFETY ASSESSMENT OF ROAD FACILITIES THROUGH
VISUALIZATION OF DANGEROUS DRIVING BEHAVIOR IN SEOUL
CITY BUS
Kapuku Kapuku Christian Seoul National University
1, Gwanak-ro, Gwanak-gu, Seoul, South Korea
Phone: + 82-2-880-7362 E-mail: christian.kapuku@gmail.com
Co-authors(s); Young-Hyun Seo, Seoul National University; Seung-Young Kho, Seoul National University; Dong-Kyu Kim, Seoul National University.
1.
INTRODUCTION
Buses are common sight in Seoul. According to the Seoul Open Data Plaza, a public data service of Seoul, about 7,482 city buses (including main, local, express, circular, and nightrider buses) were operated on 355 routes as of 2015. The number of passengers was estimated at 1.6 billion per year, with a daily average of 4.4 million passengers. Bus as a transport mode, accounts for about 27% of total modal share in Seoul, which makes it the second most used transport mode after the subway. In 2015, there were an estimated 1,412 city bus accidents, in which 22 people were reported killed and 2,076 injured.
Many measures have been taken in terms of safety to minimize accidents, including installing special devices on buses to automatically collect drivers’ dangerous driving behavior data. In fact, unlike the subway in which cars move along fixed tracks and in a regular speed, dangerous driving occurs more frequently with buses due to the complex mixed traffic environment in which they operate, which involves a lot of attention and maneuvers. Such dangerous behaviors include sudden start, sudden stop, and sharp turn and most of them occur during lane changes. Also, as exclusive median bus lanes are operating on many main arterial roads in Seoul, entering or exiting these exclusive bus lanes may cause dangerous driving behavior which also have adverse effects on traffic flow.
Considering this facts, driver’s dangerous driving behaviors may not only be caused by the driver’s condition (such fatigue, psychology) itself, but also and more importantly, they represent a reaction to the driving environment conditions, including road facilities and their elements and characteristics such as geometry, road width and lanes, signal system and more. In other worlds, by analyzing dangerous driving behaviors of several drivers in a large scale as well as their relationship with their environment, the causes can be detected and locations for safety improvements can be predicted.
Therefore, the purpose of this study is to evaluate the safety of road facilities such as geometry, road width and signal system by analyzing the frequent occurrence of dangerous driving behaviors on buses.
2.
LITERATURE REVIEW
Ziari and Khabiri analyzed the characteristics of the bus accident using bus accident data from 2000-2004. They developed the accident prediction model and derived the relation between traffic volume and accident rate. The number of bus accidents decreased after increasing until 2002 and the accident rate with passenger cars was the highest. Most of the accident types were right angle collisions.
2(3)
Zegeer et al. analyzed that most of the bus accidents were collision accidents and right angle collisions, which were related to road surface condition, bus service years, and green signal time. They conclude that exclusive bus lane contributes to the reduction of traffic accidents.
3.
METHOD
3.1. Data
City bus DTG data and commercial vehicle accident data are used to analyze dangerous driving behavior in this study. DTG data include date, time, vehicle number, dangerous driving behavior, latitude and longitude. The commercial vehicle accident data in TAAS (Traffic Accident Analysis System), include the time and the location of the accident, the accident details, the type of accident, the weather condition, and the road surface condition. Road safety facilities data are used to analyze the relationship between facilities and bus accidents. Bus route data, coordinate of bus stop, and operation status of exclusive bus lane are also utilized.
3.2. Analysis and Tools
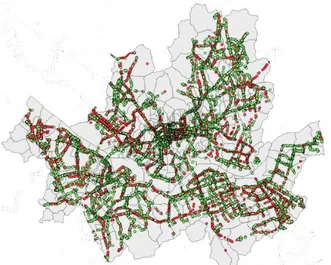
The quantity and nature of data used in this research requires to combine several approaches and tools for analysis. Geostatistical techniques are used to analyze DTG data collected at different points of the network. Behaviors have been grouped into dangerous and normal behaviors for more than 10 types of behaviors. A visualization tool is being developed using QGIS software. Others statistical computations are performed using R programing environment.
Figure 1: Visualization of Sudden start behavior locations collected by the on board bus equipment (Red spots are dangerous and green spots are normal).
4.
EXPECTED RESULTS
By analyzing the dangerous driving behavior of buses, the number of bus accidents, their severity and their locations can be visualized. This can review the new installation or supplementation of road facilities at the accident spots. It is possible to predict potential accident zones by evaluating the safety of road facilities. In addition, it is possible to propose policies such as change of bus stops or minimum lane change distance to minimize inevitable dangerous driving behavior (such as those caused by lane changes for entering and exiting exclusive median bus lanes). This study is ongoing. The results of the first part on the analysis of dangerous behaviors is being finalized. The next step will involve the analysis of accident and its correlation with dangerous driving behaviors. Final results are expected to be available on January 2018 considering other data acquisition such as on accident as well as their analysis.
3(3)
REFERENCES
Zegeer, C. V., Huang, H. F., Stutts, J. C., Rodgman, E., & Hummer, J. E. (1994). Commercial bus accident characteristics and roadway treatments. Transportation Research Record, 1467.
Ziari, H., & Khabiri, M. M. (2006). Analysis characteristics and provide a prediction model of public bus accident in Tehran. J. Journal of Applied Science, Vol. 6, No. 2, pp. 247-250.