Rune Karlsson
Viktor Bernhardsson
Calibration report
Samgods version 1.1.1
VTI notat 4A-2018
|
Calibr
ation r
eport. Samgods v
www.vti.se/en/publications
VTI notat 4A-2018
Published 2018
VTI notat 4A-2018
Calibration report
Samgods version 1.1.1
Rune Karlsson
Viktor Bernhardsson
Authors’: Rune Karlsson, VTI
Viktor Bernhardsson, VTI, http://orcid.org/0000-0003-0767-5169 Reg. No., VTI: 2016/0135-7.1
Publication; VTI notat 4A-2018
Cover pictures: Mostphotos och Hejdlösa Bilder AB Published by VTI, 2018
Preface
This report contains a summary of the adjustments performed during the calibration of the national model for freight transportation in Sweden (Samgods v 1.1.1). Petter Wikström has been the contact person from the principal Trafikverket (Swedish Transport Administration). Rune Karlsson and Viktor Bernhardsson have performed the calibration work including parameter adjustments, simulation runs and documentation. The work has been performed in close cooperation with Trafikverket.
Linköping, March 2018
Andreas Tapani Project leader
Quality review
Internal peer review was performed on 26 January 2018 by Magnus Johansson. Rune Karlsson has made alterations to the final manuscript of the report. The research director Andreas Tapani examined and approved the report for publication on 9 March 2018. The conclusions and recommendations expressed are the authors’ and do not necessarily reflect VTI’s opinion as an authority.
Kvalitetsgranskning
Intern peer review har genomförts 26 januari 2018 av Magnus Johansson. Rune Karlsson har
genomfört justeringar av slutligt rapportmanus. Forskningschef Andreas Tapani har därefter granskat och godkänt publikationen för publicering 9 mars 2018. De slutsatser och rekommendationer som uttrycks är författarnas egna och speglar inte nödvändigtvis myndigheten VTI:s uppfattning.
Table of contents
Summary ...7
Sammanfattning ...9
1. Introduction ...11
2. Input data changes in Samgods 1.1.1 compared to Samgods 1.1 ...12
3. New calibration ...16
4. New features and program updates ...18
5. Comparisons between model results and statistics...19
5.1. The distribution of tkm over modes ...19
5.2. Sea ...19
5.3. Rail ...21
5.4. Road ...22
5.5. The Öresund bridge, the Kiel Canal and Skagerrak ...23
5.6. Growth factors ...24
5.7. Elasticities ...25
References ...27
Appendix A Calibration parameters ...29
Appendix B ASEK 6 values in the Vehicles Parameters table ...43
Appendix C Differences between Samgods 1.1 and Samgods 1.0 ...47
Summary
Calibration report. Samgods version 1.1.1
by Rune Karlsson (VTI) and Viktor Bernhardsson (VTI)
The Samgods model is used for describing and analyzing the Swedish goods transportation system on an overall national level. The Swedish Transport Administration is responsible for its maintenance and development. The current version 1.1, from 1 April 2016, is planned to be replaced by version 1.1.1 in April 2018.
In this report, changes made from version 1.1 to 1.1.1 in the model are described, as well as the effects these changes have on the more important output from the model. In version 1.1.1, new cost input data has necessitated a recalibration of the model and new values for the calibration parameters have been produced. In principle, the same types of calibration parameters are used in the new version as in the previous one. Particular focus is on the deviations between model output and the statistical data being used as calibration targets. Comparisons of these deviations between versions 1.1 and 1.1.1 are also presented.
Sammanfattning
Kalibreringsrapport. Samgods version 1.1.1
av Rune Karlsson (VTI) och Viktor Bernhardsson (VTI)
Samgodsmodellen är en modell för att beskriva och analysera det svenska godstransportsystemet på en övergripande nationell nivå. Trafikverket ansvarar för förvaltning och utveckling av modellen. Den nuvarande version 1.1, utgiven 1 april 2016, planeras ersättas av version 1.1.1, 1 april 2018.
I notatet beskrivs de förändringar som gjorts i Samgodsmodellen från version 1.1 till version 1.1.1 och de effekter dessa förändringar haft när det gäller de viktigaste utdatavariablerna. I version 1.1.1 har framför allt nya kostnadsindata gjort det nödvändigt att kalibrera om modellen och nya
kalibreringsparametrar har tagits fram. I princip används samma typ av kalibreringsparametrar i den nya versionen som i den tidigare. Speciellt fokus ligger på avvikelserna mellan modellberäknade resultat och de statistiska data som använts som kalibreringsmål. I notatet beskrivs även hur dessa avvikelser förändrats från version 1.1 till version 1.1.1.
1.
Introduction
The purpose of this report is to describe the various activities performed in Samgods version 1.1.1 with the aim to calibrate the base year scenario (named Base2012) and perform quality control of the associated forecast for 2040 (named Main2040). This Base2012 scenario will represent the base year in the release of Samgods 1.1.1 in April 2018.
This work is a follow-up of a corresponding calibration report for Samgods 1.1 published in December 2015, see (Sala & Edwards, 2015). Any changes described here refers to updates made after Samgods 1.1. Since some readers may instead be interested in differences between the current version and the previous major version (i.e. Samgods 1.0), descriptions of differences between Samgods versions 1.1 and 1.0 can be found in Appendix C. Overall, the revisions made in Samgods 1.1.1 are relatively small as compared to the ones made in Samgods 1.1.
The calibration of Samgods 1.1.1 has been motivated by input data revisions and bug fixes carried out after the previous version. This report describes these updates as well as the final calibration
parameters and the deviation between the final model output and the calibration targets. Calibration of a complex model like Samgods is a non-trivial task. There are a number of
considerations to take into account. Firstly, which calibration targets should be selected and what degree of importance should be imposed on each of these? There is a large amount of output data to choose among. One guiding principle has been to use validation data that are reliable. Another one is that data should be of general importance for the type of analyses that the model usually is applied to. There is also a constrain that the results should not deviate too much compared to the results obtained from Samgods 1.1. unless there are good reasons and obvious explanations for this.
Secondly, which calibration parameters should be used? For Samgods 1.1.1, the same sets of calibration parameters are available as in Samgods 1.1. However, there might be a shift in focus, so that some sets (such as loading times and costs in the VehiclesParameters table) are used to a larger extent in the current version than in the previous.
Finally, it should be remembered that calibration distorts the model and that the “natural” behavior of the model is changed. Calibration is only done in a few dimensions of the ”output space” of the model and the effects on other dimensions is usual beyond control. Moreover, even though a calibrated model might satisfactorily agree with independent data for the base year, the response to changes in input data, i.e. elasticities, might have been affected in a less desirable way. One may even suspect that the harder the calibration is done with respect to static data, the larger is the risk that elasticities deteriorates. Unfortunately, there are no reliable elasticity data available that can be used as calibration targets or for validation purposes. The only available options to us have been to check that the
elasticities have expected signs and to compare elasticities with those from the previous version of the model. There is an ongoing project which aims at estimating elasticities from Samgods ver 1.1.1, expected results during 2018.
In section 2, the revisions of the model (for the base year 2012) are presented. A summary of calibration parameters and calibration targets are shown in section 3. More detailed data for the calibration parameters can be found in Appendix A. In section 4, software updates from Samgods 1.1 to Samgods 1.1.1 are summarized. Finally, in section 5, comparisons between model output and calibration targets are presented.
2.
Input data changes in Samgods 1.1.1 compared to Samgods 1.1
Input data to Samgods 1.1.1 has been revised with the aim to give a better description of the reality. The changes from Samgods 1.1 to Samgods 1.1.1 are considerably less extensive than those made from Samgods 1.0 to Samgods 1.1. There are no additional input data tables introduced in Samgods 1.1.1 compared with Samgods 1.1. However, existing data have been adjusted in several ways, Table 1 gives an overview of the changes made for the input data in Samgods 1.1.1. In addition, several parameters have been adjusted during the calibration of Samgods 1.1.1, these adjustments are stated in Table 2.Table 1. Adjusted input data to Samgods 1.1.1.
Revised input data Data tables or entries concerned
ASEK costs in vehicle parameters Scenario_Data.mdb -> Vehicle_parameters Changed destination for Russian oil transports
(com=13) from Stockholm to Nynäshamn
PWC_13.txt
Revised capacities for rail, Mellansel-Örnsköldsvik Scenario_Data.mdb -> Rail_Capacity Adjusted link lengths by sea Scenario_Data.mdb -> Network_Link
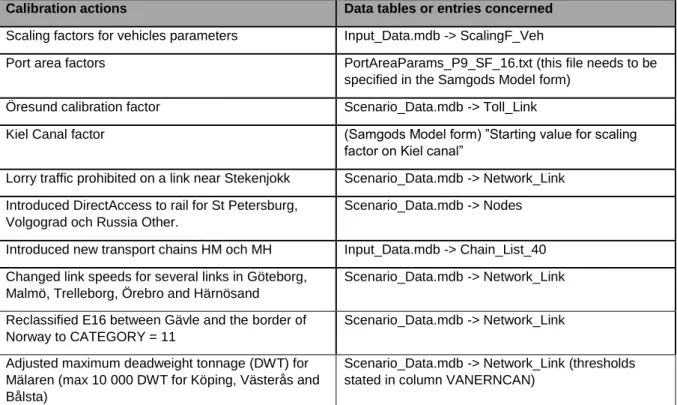
Table 2. Adjustments made of parameters in the model during the calibration of Samgods 1.1.1.
Calibration actions Data tables or entries concerned
Scaling factors for vehicles parameters Input_Data.mdb -> ScalingF_Veh
Port area factors PortAreaParams_P9_SF_16.txt (this file needs to be specified in the Samgods Model form)
Öresund calibration factor Scenario_Data.mdb -> Toll_Link
Kiel Canal factor (Samgods Model form) ”Starting value for scaling factor on Kiel canal”
Lorry traffic prohibited on a link near Stekenjokk Scenario_Data.mdb -> Network_Link Introduced DirectAccess to rail for St Petersburg,
Volgograd och Russia Other.
Scenario_Data.mdb -> Nodes
Introduced new transport chains HM och MH Input_Data.mdb -> Chain_List_40 Changed link speeds for several links in Göteborg,
Malmö, Trelleborg, Örebro and Härnösand
Scenario_Data.mdb -> Network_Link
Reclassified E16 between Gävle and the border of Norway to CATEGORY = 11
Scenario_Data.mdb -> Network_Link
Adjusted maximum deadweight tonnage (DWT) for Mälaren (max 10 000 DWT for Köping, Västerås and Bålsta)
Scenario_Data.mdb -> Network_Link (thresholds stated in column VANERNCAN)
Adjustments of input data and parameter values in Samgods 1.1.1, are performed in order to improve the adaption of the model towards available measurements. Some changes (for example adjusted link lengths by sea) are performed due to observed errors in the model. Below, the adjustments are described in more detail.
Vehicle costs have been updated in accordance to ASEK 6.0. More specifically, the following attributes in table Vehicle_Parameters within Scenario_data.mdb are updated:
a) Distance based cost (KM_COST) b) Time based cost (HOURS_COST)
c) Loading and unloading cost for dry bulk, liquid bulk, general cargo and container (NC_LCO_DRY, NC_LCO_LIQ, NC_LCO_GC, CONT_LCO)
d) Loading and unloading time for dry bulk, liquid bulk, general cargo and container (NC_LTI_DRY, NC_LTI_LIQ, NC_LTI_GC, CONT_LTI)
e) Fairway dues for vessels and ferries (F_DUES_VH, F_DUES_VH) f) On ferry time based cost for lorries and trains (ONFER_H_C) g) On ferry distance based cost for lorries and trains ONFER_KM_C) h) Position costs for vessels (POSICOST)
The costs stated above refers to different stages of the transport chain. Figure 1 illustrates the logistic costs in the Samgods model and where the changed costs are applied in the model.
Figure 1. Overview of the logistics costs used in the Samgods model. The letters a-h refers to the changes in costs during the calibration process.
Logistic costs in Samgods= O + T + Y + I + K
Transport cost (T)
• Distance-based costs (km-costs based on vehicle type and transport distance)
• Time-based costs (hours-costs based on vehicle type and transport time)
• Vehicle specific costs (Loading and unloading costs specified per vehicle type)
• Specific costs for combination of vehicles (unloading cost vehicle 1 + loading cost of vehicle 2)
Order cost (O)
• Constant order cost per shipment and commodity • Annual transport volume • Average shipment size
Inventory cost
(I and K)
Inventory cost (Volume per unit and the scale of the inventory)+ Capital cost (Product value and interest in combination with the scale of the inventory)
a) b) f) g) c) d) e) h) a) b) f) g) c) d) e) h) c) d) e) h)
Capital cost (Y)
(cost of cargo during transport)
• Time (during transport and waiting in terminals)
• Interest • Product value
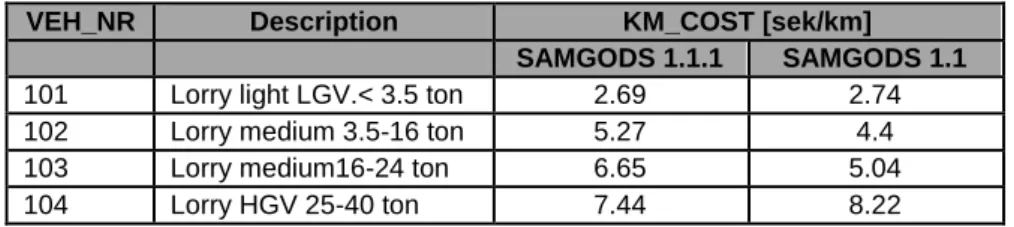
In order to describe the magnitude of the revision updating the costs according to ASEK 6, Table 3 gives on overview of the changes made for the distance based costs for lorries in the model. All values within the table Vehicle_Parameter used in Samgods 1.1.1 are presented in Appendix A.
Table 3. Example of how the revision of costs according to ASEK 6 affects the input data to Samgods 1.1.1 compared to Samgods 1.1.
VEH_NR Description KM_COST [sek/km] SAMGODS 1.1.1 SAMGODS 1.1
101 Lorry light LGV.< 3.5 ton 2.69 2.74
102 Lorry medium 3.5-16 ton 5.27 4.4
103 Lorry medium16-24 ton 6.65 5.04
104 Lorry HGV 25-40 ton 7.44 8.22
In order to prevent remaining flows of russian oil to go by rail via Haparanda to Stockholm the following measures were taken.
• The PWC matrix for commodity number 13 were changed so that the remaining relations between Russia and Stockholm (ZONEDID:780000) were moved to Nynäshamn (ZONEDID:719000). Edits were med in the file
01_Programs\LogMod\Input\PWC\2012\PWC_13.txt.
• Direct access to rail was added for three zones in Russia: ▪ St Petersburg: 970600 Added zonet: 970611 ▪ Volgograd: 71000: Added zonet: 971011 ▪ Russia other: 971200 Added zonet: 971211 Edits were made in the table Nodes within Scenario_data.mdb.
• Introduced the transport chain with Wagonload train and Direct Sea, abbreviated as HM or MH. The new chain was inserted into the table
05_Input_data\Input_data.mdb\Chains_List_40 which controls the available transport chains in the BuildChain process.
Adjustment of the network has been performed in order to improve the representation of the traffic system. The following changed have been made in the table Network_link in Scenario_data.mdb:
• The link length (DIST_KM) for three sea links along the Norwegian coast have been corrected (in both directions):
▪ Link (A,B)=(26715,27019): 440.71 km -> 308.56 km ▪ Link (A,B)=(26761,27019): 440.71 km -> 132.15 km ▪ Link (A,B)=(27016,27019): 440.71 km -> 87.65 km
• A road link in Lapland (near Stekenjokk), (A,B)=(21491,21492) has been cut off for traffic in both directions by setting the link attributes LORRY_40T and LORRY_60T to zero.
• In some cases, the model computes unrealistic road traffic on smaller but shorter roads. In order to prevent such short-cuts, adjustments of speeds on some links in the neighborhood of Malmö, Trelleborg, Örebro, Härnösand and Gothenburg have been done.
The railway connection between Örnsköldsvik and Mellansel has been updated to 3 trains/per day. The capacity of all other railway links is consistent with the calibration of Samgods version 1.1. Concerns the connection 2194-2140 in the table Rail_Capacity within Scenario_data.mdb
In order to capture the capacity restrictions of shipment sizes in Mälaren, the maximum deadweight tonnage (DWT) have been adjusted 10 000 DWT in the ports Västerås, Bålsta and Köping. Concerns port area 5 in the table Nodes within Scenario_data.mdb
3.
New calibration
The revisions of input data have called for a recalibration of the Samgods model. The calibration concerns the base year (2012), the calibrated scenario is named Base2012D171215. Essentially the same types of calibration parameters have been used as in Samgods 1.1:
• Scaling factors for the Vehicle_Parameters table per STAN product group. For each commodity, the original values in Vehicle_Parameters are multiplied by the corresponding factor in table ScalingF_Veh within Input_data.mdb. For example, the costs (𝐶𝑉,𝑆) for vehicle 𝑣 and commodity 𝑠, is calculated using parameters from table Vehicle Parameters and ScalingF Veh according to:
𝐶𝑉,𝑆= 𝐶𝑉𝑉𝑒ℎ𝑖𝑐𝑙𝑒 𝑃𝑎𝑟𝑎𝑚𝑒𝑡𝑒𝑟𝑠∗ 𝐶𝑉,𝑆
𝑆𝑐𝑎𝑙𝑖𝑛𝑔𝐹 𝑉𝑒ℎ
All values of the scaling factors from the calibration of Samgods 1.1.1 are presented in Appendix A.
• Port area parameters per STAN group. Contains initial parameter values of factors for each port area and STAN group in the model. These scaling factors are applied to time for sea vessels and ferries. See Appendix A for calibrated values.
• Technology factors for individual ports. It is assumed that terminals which handles more goods uses more advanced technologies, which facilitates the transfer process. In order to include the level of technology within the model, each terminal is assigned a factor
representing the level of technology (Bergquist, et al., 2016). The technology factor is divided into cost 𝑓𝑐𝑜𝑠𝑡 and time 𝑓𝑡𝑖𝑚𝑒 factors and is applied to the transfer costs (De Bok, et al., 2016). A decreased value of the factor represents increased level of technology of the terminal, which corresponds to decreased transfer costs. For example, the loading costs in terminal 𝐿𝑇 in terminal 𝑇 is calculated by the relation of shipment size 𝑞𝑘, vehicle type specific load cost per tonne 𝑐𝑣𝑙𝑜𝑎𝑑 multiplied by the technology factor in the origin node 𝑓𝑜𝑟𝑖𝑔𝑐𝑜𝑠𝑡 and
𝑓𝑑𝑒𝑠𝑡𝑐𝑜𝑠𝑡 and in the destination node:
𝐿𝑇 = (𝑓𝑜𝑟𝑖𝑔 𝑐𝑜𝑠𝑡 + 𝑓
𝑑𝑒𝑠𝑡
𝑐𝑜𝑠𝑡)∗ 𝑞
𝑘∗ 𝑐𝑣𝑙𝑜𝑎𝑑
See Appendix A for calibrated values of the technology factor.
• The Kiel Canal factor, controlling the amount of goods transported through the Kiel Canal vis-a-vis Skagerrak, has been increased from 1.9 to 2.01. This value specifies the initial value of factor for the Kiel canal and is applied to the canal toll (Trafikverket, 2016).
• Öresund calibration factor. The parameter assigns a link cost in the extension of the Öresund bridge between Copenhagen and Malmö. The actual fee traveling across the Öresund bridge is not adjusted during the calibration process. The Öresund calibration factor is used in order to control traffic flow across the Öresund bridge, without adjusting the actual link cost at the Öresund bridge.
The calibration required adjustments of link costs in the table TollLink for attribute “Toll CPH S-N” within Scenaio_data.mdb. This means that the calibration of the traffic volume across Öresund implied changes of a link cost parameter to control the flow across the Öresund bridge. In lack of any other suitable parameter, this emergency solution was accepted since the two links involved are not likely to be used in any analysis. If a user would like to change the
actual fee at the Öresund bridge, the user would change the values of attribute “Toll Oresund” in table TollLink.
The adjustments of the Öresund calibration factor increased cost with 120% for lorries compared to version 1.1. For trains, the cost increased with 70% compared to version 1.1. See Appendix A for all calibrated costs values of “Toll CPH S-N”.
The calibration targets have been (in decreasing order of importance): • Total tkm (tonne-kilometre) within Sweden per mode
• By sea: transported tonnes per port area in Sweden • By rail: total tkm in Sweden per STAN group
• Transportation across the Öresund bridge: For lorries, number of vehicles, for trains amount of goods (tonnes)
• By sea: The proportion of goods (tonnes) transported through the Kiel Canal and the route north of Jutland.
• By road: the distribution of total tkm in Sweden over the lorry classes (LGV3, MGV16, MGV24, HGV40, HGV60).
• By rail: the distribution of total tkm in Sweden over the rail types (Combi, System and Wagon trains).
• By road: the distribution of total km in Sweden over the lorry classes (LGV3, MGV16, MGV24, HGV40, HGV60).
• By sea: distribution of total tonnes by sea (TON_TOT) over the vessel types (Container, RoRo, Other; Ferries).
In addition to the target stated above, the results from Samgods version 1.1.1 should not deviate too much compared to the results obtained from Samgods 1.1. unless there are good reasons and obvious explanations for this.
The calibration was carried out by iteratively testing alternative values of the above mentioned parameters in order to achieve the targets. A detailed description of this process is not possible to give here.
Statistics used for calibration are described in more detail in section 5, as well as comparisons with output from the calibrated model.
4.
New features and program updates
A module for automatic generation of elasticities has been included. In a new input data table, Scenarios_List, a number of perturbed scenarios are defined. For each such scenario one type of elasticity is specified, i.e. which input variables to change, and by how much. Elasticities are computed for a predefined set of output variables on an aggregated level.
Some program bugs in version 1.1 have been fixed in version 1.1.1. These concern SelectLink, LP2CC.exe, MPS.jar, SelectDirect.jar and Report_12_RCM.
5.
Comparisons between model results and statistics
In the previous calibration report (for version 1.1) a distinction was made between calibration statistics and validation statistics. In the current report, no such distinction is done since all calibration targets mentioned in section 3 were considered during the calibration, although some of the targets were considered more important than others. In principle, a top-bottom approach on the targets was followed, giving higher priority to the most aggregated statistics at national level per mode and subsequently to the lower ones.
Comparisons are done both with statistics and with results from version 1.1.
5.1.
The distribution of tkm over modes
In Figure 2, total transport work on Swedish territory1 are compared. For rail and sea the differences between Samgods 1.1.1 and Samgods 1.1 are almost indistinguishable. For road, however, Samgods 1.1.1 differs significantly from statistics, an excess of 3.1 billion tkm, or 7%. It has been found difficult to reduce this quantity in combination with all other calibration targets. Although total tkm is considered an important target, this solution has been retained.
Figure 2. Total tkm in Sweden.
5.2.
Sea
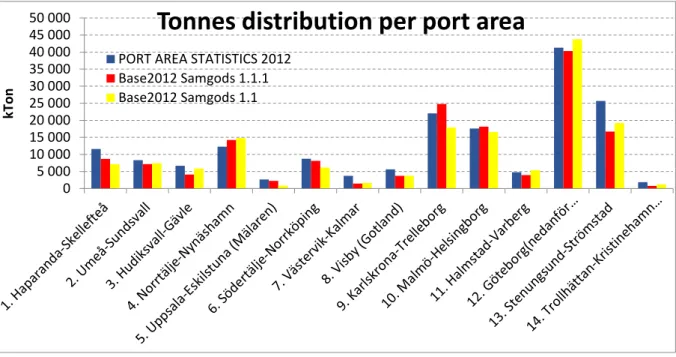
Statistics for the total amount of loaded/unloaded goods to/from vessels per port area in Sweden has been considered an important calibration target. This is partly due to the high reliability of these data, but also to the fact that these quantities determine major flows between Sweden and abroad, and therefore, constitutes a sort of geographical boundary condition in the model.
In Figure 3, total tonnes a year per port area is shown. Overall, the agreement is reasonable, although the relative differences for some smaller area volumes are rather high, e g for the ports
1 More precisely, domestic transports plus the domestic part of international transports (DTOT). By sea, the
domestic part of international transport is defined as the route from the Swedish port to the limit of the Swedish territorial waters. 0 10 20 30 40 50 60 70 80 90 100
Road
Rail
Sea
Gt o n km
Total tkm in Sweden
TONKM STATISTICS 2012 Base2012 Samgods 1.1.1 Base2012 Samgods 1.1in Vänern. In area 13 (Stenungsund-Strömstad) statistics contain temporary storage of oil for some ports, while the model doesn’t, and this has been taken into account in the calibration process, so that model results are deliberately smaller than statistics in area 13. It should be noted here, that better agreement between model output and statistics could have been achieved for all ports during the calibration. But there are uncertainties in however the statistics are correct in every detail. Improved agreement of port areas towards the statistics may cause reduced performance in terms of other targets in the calibration.
Figure 3. Tonnes loaded/unloaded to/from ships per port area.
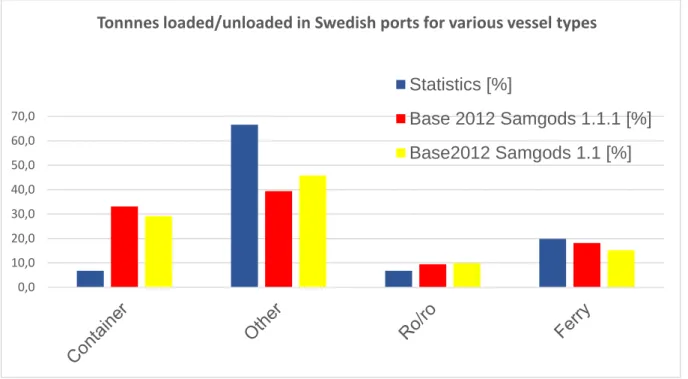
Another target on sea is the distribution over vessel types, see Figure 4. Evidently, the balance between container ships and other vessels is not well described by the model2. Attempts have been done to improve the balance during the calibration process but without much success. The distribution over vessel types has been considered less important in the calibration process, compared to other targets. Distributions over vessel will probably be reviewed during the next calibration of the model (Samgods 1.2).
Although not illustrated here, the well-known flaw of the model to incorrectly describe distributions over vessel size classes (in particular container ships and roro) that prevails in the previous versions of the model, is still present in version 1.1.1. No attempt has been done to correct this model defect here, since it is considered to be of a deeper nature than a mere calibration issue.
2 Note to the VTI report made by Rune et al on this for instance.
0 5 000 10 000 15 000 20 000 25 000 30 000 35 000 40 000 45 000 50 000 kTo n
Tonnes distribution per port area
PORT AREA STATISTICS 2012 Base2012 Samgods 1.1.1 Base2012 Samgods 1.1
Figure 4. Distribution of tonnes in Swedish ports over vessel types.
5.3.
Rail
For rail, reliable statistics exist for performed transport work for individual STAN groups. This has also been considered an important calibration target since it is used in the CBA tools. As is shown in Figure 5 , results vary for the individual STAN groups. Agreement has significantly improved for STAN groups 1,2,3,9 and 12 in version 1.1.1., while in some other groups results are better in version 1.1.
Figure 5. Transport work in Sweden (in million tkm) for rail per commodity group (STAN). 0,0 10,0 20,0 30,0 40,0 50,0 60,0 70,0
Tonnnes loaded/unloaded in Swedish ports for various vessel types
Statistics [%]
Base 2012 Samgods 1.1.1 [%]
Base2012 Samgods 1.1 [%]
0 1 000 2 000 3 000 4 000 5 000 6 000 M tk mCommodities transported by train in Sweden
RAIL STAN STATISTICS 2012
Base2012 Samgods 1.1.1
Base2012 Samgods 1.1
5.4.
Road
For the distribution of vehicles (vehkm as well as tkm) there is a lack of statistics for Swedish goods transported by foreign registered lorries. More specifically, there is no available statistics for the individual lorry weight classes used in Samgods. In order to obtain as good estimates as possible, we have, for each vehicle class, added tkm for Swedish lorries and for foreign lorries, by assuming that the foreign lorries belong to the segment 24-40 tonnes. The reason for doing this is that the heaviest lorry type (total weight 60 tonnes) is not allowed outside Sweden (with the exception of Finland).
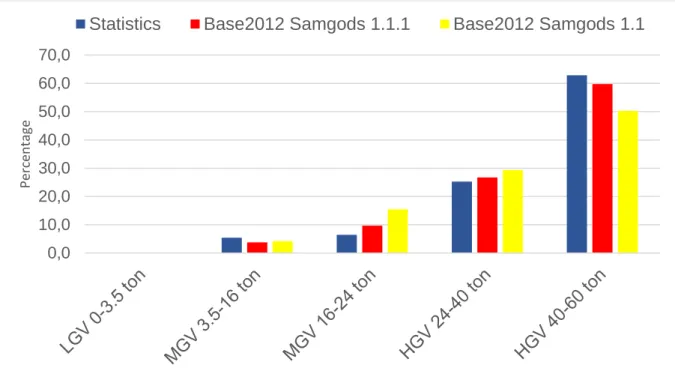
In Figure 6 tkm on Swedish territory are shown for each vehicle class. The fit with statistics is satisfactory and has improved somewhat compared to version 1.1. It should be noted, however, that in order to achieve this, rather large calibration factors were needed in the ScalingF_veh table.
Figure 6. Distribution of the transport work in Sweden (in percentage).
The distribution of vehicle kms over different lorry types show a similar pattern as for tkm, see Figure 7. The fit with statistics is satisfactory and has improved somewhat compared to version 1.1.
0 10 20 30 40 50 60 70 80 90 Perc en ta ge
Figure 7. Distribution of kilometers per lorry type. Domestic total.
5.5.
The Öresund bridge, the Kiel Canal and Skagerrak
It has been considered important that the flow of goods passing the waterways of Kiel Canal and Skagerrak as well as the Öresund bridge are distributed correctly, see Figure 8.
Results agree satisfactorily with statistics. (However, as will be seen in section 5.6, growth factors from 2012 to 2040 deviates rather much.)
0,0 10,0 20,0 30,0 40,0 50,0 60,0 70,0 Perc en ta ge
Figure 8. Transports over the Öresund bridge and through the Kiel Canal. Comparisons between model versions and statistics. For the Öresund bridge statistics correspond to 100%. For the Kiel Canal, percentages represent the share KielCanal/Skagerrak.
5.6.
Growth factors
The growth factors are defined as quotients between the base year (calibrated scenario for 2012) and the forecast year of 20403. For example, the growth factor of tkm 𝐺
𝑡𝑘𝑚 is calculated as the quote of the total tkm in the forecast year (𝑡𝑘𝑚2040) divided by total tkm in the base year (𝑡𝑘𝑚2012).
𝐺𝑡𝑘𝑚=
𝑡𝑘𝑚2040
𝑡𝑘𝑚2012
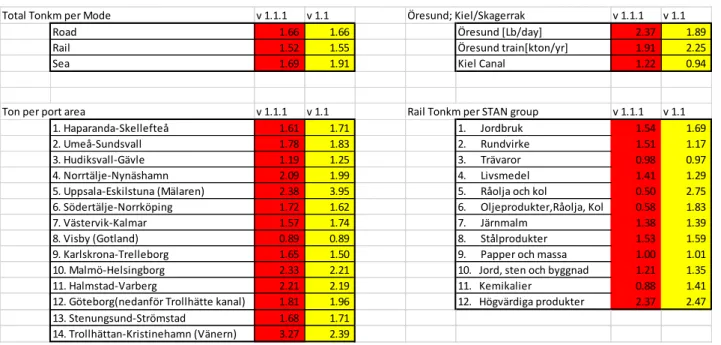
The growth factors are compared with the results from latest calibration version Samgods 1.1, in order to identify major deviations compared to the previous model release. In Table 4, the growth factors are compared for some of the diagrams shown earlier. In general the growth factors are quite similar compared to the previous model version, the most serious deviations arise on the Öresund bridge and Kiel Canal/Skagerrak.. Also, for some port areas, most notably Lake Vänern (nr 14), the deviation is larger. This is also the case for some commodity groups, such as oil products (nr 6) and Crude Oil (nr 5). The calibration of the forecast year (2040) is briefly described in Appendix D.
3 The scenario name of the prediction year is Main2040D171222
0 20 40 60 80 100 120 Per ce n tage
Table 4. Growth factors from 2012 to 2040 for version 1.1.1 and 1.1 respectively.
5.7.
Elasticities
To show how the model reacts to changes in cost input data, adjustment of the km-cost (i.e. the distance cost on links) have been made in a number of sequential runs for all vehicles belonging to a certain mode (road, rail, sea). Simulations has been made using the base scenario
(Base2012D171215). Unfortunately, no statistics describing elasticities are available. Instead, comparisons can be done between two different model versions.
In Table 5, elasticities computed with model versions 1.1 and 1.1.1 are shown. Three different levels of vehicle km cost increases were used: +1%, +5% and +10%. Impacts are represented by tkms on Swedish territories (DTOT) and have been computed using rail capacity restrictions (RCM).
An undesired feature in the results from version 1.1.1 is that the own elasticity for rail has an unfeasible sign (when rail distance cost is increased by 1% or 5%). The reason for this has not been clarified. It is possible that it is related to the rather large calibration factors in
ScalingF_veh, but this has not been confirmed. In general, the own elasticity for rail is lower (in absolute terms) in version 1.1.1 than in version 1.1. The own elasticities for sea are quite the opposite; they are in general larger in the new model version than in the old one. The own elasticities for road are somewhat lower in the new version than in the old. For the larger perturbation (10%) results tend to agree better than for small perturbations. This is natural since any local disturbances in results will be smoothened out by a longer step length.
In a few cases, cross elasticities also have the wrong sign. This is equally frequent in both versions. Overall, the elasticities with the new version tend to vary somewhat more than with the old one, when the magnitude of the perturbations vary.
The low own elasticities for rail can be explained by a tight capacity control and that km-costs on rail is marginal compared to the dominant cost per train hour. The differences between the two model versions are not easily explained but might be a consequence of different scaling of the VehicleParameters costs in the calibration (ScalingF_Veh).
Total Tonkm per Mode v 1.1.1 v 1.1 Öresund; Kiel/Skagerrak v 1.1.1 v 1.1 Road 1.66 1.66 Öresund [Lb/day] 2.37 1.89 Rail 1.52 1.55 Öresund train[kton/yr] 1.91 2.25 Sea 1.69 1.91 Kiel Canal 1.22 0.94
Ton per port area v 1.1.1 v 1.1 Rail Tonkm per STAN group v 1.1.1 v 1.1 1. Haparanda-Skellefteå 1.61 1.71 1. Jordbruk 1.54 1.69 2. Umeå-Sundsvall 1.78 1.83 2. Rundvirke 1.51 1.17 3. Hudiksvall-Gävle 1.19 1.25 3. Trävaror 0.98 0.97 4. Norrtälje-Nynäshamn 2.09 1.99 4. Livsmedel 1.41 1.29 5. Uppsala-Eskilstuna (Mälaren) 2.38 3.95 5. Råolja och kol 0.50 2.75 6. Södertälje-Norrköping 1.72 1.62 6. Oljeprodukter,Råolja, Kol 0.58 1.83 7. Västervik-Kalmar 1.57 1.74 7. Järnmalm 1.38 1.39 8. Visby (Gotland) 0.89 0.89 8. Stålprodukter 1.53 1.59 9. Karlskrona-Trelleborg 1.65 1.50 9. Papper och massa 1.00 1.01 10. Malmö-Helsingborg 2.33 2.21 10. Jord, sten och byggnad 1.21 1.35 11. Halmstad-Varberg 2.21 2.19 11. Kemikalier 0.88 1.41 12. Göteborg(nedanför Trollhätte kanal) 1.81 1.96 12. Högvärdiga produkter 2.37 2.47 13. Stenungsund-Strömstad 1.68 1.71
Table 5. Elasticities in tkm resulting from a km-cost increase at 1, 5 and 10 % respectively. Comparisons between results obtained from version 1.1 and 1.1.1.
Due to the rather comprehensive uncertainties in the elasticities from the calibrated model ,
Trafikverket has decided not to use estimated elasticities from Samgods 1.1.1 as input to ASEK, Ebba and Bansek. In the extension, Trafikverket will continue to investigate the impact on elasticities from different parameters in order to enhance the calibration procedure with respect to the model sensitivity. In order to understand the elasticity of the model, one alternative approach would be to estimate sensitivity functions of elasticities in relation to parameter changes from model output data. This would require a lot of simulations in order make reliable functions, but it would increase the understanding of how the model reacts on changed input data.
ver 1.1 ver 1.1.1
Road Rail Sea Road Rail Sea
Road -0.521 0.001 -0.005 Road -0.225 0.005 0.090
Rail 0.472 -0.046 0.042 Rail 0.210 0.001 0.039
Sea 0.417 0.025 -0.03 Sea 0.119 0.001 -0.043
Air 0 0 0 Air 0.000 0.000 0.000
Total 0.014 0 -0.005 Total -0.021 0.003 0.033
Road Rail Sea Road Rail Sea
Road -0.442 0.007 0.005 Road -0.310 -0.043 0.039
Rail 0.291 -0.066 0.011 Rail 0.344 0.022 0.048
Sea 0.365 -0.06 -0.02 Sea 0.236 0.088 -0.154
Air 0 0 0 Air 0.000 0.000 0.000
Total -0.005 -0.032 -0.003 Total 0.007 0.016 -0.027
Road Rail Sea Road Rail Sea
Road -0.4 -0.007 0.021 Road -0.408 -0.016 0.011
Rail 0.432 -0.049 0.022 Rail 0.378 -0.004 0.043
Sea 0.223 0.003 -0.058 Sea 0.284 0.058 -0.110
Air 0 0 0 Air 0.000 0.000 0.000
Total -0.01 -0.012 -0.007 Total -0.014 0.012 -0.026
10 % cost increase km-cost 2012 10 % cost increase km-cost 2012 1 % cost increase km-cost 2012 1 % cost increase km-cost 2012
References
Bergquist, M., Bernhardsson, V. & Rosklint, E., 2016. Representation of the Swedish transport and logistics system in Samgods v. 1.1., Borlänge: Trafikverket
https://www.trafikverket.se/contentassets/ab220f9016154ef7a8478555560bb280/representation_report _20161125.pdf.
De Bok, M., Baak, J. & De Jong, G., 2016. Program documentation for the logistics model for Sweden, Significance
https://www.trafikverket.se/contentassets/ab220f9016154ef7a8478555560bb280/program_documentat ion_for_the_logistics_model_for_sweden_march_2016.pdf.
De Jong, G. & Baak, J., 2016. Method Report - Logistics Model in the Swedish National Freight Model System, Significance.
Sala, G., 2015. Samgods: Calibration report, Trafikverket
https://www.trafikverket.se/contentassets/d7cf7d727fb2488aab9fa9d24387c7c8/externa-rapporter/samgods_calibration_report_rad81.pdf.
Sala, G. & Edwards, H., 2015. Calibration report - Samgods version 1.1, Sweco
https://www.trafikverket.se/contentassets/ab220f9016154ef7a8478555560bb280/calibration_report__s amgods_version_1.1.pdf.
Trafikverket, 2016. Samgods User Manual V1.1, Östersund: Trafikverket
https://www.trafikverket.se/contentassets/ab220f9016154ef7a8478555560bb280/samgods_user_manu al_version_1.1.pdf.
Appendix A Calibration parameters
In this appendix we present in more detail some of the calibration parameters mentioned in sections 2 and 3. Changes of the port area factors are stated in Table 6. Scaling factors for loading costs and times in the vehicle parameters table are shown below for each STAN group separately in Table 9 to Table 20. Adjustments of the links speed is presented in Table 21.
Table 6. Rescaling factors for LOS matrices on sea mode per port area and STAN group
Table 7. Calibrated values of the Öresund calibration factor (Toll link for attribute “TOLL CPH S-N”).
Vehicle Nr Vehicle Link Cost [sek/veh]
101 LGV3 25704, 25674 343.2 102 MGV16 25704, 25674 638 103 MGV24 25704, 25674 638 104 HGV40 25704, 25674 957 105 HGV60 25704, 25674 957 201 KOMBI 25711, 25742 51 076.5 202 FEEDV 25711, 25742 51 076.5 204 SYS22 25711, 25742 51 076.5 205 SYS25 25711, 25742 51 076.5 206 SYS30 25711, 25742 51 076.5 207 WG550 25711, 25742 51 076.5 208 WG750 25711, 25742 51 076.5 209 WG950 25711, 25742 51 076.5
Table 8. Technologie factors for ports in Samgods 1.1.1
ZONEID NAME Tech. factor cost Tech. factor time
718021 Sea: Stockholm 1.3 1.3
718031 Sea Ferry: Stockholm 1.3 1.3
718121 Sea: Södertälje 1.1 1.1
718221 Sea: Nacka 1.3 1.3
718821 Sea: Hallstavik 1.3 1.3
718831 Sea Ferry: Grisslehalm 1.3 1.3
718832 Sea Ferry: Kapellskär 1.3 1.3
719221 Sea: Nynäshamn 1.3 1.3
719231 Sea Ferry: Nynäshamn 1.3 1.3
731921 Sea: Skutskär 1.1 1.1
738221 Sea: Hargshamn 1.1 1.1
748121 Sea: Oxelösund 1.1 1.1
758121 Sea: Norrköping 1.1 1.1
PortArea STAN1 STAN2 STAN3 STAN4 STAN5 STAN6 STAN7 STAN8 STAN9 STAN10 STAN11 STAN12 1 4.537 1.1 0.562 3.75 0.02 0.02 0.887 7.648 0.228 0.65 0.2 1.95 2 3.26 0.5 0.399 2.244 1 0.02 4.457 1.84 0.433 1.656 1.203 1.25 3 3.563 0.25 0.49 1.35 9.562 0.489 0.165 2.15 2.289 4.63 3.211 1.995 4 9.548 0.85 0.316 1.339 0.5 3.106 0.25 0.548 1.369 10.49 5.623 1.974 5 0.4802 1.19 0.294 0.252 1.1935 0.7126 0.014 0.0903 1.2446 2.2225 1.8732 0.2324 6 0.02 2.8332 0.379 2.1 0.643 2.182 0.2 0.839 2.445 6.309 4.655 1.354 7 2.461 0.424 0.453 0.762 3.301 0.341 0.02 0.45 1.392 1.526 4.141 2.061 8 6.314 22.56 1.264 5.747 0.02 1.264 4.05 0.15 0.02 0.02 4.95 0.2 9 0.043 0.02 0.02 0.02 7.449 0.02 0.02 0.02 1.156 0.103 3.155 0.02 10 0.4404 0.3288 0.3648 0.1308 5.8272 0.0996 0.1752 0.3792 3.4764 0.7464 4.848 0.12 11 0.171 0.02 0.02 0.201 2.036 0.02 0.02 0.214 2.119 0.334 4.21 0.395 12 0.1212 0.024 0.03 0.024 0.06 0.024 0.024 0.2916 1.9092 0.5964 4.6764 0.0276 13 0.136 0.4 0.097 0.478 0.02 0.02 0.02 0.926 0.999 0.333 2.442 0.043 14 3.602 0.2796 1.33344 0.67212 2.46456 0.48555 0.045765 10.171 1.4352 3.1216 3.016 4.56
ZONEID NAME Tech. factor cost Tech. factor time 786121 Sea: Mönsterås 1 1 788021 Sea: Kalmar 1 1 788221 Sea: Oskarshamn 1 1 788231 Sea_Ferry: Oskarshamn 1 1 798021 Sea: Visby 1 1 798022 Sea: Slite 1 1 798031 Sea_Ferry: Visby 1 1 808031 Sea_Ferry: Karlskrona 1 1 808221 Sea: Karlshamn 1 1 808231 Sea_Ferry: Karlshamn 1 1 808321 Sea: Sölvesborg 1 1 828021 Sea: Malmö 0.13 0.13 828031 Sea_Ferry: Malmö 0.06 0.06 828221 Sea: Landskrona 1 1 828321 Sea: Helsingborg 1 1 828331 Sea_Ferry: Helsingborg 0.1 0.1 828421 Sea: Höganäs 1 1 828621 Sea: Ystad 0.1 0.1 828631 Sea_Ferry: Ystad 0.1 0.1 828721 Sea: Trelleborg 0.1 0.1 828731 Sea_Ferry: Trelleborg 0.1 0.1 829021 Sea: Åhus 1 1 829031 Sea_Ferry: Kristianstad 1 1 838021 Sea: Halmstad 0.8 0.8 838221 Sea: Falkenberg 0.8 0.8 838321 Sea: Varberg 0.8 0.8 838331 Sea_Ferry: Varberg 0.8 0.8 841521 Sea: Stenungsund 1 1 841921 Sea: Wallhamn 1 1 844721 Sea: Otterbäcken 0.85 0.85 848021 Sea: Göteborg 0.9 0.9 848031 Sea_Ferry: Göteborg 0.9 0.9 848421 Sea: Brofjorden 1 1 848422 Sea: Lysekil 1 1 848521 Sea: Uddevalla 1 1 848621 Sea: Strömstad 1 1 848631 Sea_Ferry: Strömstad 1 1 848721 Sea: Vänersborg 0.85 0.85 848821 Sea: Trollhättan 0.85 0.85 849421 Sea: Lidköping 0.85 0.85 876121 Sea: Skoghall 0.85 0.85 878121 Sea: Kristinehamn 0.85 0.85 962521 Sea: Kotka 1 1 963321 Sea: Vasa 1 1 963331 Sea_Ferry: Vasa 1 1 963521 Sea: Oulu 1 1 963721 Sea: Mariehamn 1 1 963731 Sea_Ferry: Mariehamn 1 1 963732 Sea_Ferry: Eckerö 1 1 963921 Sea: Köpenhamn 1 1 964031 Sea_Ferry: Heslingör 1 1 964231 Sea_Ferry: Slagelse 1 1 964421 Sea: Rönne 1 1 964431 Sea_Ferry: Rönne 1 1 964721 Sea: Esbjerg 1 1 964731 Sea_Ferry: Esbjerg 1 1 964821 Sea: Kolding 1 1 965021 Sea: Århus 1 1
ZONEID NAME Tech. factor cost Tech. factor time 965031 Sea_Ferry: Århus 1 1 965032 Sea_Ferry: Grenå 1 1 965221 Sea: Frederikshavn 1 1 965231 Sea_Ferry: Fredrikshavn 1 1 965421 Sea: Zeebrugge 1 1 965521 Sea: Bryssel 1 1 965522 Sea: Ghent 1 1 965523 Sea: Antwerpen 1 1 965821 Sea: Larnaca 1 1 965921 Sea: Tallinn 1 1 965931 Sea_Ferry: Tallinn 1 1 965932 Sea_Ferry: Paldiski 1 1 966221 Sea: St-Malo 1 1 730521 Sea: Bålsta 1.31 1.31 738222 Sea: Forsmark 1.1 1.1 783421 Sea: Bergkvara 1 1 784021 Sea: Degerhamn 1 1 788222 Sea: Oskarshamsverken 1 1 788321 Sea: Västervik 1 1 798023 Sea: Storungs 1 1 898021 Sea: Västerås 1.31 1.31 898321 Sea: Köping 1.31 1.31 918021 Sea: Gävle 1.1 1.1 918022 Sea: Norrsundet 1.1 1.1 918221 Sea: Vallvik 1.1 1.1 918421 Sea: Iggesund 1.1 1.1 928021 Sea: Härnösand 1 1 928121 Sea: Sundsvall 1 1 928221 Sea: Dynäs 1 1 928421 Sea: Örnsköldsvik 1 1 928422 Sea: Husum 1 1 940121 Sea: Rundvik 1 1 948021 Sea: Umeå 1 1 948031 Sea_Ferry: Umeå 1 1 948221 Sea: Skellefteå 1 1 951421 Sea: Karlsborg-Axelsvik 1 1 958021 Sea: Luleå 1 1 958121 Sea: Piteå 1 1 960121 Sea: Oslo 1 1 960131 Sea_Ferry: Oslo 1 1 960221 Sea: Drammen 1 1 960521 Sea: Bergen 1 1 960531 Sea_Ferry: Bergen 1 1 960621 Sea: Ålesund 1 1 960721 Sea: Narvik 0.1 0.1 961021 Sea: Stavanger 1 1 961221 Sea: Trondheim 1 1 961321 Sea: Larvik 1 1 961421 Sea: Tromsö 1 1 961521 Sea: Kristiansand 1 1 961531 Sea_Ferry: Kristiansand 1 1 961631 Sea_Ferry: Sandefjord 1 1 961721 Sea: Fredrikstad 1 1 961821 Sea: Arendal 1 1 961921 Sea: Helsingfors 1 1 961931 Sea_Ferry: Helsingfors 1 1 962021 Sea: Åbo 1 1 962031 Sea_Ferry: Åbo 1 1
ZONEID NAME Tech. factor cost Tech. factor time 962121 Sea: Pori 1 1 966321 Sea: Paris 1 1 966322 Sea: Le-Havre 1 1 966621 Sea: Marseille 1 1 966721 Sea: Fr_Islands 1 1 966821 Sea: Streymoy 1 1 967021 Sea: Aten 1 1 967121 Sea: Iraklion 1 1 967221 Sea: Godthåb 1 1 967321 Sea: Dublin 1 1 967421 Sea: Reykjavik 1 1 967721 Sea: Rom 1 1 967921 Sea: Cagliari 1 1 968221 Sea: Ventspils 1 1 968222 Sea: Liepaja 1 1 968231 Sea_Ferry: Liepaja 1 1 968232 Sea_Ferry: Ventspils 1 1 968321 Sea: Riga 1 1 968331 Sea_Ferry: Riga 1 1 968521 Sea: Klaipeda 1 1 968531 Sea_Ferry: Klaipeda 1 1 968921 Sea: Valetta 1 1 969021 Sea: Delfzijl 1 1 969121 Sea: Amsterdam 1 1 969122 Sea: Rotterdam 1 1 969131 Sea_Ferry: Amsterdam 1 1 969221 Sea: Szczecin 0.1 0.1 969231 Sea_Ferry: Swinouscie 0.1 0.1 969621 Sea: Gdansk 1 1 969631 Sea_Ferry: Gdansk/Gdynia 1 1 970021 Sea: Lissabon 1 1 970121 Sea: Port_Islands 1 1 970421 Sea: Murmansk 1 1 970621 Sea: St-Petersburg 1 1 971621 Sea: Bilbao 1 1 971622 Sea: La Coruna 1 1 971821 Sea: Barcelona 1 1 971921 Sea: Valencia 1 1 972021 Sea: Span_Islands 1 1 972121 Sea: Belfast 1 1 972321 Sea: Hull 1 1 972621 Sea: London/Chatham 1 1 972921 Sea: Lubeck 0.1 0.1 972931 Sea_Ferry: Travemunde 0.1 0.1 972932 Sea_Ferry: Kiel 1 1 973021 Sea: Hamburg 1 1 973221 Sea: Bremerhaven 1 1 974021 Sea: Rostock 0.1 0.1 974031 Sea_Ferry: Rostock 0.1 0.1 974032 Sea_Ferry: Sassnitz 0.1 0.1 798024 Sea: Klintehamn 1 1 798025 Sea: Strå 1 1 826121 Sea Barsebäck 1.1 1.1 838322 Sea: Ringhals 0.8 0.8 876421 Sea: Gruvön 0.85 0.85 878021 Sea: Gruvön 0.85 0.85 918222 Sea: Sandarne 1.1 1.1 918223 Sea: Ljusne 1.1 1.1
ZONEID NAME Tech. factor cost Tech. factor time
926221 Sea: Östrand 1 1
926222 Sea: Söråker 1 1
928022 Sea: Utansjö 1 1
960722 Sea: Mo i Rana 1 1
Table 9. Scaling factors for commodities in Stan group 1.
VEH_NR DESCRIPTIO LABEL NC_LCO_DRYNC_LCO_LIQNC_LCO_GCDFLTFREQNC_LTI_DRYNC_LTI_LIQNC_LTI_GCCONT_LCOCONT_LTI STAN_G 101 Lorry light LGV.< 3.5 ton LGV3 0.2 0.2 0.2 1 1 1 1 1 1 1 102 Lorry medium 3.5-16 ton MGV16 0.1 0.1 0.1 1 0.1 0.1 0.1 1 0.1 1 103 Lorry medium16-24 ton MGV24 0.1 0.1 0.1 1 0.3 0.3 0.3 1 0.3 1 104 Lorry HGV 25-40 ton HGV40 5 5 5 1 2.5 2.5 2.5 1 2.5 1 105 Lorry HGV 25-60 ton HGV60 0.6 0.6 0.6 1 1 1 1 1 1 1
106 Lorry HGV 74 ton HGV74 1 1 1 1 1 1 1 1 1 1
201 Kombi train KOMBI 3 3 3 1 3 3 3 1 3 1
202 Feeder/shunt train FEEDV 1 1 1 1 3 3 3 1 3 1 204 System train STAX 22.5 SYS22 1 1 1 1 3 3 3 1 3 1 205 System train STAX 25 SYS25 1 1 1 1 3 3 3 1 3 1 206 System train STAX 30 SYS30 1 1 1 1 3 3 3 1 3 1 207 Wagon load train (short) WG550 1 1 1 1 3 3 3 1 3 1 208 Wagon load train (medium) WG750 1 1 1 1 3 3 3 1 3 1 209 Wagon load train (long) WG950 1 1 1 1 3 3 3 1 3 1 210 Combi train (XL 750 m 201L) KOMXL 1 1 1 1 1 1 1 1 1 1 211 System train STAX 22,5 (XL 750 m 204L) SYSXL 1 1 1 1 1 1 1 1 1 1 212 Wagonload train (XL 750 m) WGEXL 1 1 1 1 1 1 1 1 1 1 301 Container vessel 5.300 dwt (ship) CV5 5 5 5 1 1 1 1 1 1 1 302 Container vessel 16.000 dwt (ship) CV16 3 3 3 1 1 1 1 1 1 1 303 Container vessel 27.200 dwt(ship) CV27 3 3 3 1 1 1 1 1 1 1 304 Container vessel 100.000 dwt (ship) CV100 3 3 3 1 1 1 1 1 1 1 305 Other vessel 1.000 dwt (ship) OV1 0.5 0.5 0.5 1 1 1 1 1 1 1 306 Other vessel 2.500 dwt (ship) OV2 0.5 0.5 0.5 1 1 1 1 1 1 1 307 Other vessel 3.500 dwt (ship) OV3 0.5 0.5 0.5 1 1 1 1 1 1 1 308 Other vessel 5.000 dwt (ship) OV5 0.5 0.5 0.5 1 1 1 1 1 1 1 309 Other vessel 10.000 dwt (ship) OV10 0.5 0.5 0.5 1 1 1 1 1 1 1 310 Other vessel 20.000 dwt (ship) OV20 0.5 0.5 0.5 1 1 1 1 1 1 1 311 Other vessel 40.000 dwt (ship) OV40 0.5 0.5 0.5 1 1 1 1 1 1 1 312 Other vessel 80.000 dwt (ship) OV80 0.5 0.5 0.5 1 1 1 1 1 1 1 313 Other vessel 100.000 dwt (ship) OV100 0.5 0.5 0.5 1 1 1 1 1 1 1 314 Other vessel 250.000 dwt (ship) OV250 0.5 0.5 0.5 1 1 1 1 1 1 1 315 Ro/ro vessel 3.600 dwt (ship) RO3 1 1 1 1 1 1 1 1 1 1 316 Ro/ro vessel 6.300 dwt (ship) RO6 1 1 1 1 1 1 1 1 1 1 317 Ro/ro vessel 10.000 dwt (ship) RO10 1 1 1 1 1 1 1 1 1 1 318 Road ferry 2.500 dwt ROF2 0 0 0 1 0.1 0.1 0.1 0 0.1 1 319 Road ferry 5.000 dwt ROF5 0 0 0 1 0.1 0.1 0.1 0 0.1 1 320 Road ferry 7.500 dwt ROF7 0 0 0 1 0.1 0.1 0.1 0 0.1 1 321 Rail ferry 5.000 dwt RAF5 0 0 0 1 0.1 0.1 0.1 0 0.1 1 322 Barge Inland water way INW 1 1 1 1 1 1 1 1 1 1
Table 10. Scaling factors for commodities in Stan group 2.
Table 11. Scaling factors for commodities in Stan group 3.
VEH_NR DESCRIPTIO LABEL NC_LCO_DRYNC_LCO_LIQNC_LCO_GCDFLTFREQNC_LTI_DRYNC_LTI_LIQNC_LTI_GCCONT_LCOCONT_LTI STAN_G 101 Lorry light LGV.< 3.5 ton LGV3 0.5 0.5 0.5 1 2.5 2.5 2.5 2.5 2.5 2 102 Lorry medium 3.5-16 ton MGV16 0.25 0.25 0.25 1 2.5 2.5 2.5 2.5 2.5 2 103 Lorry medium16-24 ton MGV24 0.25 0.25 0.25 1 2.5 2.5 2.5 2.5 2.5 2 104 Lorry HGV 25-40 ton HGV40 12.5 12.5 12.5 1 2.5 2.5 2.5 2.5 2.5 2 105 Lorry HGV 25-60 ton HGV60 1.5 1.5 1.5 1 2.5 2.5 2.5 2.5 2.5 2 106 Lorry HGV 74 ton HGV74 1 1 1 1 1 1 1 1 1 2 201 Kombi train KOMBI 3 3 3 1 0.4 0.4 0.4 0.4 0.4 2 202 Feeder/shunt train FEEDV 0.4 0.4 0.4 1 0.4 0.4 0.4 0.4 0.4 2 204 System train STAX 22.5 SYS22 0.4 0.4 0.4 1 0.4 0.4 0.4 0.4 0.4 2 205 System train STAX 25 SYS25 0.4 0.4 0.4 1 0.4 0.4 0.4 0.4 0.4 2 206 System train STAX 30 SYS30 0.4 0.4 0.4 1 0.4 0.4 0.4 0.4 0.4 2 207 Wagon load train (short) WG550 0.4 0.4 0.4 1 0.4 0.4 0.4 0.4 0.4 2 208 Wagon load train (medium) WG750 0.4 0.4 0.4 1 0.4 0.4 0.4 0.4 0.4 2 209 Wagon load train (long) WG950 1 1 1 1 1 1 1 1 1 2 210 Combi train (XL 750 m 201L) KOMXL 1 1 1 1 1 1 1 1 1 2 211 System train STAX 22,5 (XL 750 m 204L) SYSXL 1 1 1 1 1 1 1 1 1 2 212 Wagonload train (XL 750 m) WGEXL 1 1 1 1 1 1 1 1 1 2 301 Container vessel 5.300 dwt (ship) CV5 12.5 12.5 12.5 1 2.5 2.5 2.5 2.5 2.5 2 302 Container vessel 16.000 dwt (ship) CV16 7.5 7.5 7.5 1 2.5 2.5 2.5 2.5 2.5 2 303 Container vessel 27.200 dwt(ship) CV27 7.5 7.5 7.5 1 2.5 2.5 2.5 2.5 2.5 2 304 Container vessel 100.000 dwt (ship) CV100 7.5 7.5 7.5 1 2.5 2.5 2.5 2.5 2.5 2 305 Other vessel 1.000 dwt (ship) OV1 1.25 1.25 1.25 1 2.5 2.5 2.5 2.5 2.5 2 306 Other vessel 2.500 dwt (ship) OV2 1.25 1.25 1.25 1 2.5 2.5 2.5 2.5 2.5 2 307 Other vessel 3.500 dwt (ship) OV3 1.25 1.25 1.25 1 2.5 2.5 2.5 2.5 2.5 2 308 Other vessel 5.000 dwt (ship) OV5 1.25 1.25 1.25 1 2.5 2.5 2.5 2.5 2.5 2 309 Other vessel 10.000 dwt (ship) OV10 1.25 1.25 1.25 1 2.5 2.5 2.5 2.5 2.5 2 310 Other vessel 20.000 dwt (ship) OV20 1.25 1.25 1.25 1 2.5 2.5 2.5 2.5 2.5 2 311 Other vessel 40.000 dwt (ship) OV40 1.25 1.25 1.25 1 2.5 2.5 2.5 2.5 2.5 2 312 Other vessel 80.000 dwt (ship) OV80 1.25 1.25 1.25 1 2.5 2.5 2.5 2.5 2.5 2 313 Other vessel 100.000 dwt (ship) OV100 1.25 1.25 1.25 1 2.5 2.5 2.5 2.5 2.5 2 314 Other vessel 250.000 dwt (ship) OV250 1.25 1.25 1.25 1 2.5 2.5 2.5 2.5 2.5 2 315 Ro/ro vessel 3.600 dwt (ship) RO3 2.5 2.5 2.5 1 2.5 2.5 2.5 2.5 2.5 2 316 Ro/ro vessel 6.300 dwt (ship) RO6 2.5 2.5 2.5 1 2.5 2.5 2.5 2.5 2.5 2 317 Ro/ro vessel 10.000 dwt (ship) RO10 2.5 2.5 2.5 1 2.5 2.5 2.5 2.5 2.5 2 318 Road ferry 2.500 dwt ROF2 0 0 0 1 0.1 0.1 0.1 0 0.1 2 319 Road ferry 5.000 dwt ROF5 0 0 0 1 0.1 0.1 0.1 0 0.1 2 320 Road ferry 7.500 dwt ROF7 0 0 0 1 0.1 0.1 0.1 0 0.1 2 321 Rail ferry 5.000 dwt RAF5 0 0 0 1 0.1 0.1 0.1 0 0.1 2 322 Barge Inland water way INW 1 1 1 1 1 1 1 1 1 2 401 Freight airplane FLYG 1 1 1 1 1 1 1 1 1 2
VEH_NR DESCRIPTIO LABEL NC_LCO_DRYNC_LCO_LIQNC_LCO_GCDFLTFREQNC_LTI_DRYNC_LTI_LIQNC_LTI_GCCONT_LCOCONT_LTI STAN_G 101 Lorry light LGV.< 3.5 ton LGV3 0.2 0.2 0.2 1 1 1 1 1 1 3 102 Lorry medium 3.5-16 ton MGV16 0.1 0.1 0.1 1 0.1 0.1 0.1 1 0.1 3 103 Lorry medium16-24 ton MGV24 0.1 0.1 0.1 1 0.3 0.3 0.3 1 0.3 3 104 Lorry HGV 25-40 ton HGV40 5 5 5 1 2.5 2.5 2.5 1 2.5 3 105 Lorry HGV 25-60 ton HGV60 0.6 0.6 0.6 1 1 1 1 1 1 3 106 Lorry HGV 74 ton HGV74 1 1 1 1 1 1 1 1 1 3 201 Kombi train KOMBI 5.4 5.4 5.4 1 4 4 4 5.4 4 3 202 Feeder/shunt train FEEDV 1.8 1.8 1.8 1 2.5 2.5 2.5 1.8 2.5 3 204 System train STAX 22.5 SYS22 1.8 1.8 1.8 1 2.5 2.5 2.5 1.8 2.5 3 205 System train STAX 25 SYS25 1.8 1.8 1.8 1 2.5 2.5 2.5 1.8 2.5 3 206 System train STAX 30 SYS30 1.8 1.8 1.8 1 2.5 2.5 2.5 1.8 2.5 3 207 Wagon load train (short) WG550 1.8 1.8 1.8 1 2.5 2.5 2.5 1.8 2.5 3 208 Wagon load train (medium) WG750 1.8 1.8 1.8 1 2.5 2.5 2.5 1.8 2.5 3 209 Wagon load train (long) WG950 1 1 1 1 1 1 1 1 1 3 210 Combi train (XL 750 m 201L) KOMXL 1 1 1 1 1 1 1 1 1 3 211 System train STAX 22,5 (XL 750 m 204L) SYSXL 1 1 1 1 1 1 1 1 1 3 212 Wagonload train (XL 750 m) WGEXL 1 1 1 1 1 1 1 1 1 3 301 Container vessel 5.300 dwt (ship) CV5 5 5 5 1 1 1 1 1 1 3 302 Container vessel 16.000 dwt (ship) CV16 3 3 3 1 1 1 1 1 1 3 303 Container vessel 27.200 dwt(ship) CV27 3 3 3 1 1 1 1 1 1 3 304 Container vessel 100.000 dwt (ship) CV100 3 3 3 1 1 1 1 1 1 3 305 Other vessel 1.000 dwt (ship) OV1 0.5 0.5 0.5 1 1 1 1 1 1 3 306 Other vessel 2.500 dwt (ship) OV2 0.5 0.5 0.5 1 1 1 1 1 1 3 307 Other vessel 3.500 dwt (ship) OV3 0.5 0.5 0.5 1 1 1 1 1 1 3 308 Other vessel 5.000 dwt (ship) OV5 0.5 0.5 0.5 1 1 1 1 1 1 3 309 Other vessel 10.000 dwt (ship) OV10 0.5 0.5 0.5 1 1 1 1 1 1 3 310 Other vessel 20.000 dwt (ship) OV20 0.5 0.5 0.5 1 1 1 1 1 1 3 311 Other vessel 40.000 dwt (ship) OV40 0.5 0.5 0.5 1 1 1 1 1 1 3 312 Other vessel 80.000 dwt (ship) OV80 0.5 0.5 0.5 1 1 1 1 1 1 3 313 Other vessel 100.000 dwt (ship) OV100 0.5 0.5 0.5 1 1 1 1 1 1 3 314 Other vessel 250.000 dwt (ship) OV250 0.5 0.5 0.5 1 1 1 1 1 1 3 315 Ro/ro vessel 3.600 dwt (ship) RO3 1 1 1 1 1 1 1 1 1 3 316 Ro/ro vessel 6.300 dwt (ship) RO6 1 1 1 1 1 1 1 1 1 3 317 Ro/ro vessel 10.000 dwt (ship) RO10 1 1 1 1 1 1 1 1 1 3 318 Road ferry 2.500 dwt ROF2 0 0 0 1 0.1 0.1 0.1 0 0.1 3 319 Road ferry 5.000 dwt ROF5 0 0 0 1 0.1 0.1 0.1 0 0.1 3 320 Road ferry 7.500 dwt ROF7 0 0 0 1 0.1 0.1 0.1 0 0.1 3 321 Rail ferry 5.000 dwt RAF5 0 0 0 1 0.1 0.1 0.1 0 0.1 3 322 Barge Inland water way INW 1 1 1 1 1 1 1 1 1 3 401 Freight airplane FLYG 1 1 1 1 1 1 1 1 1 3
Table 12. Scaling factors for commodities in Stan group 4.
Table 13. Scaling factors for commodities in Stan group 5.
VEH_NR DESCRIPTIO LABEL NC_LCO_DRYNC_LCO_LIQNC_LCO_GCDFLTFREQNC_LTI_DRYNC_LTI_LIQNC_LTI_GCCONT_LCOCONT_LTI STAN_G 101 Lorry light LGV.< 3.5 ton LGV3 0.2 0.2 0.2 1 1 1 1 1 1 4 102 Lorry medium 3.5-16 ton MGV16 0.1 0.1 0.1 1 0.1 0.1 0.1 1 0.1 4 103 Lorry medium16-24 ton MGV24 0.1 0.1 0.1 1 0.3 0.3 0.3 1 0.3 4 104 Lorry HGV 25-40 ton HGV40 5 5 5 1 2.5 2.5 2.5 1 2.5 4 105 Lorry HGV 25-60 ton HGV60 0.6 0.6 0.6 1 1 1 1 1 1 4 106 Lorry HGV 74 ton HGV74 1 1 1 1 1 1 1 1 1 4 201 Kombi train KOMBI 4.2 4.2 4.2 1 1.4 1.4 1.4 1.4 1.4 4 202 Feeder/shunt train FEEDV 1.4 1.4 1.4 1 1.4 1.4 1.4 1.4 1.4 4 204 System train STAX 22.5 SYS22 1.4 1.4 1.4 1 1.4 1.4 1.4 1.4 1.4 4 205 System train STAX 25 SYS25 1.4 1.4 1.4 1 1.4 1.4 1.4 1.4 1.4 4 206 System train STAX 30 SYS30 1.4 1.4 1.4 1 1.4 1.4 1.4 1.4 1.4 4 207 Wagon load train (short) WG550 1.4 1.4 1.4 1 1.4 1.4 1.4 1.4 1.4 4 208 Wagon load train (medium) WG750 1.4 1.4 1.4 1 1.4 1.4 1.4 1.4 1.4 4 209 Wagon load train (long) WG950 1 1 1 1 1 1 1 1 1 4 210 Combi train (XL 750 m 201L) KOMXL 1 1 1 1 1 1 1 1 1 4 211 System train STAX 22,5 (XL 750 m 204L) SYSXL 1 1 1 1 1 1 1 1 1 4 212 Wagonload train (XL 750 m) WGEXL 1 1 1 1 1 1 1 1 1 4 301 Container vessel 5.300 dwt (ship) CV5 5 5 5 1 1 1 1 1 1 4 302 Container vessel 16.000 dwt (ship) CV16 3 3 3 1 1 1 1 1 1 4 303 Container vessel 27.200 dwt(ship) CV27 3 3 3 1 1 1 1 1 1 4 304 Container vessel 100.000 dwt (ship) CV100 3 3 3 1 1 1 1 1 1 4 305 Other vessel 1.000 dwt (ship) OV1 0.5 0.5 0.5 1 1 1 1 1 1 4 306 Other vessel 2.500 dwt (ship) OV2 0.5 0.5 0.5 1 1 1 1 1 1 4 307 Other vessel 3.500 dwt (ship) OV3 0.5 0.5 0.5 1 1 1 1 1 1 4 308 Other vessel 5.000 dwt (ship) OV5 0.5 0.5 0.5 1 1 1 1 1 1 4 309 Other vessel 10.000 dwt (ship) OV10 0.5 0.5 0.5 1 1 1 1 1 1 4 310 Other vessel 20.000 dwt (ship) OV20 0.5 0.5 0.5 1 1 1 1 1 1 4 311 Other vessel 40.000 dwt (ship) OV40 0.5 0.5 0.5 1 1 1 1 1 1 4 312 Other vessel 80.000 dwt (ship) OV80 0.5 0.5 0.5 1 1 1 1 1 1 4 313 Other vessel 100.000 dwt (ship) OV100 0.5 0.5 0.5 1 1 1 1 1 1 4 314 Other vessel 250.000 dwt (ship) OV250 0.5 0.5 0.5 1 1 1 1 1 1 4 315 Ro/ro vessel 3.600 dwt (ship) RO3 1 1 1 1 1 1 1 1 1 4 316 Ro/ro vessel 6.300 dwt (ship) RO6 1 1 1 1 1 1 1 1 1 4 317 Ro/ro vessel 10.000 dwt (ship) RO10 1 1 1 1 1 1 1 1 1 4 318 Road ferry 2.500 dwt ROF2 0 0 0 1 0.1 0.1 0.1 0 0.1 4 319 Road ferry 5.000 dwt ROF5 0 0 0 1 0.1 0.1 0.1 0 0.1 4 320 Road ferry 7.500 dwt ROF7 0 0 0 1 0.1 0.1 0.1 0 0.1 4 321 Rail ferry 5.000 dwt RAF5 0 0 0 1 0.1 0.1 0.1 0 0.1 4 322 Barge Inland water way INW 1 1 1 1 1 1 1 1 1 4 401 Freight airplane FLYG 1 1 1 1 1 1 1 1 1 4
VEH_NR DESCRIPTIO LABEL NC_LCO_DRYNC_LCO_LIQNC_LCO_GCDFLTFREQNC_LTI_DRYNC_LTI_LIQNC_LTI_GCCONT_LCOCONT_LTI STAN_G 101 Lorry light LGV.< 3.5 ton LGV3 0.2 0.2 0.2 1 1 1 1 1 1 5 102 Lorry medium 3.5-16 ton MGV16 0.1 0.1 0.1 1 0.1 0.1 0.1 1 0.1 5 103 Lorry medium16-24 ton MGV24 0.1 0.1 0.1 1 0.3 0.3 0.3 1 0.3 5 104 Lorry HGV 25-40 ton HGV40 5 5 5 1 2.5 2.5 2.5 1 2.5 5 105 Lorry HGV 25-60 ton HGV60 0.6 0.6 0.6 1 1 1 1 1 1 5 106 Lorry HGV 74 ton HGV74 1 1 1 1 1 1 1 1 1 5
201 Kombi train KOMBI 3 3 3 1 2 2 2 1 2 5
202 Feeder/shunt train FEEDV 1 1 1 1 2 2 2 1 2 5 204 System train STAX 22.5 SYS22 1 1 1 1 2 2 2 1 2 5 205 System train STAX 25 SYS25 1 1 1 1 2 2 2 1 2 5 206 System train STAX 30 SYS30 1 1 1 1 2 2 2 1 2 5 207 Wagon load train (short) WG550 1 1 1 1 2 2 2 1 2 5 208 Wagon load train (medium) WG750 1 1 1 1 2 2 2 1 2 5 209 Wagon load train (long) WG950 1 1 1 1 2 2 2 1 2 5 210 Combi train (XL 750 m 201L) KOMXL 1 1 1 1 1 1 1 1 1 5 211 System train STAX 22,5 (XL 750 m 204L) SYSXL 1 1 1 1 1 1 1 1 1 5 212 Wagonload train (XL 750 m) WGEXL 1 1 1 1 1 1 1 1 1 5 301 Container vessel 5.300 dwt (ship) CV5 5 5 5 1 1 1 1 1 1 5 302 Container vessel 16.000 dwt (ship) CV16 3 3 3 1 1 1 1 1 1 5 303 Container vessel 27.200 dwt(ship) CV27 3 3 3 1 1 1 1 1 1 5 304 Container vessel 100.000 dwt (ship) CV100 3 3 3 1 1 1 1 1 1 5 305 Other vessel 1.000 dwt (ship) OV1 0.5 0.5 0.5 1 1 1 1 1 1 5 306 Other vessel 2.500 dwt (ship) OV2 0.5 0.5 0.5 1 1 1 1 1 1 5 307 Other vessel 3.500 dwt (ship) OV3 0.5 0.5 0.5 1 1 1 1 1 1 5 308 Other vessel 5.000 dwt (ship) OV5 0.5 0.5 0.5 1 1 1 1 1 1 5 309 Other vessel 10.000 dwt (ship) OV10 0.5 0.5 0.5 1 1 1 1 1 1 5 310 Other vessel 20.000 dwt (ship) OV20 0.5 0.5 0.5 1 1 1 1 1 1 5 311 Other vessel 40.000 dwt (ship) OV40 0.5 0.5 0.5 1 1 1 1 1 1 5 312 Other vessel 80.000 dwt (ship) OV80 0.5 0.5 0.5 1 1 1 1 1 1 5 313 Other vessel 100.000 dwt (ship) OV100 0.5 0.5 0.5 1 1 1 1 1 1 5 314 Other vessel 250.000 dwt (ship) OV250 0.5 0.5 0.5 1 1 1 1 1 1 5 315 Ro/ro vessel 3.600 dwt (ship) RO3 1 1 1 1 1 1 1 1 1 5 316 Ro/ro vessel 6.300 dwt (ship) RO6 1 1 1 1 1 1 1 1 1 5 317 Ro/ro vessel 10.000 dwt (ship) RO10 1 1 1 1 1 1 1 1 1 5 318 Road ferry 2.500 dwt ROF2 0 0 0 1 0.1 0.1 0.1 0 0.1 5 319 Road ferry 5.000 dwt ROF5 0 0 0 1 0.1 0.1 0.1 0 0.1 5 320 Road ferry 7.500 dwt ROF7 0 0 0 1 0.1 0.1 0.1 0 0.1 5 321 Rail ferry 5.000 dwt RAF5 0 0 0 1 0.1 0.1 0.1 0 0.1 5 322 Barge Inland water way INW 1 1 1 1 1 1 1 1 1 5 401 Freight airplane FLYG 1 1 1 1 1 1 1 1 1 5
Table 14. Scaling factors for commodities in Stan group 6.
Table 15. Scaling factors for commodities in Stan group 7.
VEH_NR DESCRIPTIO LABEL NC_LCO_DRYNC_LCO_LIQNC_LCO_GCDFLTFREQNC_LTI_DRYNC_LTI_LIQNC_LTI_GCCONT_LCOCONT_LTI STAN_G 101 Lorry light LGV.< 3.5 ton LGV3 0.4 0.4 0.4 1 1 1 1 1 1 6 102 Lorry medium 3.5-16 ton MGV16 0.2 0.2 0.2 1 0.1 0.1 0.1 1 0.1 6 103 Lorry medium16-24 ton MGV24 0.2 0.2 0.2 1 0.3 0.3 0.3 1 0.3 6 104 Lorry HGV 25-40 ton HGV40 10 10 10 1 2.5 2.5 2.5 1 2.5 6 105 Lorry HGV 25-60 ton HGV60 1.2 1.2 1.2 1 1 1 1 1 1 6 106 Lorry HGV 74 ton HGV74 2 2 2 1 1 1 1 1 1 6 201 Kombi train KOMBI 3 3 3 1 8 8 8 1 8 6 202 Feeder/shunt train FEEDV 1 1 1 1 8 8 8 1 8 6 204 System train STAX 22.5 SYS22 1 1 1 1 8 8 8 1 8 6 205 System train STAX 25 SYS25 1 1 1 1 8 8 8 1 8 6 206 System train STAX 30 SYS30 1 1 1 1 8 8 8 1 8 6 207 Wagon load train (short) WG550 1 1 1 1 8 8 8 1 8 6 208 Wagon load train (medium) WG750 1 1 1 1 8 8 8 1 8 6 209 Wagon load train (long) WG950 1 1 1 1 8 8 8 1 8 6 210 Combi train (XL 750 m 201L) KOMXL 1 1 1 1 1 1 1 1 1 6 211 System train STAX 22,5 (XL 750 m 204L) SYSXL 1 1 1 1 1 1 1 1 1 6 212 Wagonload train (XL 750 m) WGEXL 1 1 1 1 1 1 1 1 1 6 301 Container vessel 5.300 dwt (ship) CV5 10 10 10 1 1 1 1 1 1 6 302 Container vessel 16.000 dwt (ship) CV16 6 6 6 1 1 1 1 1 1 6 303 Container vessel 27.200 dwt(ship) CV27 6 6 6 1 1 1 1 1 1 6 304 Container vessel 100.000 dwt (ship) CV100 6 6 6 1 1 1 1 1 1 6 305 Other vessel 1.000 dwt (ship) OV1 1 1 1 1 1 1 1 1 1 6 306 Other vessel 2.500 dwt (ship) OV2 1 1 1 1 1 1 1 1 1 6 307 Other vessel 3.500 dwt (ship) OV3 1 1 1 1 1 1 1 1 1 6 308 Other vessel 5.000 dwt (ship) OV5 1 1 1 1 1 1 1 1 1 6 309 Other vessel 10.000 dwt (ship) OV10 1 1 1 1 1 1 1 1 1 6 310 Other vessel 20.000 dwt (ship) OV20 1 1 1 1 1 1 1 1 1 6 311 Other vessel 40.000 dwt (ship) OV40 1 1 1 1 1 1 1 1 1 6 312 Other vessel 80.000 dwt (ship) OV80 1 1 1 1 1 1 1 1 1 6 313 Other vessel 100.000 dwt (ship) OV100 1 1 1 1 1 1 1 1 1 6 314 Other vessel 250.000 dwt (ship) OV250 1 1 1 1 1 1 1 1 1 6 315 Ro/ro vessel 3.600 dwt (ship) RO3 2 2 2 1 1 1 1 1 1 6 316 Ro/ro vessel 6.300 dwt (ship) RO6 2 2 2 1 1 1 1 1 1 6 317 Ro/ro vessel 10.000 dwt (ship) RO10 2 2 2 1 1 1 1 1 1 6 318 Road ferry 2.500 dwt ROF2 0 0 0 1 0.1 0.1 0.1 0 0.1 6 319 Road ferry 5.000 dwt ROF5 0 0 0 1 0.1 0.1 0.1 0 0.1 6 320 Road ferry 7.500 dwt ROF7 0 0 0 1 0.1 0.1 0.1 0 0.1 6 321 Rail ferry 5.000 dwt RAF5 0 0 0 1 0.1 0.1 0.1 0 0.1 6 322 Barge Inland water way INW 1 1 1 1 1 1 1 1 1 6 401 Freight airplane FLYG 1 1 1 1 1 1 1 1 1 6
VEH_NR DESCRIPTIO LABEL NC_LCO_DRYNC_LCO_LIQNC_LCO_GCDFLTFREQNC_LTI_DRYNC_LTI_LIQNC_LTI_GCCONT_LCOCONT_LTI STAN_G 101 Lorry light LGV.< 3.5 ton LGV3 0.2 0.2 1.785714 1 1 1 1.5 1 1 7 102 Lorry medium 3.5-16 ton MGV16 0.1 0.1 1.913043 1 0.1 0.1 0.1 1 0.1 7 103 Lorry medium16-24 ton MGV24 0.1 0.1 1.913043 1 0.3 0.3 0.3 1 0.3 7 104 Lorry HGV 25-40 ton HGV40 5 5 1.909091 1 2.5 2.5 2.5 1 2.5 7 105 Lorry HGV 25-60 ton HGV60 0.6 0.6 2 1 1 1 1 1 1 7 106 Lorry HGV 74 ton HGV74 1 1 1 1 1 1 1 1 1 7 201 Kombi train KOMBI 3 3 1.5 1 0.8 0.8 0.8 1 0.8 7 202 Feeder/shunt train FEEDV 1 1 1.625 1 0.8 0.8 0.8 1 0.8 7 204 System train STAX 22.5 SYS22 1 1 2.454545 1 0.8 0.8 0.8 1 0.8 7 205 System train STAX 25 SYS25 1 1 2.454545 1 0.8 0.8 0.8 1 0.8 7 206 System train STAX 30 SYS30 1 1 2.454545 1 0.8 0.8 0.8 1 0.8 7 207 Wagon load train (short) WG550 1 1 2.454545 1 0.8 0.8 0.8 1 0.8 7 208 Wagon load train (medium) WG750 1 1 2.454545 1 0.8 0.8 0.8 1 0.8 7 209 Wagon load train (long) WG950 1 1 5 1 0.8 0.8 0.8 1 0.8 7 210 Combi train (XL 750 m 201L) KOMXL 1 1 1 1 1 1 1 1 1 7 211 System train STAX 22,5 (XL 750 m 204L) SYSXL 1 1 1 1 1 1 1 1 1 7 212 Wagonload train (XL 750 m) WGEXL 1 1 1 1 1 1 1 1 1 7 301 Container vessel 5.300 dwt (ship) CV5 5 5 5 1 1 1 1 1 1 7 302 Container vessel 16.000 dwt (ship) CV16 3 3 3 1 1 1 1 1 1 7 303 Container vessel 27.200 dwt(ship) CV27 3 3 3 1 1 1 1 1 1 7 304 Container vessel 100.000 dwt (ship) CV100 3 3 3 1 1 1 1 1 1 7 305 Other vessel 1.000 dwt (ship) OV1 0.5 0.5 8.113745 1 1 1 3.333333 1 1 7 306 Other vessel 2.500 dwt (ship) OV2 0.5 0.5 8.441856 1 1 1 3.5051 1 1 7 307 Other vessel 3.500 dwt (ship) OV3 0.5 0.5 8.441856 1 1 1 3.191728 1 1 7 308 Other vessel 5.000 dwt (ship) OV5 0.5 0.5 8.461894 1 1 1 2.853955 1 1 7 309 Other vessel 10.000 dwt (ship) OV10 0.5 0.5 8.421668 1 1 1 2.746578 1 1 7 310 Other vessel 20.000 dwt (ship) OV20 0.5 0.5 8.450189 1 1 1 2.658186 1 1 7 311 Other vessel 40.000 dwt (ship) OV40 0.5 0.5 8.088228 1 1 1 2.5 1 1 7 312 Other vessel 80.000 dwt (ship) OV80 0.5 0.5 8.059197 1 1 1 2.440976 1 1 7 313 Other vessel 100.000 dwt (ship) OV100 0.5 0.5 8.059197 1 1 1 1 1 1 7 314 Other vessel 250.000 dwt (ship) OV250 0.5 0.5 8.059197 1 1 1 1 1 1 7 315 Ro/ro vessel 3.600 dwt (ship) RO3 1 1 1 1 1 1 1 1 1 7 316 Ro/ro vessel 6.300 dwt (ship) RO6 1 1 1 1 1 1 1 1 1 7 317 Ro/ro vessel 10.000 dwt (ship) RO10 1 1 1 1 1 1 1 1 1 7 318 Road ferry 2.500 dwt ROF2 0 0 0 1 0.1 0.1 0.1 0 0.1 7 319 Road ferry 5.000 dwt ROF5 0 0 0 1 0.1 0.1 0.1 0 0.1 7 320 Road ferry 7.500 dwt ROF7 0 0 0 1 0.1 0.1 0.1 0 0.1 7 321 Rail ferry 5.000 dwt RAF5 0 0 0 1 0.1 0.1 0.1 0 0.1 7 322 Barge Inland water way INW 1 1 1 1 1 1 1 1 1 7
Table 16. Scaling factors for commodities in Stan group 8.
Table 17. Scaling factors for commodities in Stan group 9.
VEH_NR DESCRIPTIO LABEL NC_LCO_DRYNC_LCO_LIQNC_LCO_GCDFLTFREQNC_LTI_DRYNC_LTI_LIQNC_LTI_GCCONT_LCOCONT_LTI STAN_G 101 Lorry light LGV.< 3.5 ton LGV3 0.2 0.2 0.2 1 1 1 1 1 1 8 102 Lorry medium 3.5-16 ton MGV16 0.1 0.1 0.1 1 0.1 0.1 0.1 1 0.1 8 103 Lorry medium16-24 ton MGV24 0.1 0.1 0.1 1 0.3 0.3 0.3 1 0.3 8 104 Lorry HGV 25-40 ton HGV40 5 5 5 1 2.5 2.5 2.5 1 2.5 8 105 Lorry HGV 25-60 ton HGV60 0.6 0.6 0.6 1 1 1 1 1 1 8 106 Lorry HGV 74 ton HGV74 1 1 1 1 1 1 1 1 1 8 201 Kombi train KOMBI 3 3 3 1 1.5 1.5 1.5 1 1.5 8 202 Feeder/shunt train FEEDV 1 1 1 1 1.5 1.5 1.5 1 1.5 8 204 System train STAX 22.5 SYS22 1 1 1 1 1.5 1.5 1.5 1 1.5 8 205 System train STAX 25 SYS25 1 1 1 1 1.5 1.5 1.5 1 1.5 8 206 System train STAX 30 SYS30 1 1 1 1 1.5 1.5 1.5 1 1.5 8 207 Wagon load train (short) WG550 1 1 1 1 1.5 1.5 1.5 1 1.5 8 208 Wagon load train (medium) WG750 1 1 1 1 1.5 1.5 1.5 1 1.5 8 209 Wagon load train (long) WG950 1 1 1 1 1.5 1.5 1.5 1 1.5 8 210 Combi train (XL 750 m 201L) KOMXL 1 1 1 1 1 1 1 1 1 8 211 System train STAX 22,5 (XL 750 m 204L) SYSXL 1 1 1 1 1 1 1 1 1 8 212 Wagonload train (XL 750 m) WGEXL 1 1 1 1 1 1 1 1 1 8 301 Container vessel 5.300 dwt (ship) CV5 5 5 5 1 1 1 1 1 1 8 302 Container vessel 16.000 dwt (ship) CV16 3 3 3 1 1 1 1 1 1 8 303 Container vessel 27.200 dwt(ship) CV27 3 3 3 1 1 1 1 1 1 8 304 Container vessel 100.000 dwt (ship) CV100 3 3 3 1 1 1 1 1 1 8 305 Other vessel 1.000 dwt (ship) OV1 0.5 0.5 0.5 1 1 1 1 1 1 8 306 Other vessel 2.500 dwt (ship) OV2 0.5 0.5 0.5 1 1 1 1 1 1 8 307 Other vessel 3.500 dwt (ship) OV3 0.5 0.5 0.5 1 1 1 1 1 1 8 308 Other vessel 5.000 dwt (ship) OV5 0.5 0.5 0.5 1 1 1 1 1 1 8 309 Other vessel 10.000 dwt (ship) OV10 0.5 0.5 0.5 1 1 1 1 1 1 8 310 Other vessel 20.000 dwt (ship) OV20 0.5 0.5 0.5 1 1 1 1 1 1 8 311 Other vessel 40.000 dwt (ship) OV40 0.5 0.5 0.5 1 1 1 1 1 1 8 312 Other vessel 80.000 dwt (ship) OV80 0.5 0.5 0.5 1 1 1 1 1 1 8 313 Other vessel 100.000 dwt (ship) OV100 0.5 0.5 0.5 1 1 1 1 1 1 8 314 Other vessel 250.000 dwt (ship) OV250 0.5 0.5 0.5 1 1 1 1 1 1 8 315 Ro/ro vessel 3.600 dwt (ship) RO3 1 1 1 1 1 1 1 1 1 8 316 Ro/ro vessel 6.300 dwt (ship) RO6 1 1 1 1 1 1 1 1 1 8 317 Ro/ro vessel 10.000 dwt (ship) RO10 1 1 1 1 1 1 1 1 1 8 318 Road ferry 2.500 dwt ROF2 0 0 0 1 0.1 0.1 0.1 0 0.1 8 319 Road ferry 5.000 dwt ROF5 0 0 0 1 0.1 0.1 0.1 0 0.1 8 320 Road ferry 7.500 dwt ROF7 0 0 0 1 0.1 0.1 0.1 0 0.1 8 321 Rail ferry 5.000 dwt RAF5 0 0 0 1 0.1 0.1 0.1 0 0.1 8 322 Barge Inland water way INW 1 1 1 1 1 1 1 1 1 8 401 Freight airplane FLYG 1 1 1 1 1 1 1 1 1 8
VEH_NR DESCRIPTIO LABEL NC_LCO_DRYNC_LCO_LIQNC_LCO_GCDFLTFREQNC_LTI_DRYNC_LTI_LIQNC_LTI_GCCONT_LCOCONT_LTI STAN_G 101 Lorry light LGV.< 3.5 ton LGV3 0.3 0.3 0.3 1 1.4 1.4 1.4 1.4 1.4 9 102 Lorry medium 3.5-16 ton MGV16 0.14 0.14 0.14 1 1.4 1.4 1.4 1.4 1.4 9 103 Lorry medium16-24 ton MGV24 0.14 0.14 0.14 1 1.4 1.4 1.4 1.4 1.4 9 104 Lorry HGV 25-40 ton HGV40 7 7 7 1 1.4 1.4 1.4 1.4 1.4 9 105 Lorry HGV 25-60 ton HGV60 0.84 0.84 0.84 1 1.4 1.4 1.4 1.4 1.4 9 106 Lorry HGV 74 ton HGV74 1 1 1 1 1 1 1 1 1 9 201 Kombi train KOMBI 1.8 1.8 1.8 1 0.6 0.6 0.6 0.6 0.6 9 202 Feeder/shunt train FEEDV 0.6 0.6 0.6 1 0.6 0.6 0.6 0.6 0.6 9 204 System train STAX 22.5 SYS22 0.6 0.6 0.6 1 0.6 0.6 0.6 0.6 0.6 9 205 System train STAX 25 SYS25 0.6 0.6 0.6 1 0.6 0.6 0.6 0.6 0.6 9 206 System train STAX 30 SYS30 0.6 0.6 0.6 1 0.6 0.6 0.6 0.6 0.6 9 207 Wagon load train (short) WG550 0.6 0.6 0.6 1 0.6 0.6 0.6 0.6 0.6 9 208 Wagon load train (medium) WG750 0.6 0.6 0.6 1 0.6 0.6 0.6 0.6 0.6 9 209 Wagon load train (long) WG950 0.7 0.7 0.7 1 1.4 1.4 1.4 1.4 1.4 9 210 Combi train (XL 750 m 201L) KOMXL 1 1 1 1 1 1 1 1 1 9 211 System train STAX 22,5 (XL 750 m 204L) SYSXL 1 1 1 1 1 1 1 1 1 9 212 Wagonload train (XL 750 m) WGEXL 1 1 1 1 1 1 1 1 1 9 301 Container vessel 5.300 dwt (ship) CV5 7 7 7 1 1.4 1.4 1.4 1.4 1.4 9 302 Container vessel 16.000 dwt (ship) CV16 4.2 4.2 4.2 1 1.4 1.4 1.4 1.4 1.4 9 303 Container vessel 27.200 dwt(ship) CV27 4.2 4.2 4.2 1 1.4 1.4 1.4 1.4 1.4 9 304 Container vessel 100.000 dwt (ship) CV100 4.2 4.2 4.2 1 1.4 1.4 1.4 1.4 1.4 9 305 Other vessel 1.000 dwt (ship) OV1 0.7 0.7 0.7 1 1.4 1.4 1.4 1.4 1.4 9 306 Other vessel 2.500 dwt (ship) OV2 0.7 0.7 0.7 1 1.4 1.4 1.4 1.4 1.4 9 307 Other vessel 3.500 dwt (ship) OV3 0.7 0.7 0.7 1 1.4 1.4 1.4 1.4 1.4 9 308 Other vessel 5.000 dwt (ship) OV5 0.7 0.7 0.7 1 1.4 1.4 1.4 1.4 1.4 9 309 Other vessel 10.000 dwt (ship) OV10 0.7 0.7 0.7 1 1.4 1.4 1.4 1.4 1.4 9 310 Other vessel 20.000 dwt (ship) OV20 0.7 0.7 0.7 1 1.4 1.4 1.4 1.4 1.4 9 311 Other vessel 40.000 dwt (ship) OV40 0.7 0.7 0.7 1 1.4 1.4 1.4 1.4 1.4 9 312 Other vessel 80.000 dwt (ship) OV80 0.7 0.7 0.7 1 1.4 1.4 1.4 1.4 1.4 9 313 Other vessel 100.000 dwt (ship) OV100 0.7 0.7 0.7 1 1.4 1.4 1.4 1.4 1.4 9 314 Other vessel 250.000 dwt (ship) OV250 0.7 0.7 0.7 1 1.4 1.4 1.4 1.4 1.4 9 315 Ro/ro vessel 3.600 dwt (ship) RO3 1.4 1.4 1.4 1 1.4 1.4 1.4 1.4 1.4 9 316 Ro/ro vessel 6.300 dwt (ship) RO6 1.4 1.4 1.4 1 1.4 1.4 1.4 1.4 1.4 9 317 Ro/ro vessel 10.000 dwt (ship) RO10 1.4 1.4 1.4 1 1.4 1.4 1.4 1.4 1.4 9 318 Road ferry 2.500 dwt ROF2 0 0 0 1 0.1 0.1 0.1 0 0.1 9 319 Road ferry 5.000 dwt ROF5 0 0 0 1 0.1 0.1 0.1 0 0.1 9 320 Road ferry 7.500 dwt ROF7 0 0 0 1 0.1 0.1 0.1 0 0.1 9 321 Rail ferry 5.000 dwt RAF5 0 0 0 1 0.1 0.1 0.1 0 0.1 9 322 Barge Inland water way INW 1 1 1 1 1 1 1 1 1 9 401 Freight airplane FLYG 1 1 1 1 1 1 1 1 1 9