Quality Improvement of the Waste Management system
in ABB corporate Research Centre
Master Thesis Work (KPP-231)
30 Credits, advanced Level
Master program in product and process development- Production and logistics
Israt Jahan
Report Code:Commissioned by:
Tutor(ABB AB): Anders Eriksson
Tutor (Mälardalen University): Stig Björdahl Examiner: Sabah Audo
Abstract
Saving the environment is one of the most important issues for this living earth. Today, concern is growing about continually improving the quality of the environment. All types and sizes of organizations are prioritizing their attention to the environmental effects of their activities. Therefore, organizations select approaches to achieve environmental performance and to continually improve their environmental management system.
Companies and manufacturers produce most of the waste. Waste can be harmful for the environment if it is not processed properly. The government imposes rules and regulations to the company to handle the waste materials properly. Handling the waste properly and caring about the environment can also be an issue of creditability and reputation for a company.
ABB Corporate Research Centre conducts various types of research. Hence, 24 types of labs have been established there to help the research work of testing and analyzing different types of metals, chemicals, oils, etc. As a result, wastes are produced more frequently. The research Centre has a management department that is responsible for waste handling. The research Centre also cares about the environment and is aware of its reputation. Therefore, the research Centre is willing to improve the entire waste management system and provide efforts to establish a suitable and fixed waste handling process. This Master’s thesis will focus on the analysis of the system and the improvement of the existing process.
In this study, readers will come to know about ABB AB Corporate Research Centre’s waste handling process and how to use DMAIC tools for quality improvement of the process. The study also covers analysis of current payment methods and proposes suggestions to optimize the method. Recommendations will be made to improve the research Centre’s existing waste handling system.
Acknowledgements
First, I would like to express my gratitude to ABB AB Corporate Research Centre, Västerås, Sweden for giving me the opportunity to conduct this master thesis at their company. This thesis gives me an opportunity to apply my theoretical knowledge into the practical field. I would like to thank them for keeping faith in me from the beginning. I have gathered experience and earned knowledge during this thesis period at ABB Corporate Research Centre that is valuable for me and will help me in my career.
I would like to show my appreciation for my supervisor from ABB Corporate Research Centre Anders Eriksson for his guidence, helpful suggestions, and encouragements.
I would like to express my deep gratitude to my unversity supervisor Stig Björdahl for his leadership and valuable suggestions. I find myself lucky that the theory I used in my master thesis was taught by him earlier in my Master’s study. I am so greatful that I had him as my supervisor, teacher and mentor.
I would like to express my gratitude to my examiner Sabah Audo for his valuable guidance and suggestions for my Master’s thesis.
I would like to heartily thank my husband M. Jahirul Islam for his ideas, help, suggestion, continous support, and encouragements.
Contents
1 INTRODUCTION……… 9 1.1 Thesis Background………..9 1.1.1 Company Background………..9 1.1.2 Problem Background………..101.2 Aim of the Project………..11
1.3 Problem statement………..11 1.4 Project directives………....12 1.5 Project Limitations……….12 1.6 Methodology………..13 1.6.1 Analytical approach………....13 1.6.2 Action Approach………...13 1.6.3 System Approach………....14
2 THEORETICAL BACKGROUND AND SOLUTION METHOD………….16
2.1 Waste Management………....16
2.2 5 steps for effective Waste Management………17
2.3 Quality Improvement Methodologies……….18
2.3.1 FADE Model………...18
2.3.2 FADE Model in Action………....20
2.3.3 PDSA………...20
2.3.4 Six Sigma……….22
2.3.5 Root Cause Analysis (RCA)………25
2.4 The Scenario of Quality Tools………28
2.4.1 Tools for Quality Improvement………28
2.4.1.1 Checklist………..29
2.4.1.2 Pareto Analysis………29
2.4.1.3 Scatter Plot………...30
2.4.1.4 Control Chart………31
2.4.1.5 Flow Chart or Process Mapping………...32
2.4.1.6 Fishbone Diagram……….32
2.4.1.7 Histogram………..33
2.4.1.8 5S...34
3 APPLIED SOLUTION PROCEDURES……….36
3.1 Project Information………36
3.2 Project formulation……….36
3.3 Planning for Solution………..36
3.4 Choosing Appropriate Tools………...37
3.5 Process Description……….38
3.5.1 Description………...38
3.6 Amount of Waste………39
3.7 Working Model DMAIC (Six Sigma)………43
3.7.1 Define………..43
3.7.2 Measure………44
3.7.3 Analysis………44
3.7.3.1 Fishbone Diagram………..44
3.7.3.2 Current Cost Calculation………47
3.7.4 Improve………..47
3.7.5 Control………...47
4 RESULTS & ANALYSIS………...48
4.1 Analysis...48
4.2 Results ...58 5 CONCLUSIONS & RECOMMEDATIONS………...61 6 REFERENCES………..66
List of Figures
Figure 1: Detailed action research model……….. 14
Figure 2: System approach model……….. 15
Figure 3: FADE Model………....19
Figure 4: PDSA Model………....22
Figure 5: Six Sigma (DMAIC) Model………...24
Figure 6: The process of DMAIC………....24
Figure 7: 4Q Method (ABB Group)………...28
Figure 8: Checklist………....29
Figure 9: Pareto Analysis………... 30
Figure 10: Scatter Plot………. 30
Figure 11: Control Chart………. 32
Figure 12: Flow chart………32
Figure 13: Fishbone Diagram………33
Figure 14: Histogram……….34
Figure 15: Work process flow………38
Figure 16: Graph for burnable waste produced in every year in ABB CRC…………. 40
Figure 17: Graph for office paper waste produced in every year in ABB CRC………..41
Figure 19: Graph for metal waste produced in every year in ABB CRC………..43
Figure20: Fishbone Diagram for finding root cause of the stated problem………45
Figure 21: The Centre’s Fishbone Diagram ………...46
Figure 22 Graph for waste transportation in 2007………..49
Figure 23: Graph for waste transportation in 2008……….50
Figure24: Graph for waste transportation in 2009………..51
Figure 25 Graph for waste transportation in 2010………..52
Figure 26: Graph for waste transportation in 2011……….53
Figure 27: Graph for metal waste transportation in 2011………...55
Figure 28: Percentage of savings ………60
List of Tables
Table 1: Offer table from vafab miljö………..481. Introduction
This Master’s thesis is based on quality improvement of waste management systems in a corporate research centre at Västerås in ABB AB, Sweden where different types of projects are conducted continually and wastes are produced. Today, society and the government are aware of sustainable development through recycling and disposing of waste properly. This social awareness and binding make waste management and the quality and efficiency of this management system important. However, the system might be inefficient or may not maintain proper quality standards because of a lack of importance to the company, lack of awareness, or as a consequence of mismanagement.
1.1. Thesis Background
The focus of this section is the background of the thesis. At first, the company’s background and field of work will be discussed. Then, the background of the problem will be discussed, giving the reader an idea about the environment surrounding the problem.
1.1.1.
Company background
ABB is a Swedish/Swiss-based company, which is both a service and manufacturing
company. It is the result of a merger of Asea AB of västerås, Sweden and BBC Brown Boveri Ltd of Baden, Switzerland in 1988 and the headquarters is in Zurich, Switzerland. These two merged companies changed their name to ABB (Asea Brown Boveri) in 1996. The company has 135,000 employees and operates in 100 countries worldwide. The company operates five divisions: power products, power systems, discrete automation and motion, low voltage products and process automation.ABB has seven research centres around the world. One of the ABB corporate research centres is located at Västerås, Sweden 100km from Stockholm. Almost 400 employees are working in corporate research centres. ABB develop technologies for future products and services in research and development (R&D) centres for ABB’s core businesses.In R&D centers, ABB focus on
Automation control and optimization Mechatronics and robot automation
Automation networks and wireless technologies Electrical machines and power electronics Power systems and apparatus
Nanotechnology and advanced materials technologies Chemistry and environmental technologies
The corporate research centre has 24 laboratories to aid in the ongoing research (e.g., a material investigation lab, high voltage power lab, material insulating lab, mechanical lab, and acoustic lab). This thesis will be conducted in only a few labs, including the material investigation lab, mechanical lab, chemical lab, and high voltage lab. These labs produce waste materials (e.g., metals, deponi, glass, hard paper, oil, and chemical).
1.1.2.
Problem background
The Corporate Research Centre at Västerås, ABB AB works mainly in power sector research area. The different types of research are conducted for introducing new techniques, products, and improvements to the existing techniques in the power sector. As a consequence, researchers are required to investigate the properties and characteristics of materials, oils, chemicals, machines, etc. For this purpose, all of these laboratories have been established in this research centre for testing. To construct test setup and as a byproduct of this testing, substantial volumes of waste products are produced. The organization must make work contracts with many waste management companies and entrepreneurs to collect the wastes. These waste management organizations and entrepreneurs also provide instructions about ways to dispose of the wastes properly in the right container. However, because of the diversity of the waste materials (e.g., metals, plastics, papers, oils, chemicals) as well as the lack of awareness of importance, different types of waste can be mixed together inadvertently. These cannot only result in higher payments to the waste management company but also can pollute the recycle area where the research centre is dumping the wastes.
1.2. Aim of the Project
The aim of the project is to analyze the processes of the waste management system of the corporate research centre at Västerås in ABB AB, Sweden and if possible, improve the quality of this process. Waste management is very important for the sustainable development of the world and is connected to the reputation of the company. The focus of the work is to analyze the waste management system, identifying problems, improving efficacy and making employees more aware regarding the importance of proper waste processing.
1.3. Problem Statement
ABB Corporate Research Centre has many laboratories for testing different types of materials, chemicals, and oils, which help the researcher to obtain valuable data and information. These experimental works produce a great deal of unwanted materials that have no value. However, if all of the wastes are processed properly when they are placed into waste containers, some of the waste can be reused. Unfortunately, ABB employees have a lack of focus or lack of awareness about the waste types and the value of separating the wastes. Therefore, the wastes may be mixed together from the beginning of the process. Consequently, the company must pay additional money to the waste handling entrepreneur company or authority for handling mixed wastes. ABB is willing to implement an improved and efficient system so that the employees become aware about the waste types, sort and place them into the correct waste containers, and properly fulfill the requirements of the waste handling procedure. This proper waste handling procedure not only saves money for ABB but also elevates the company’s reputation as an environmentally conscious company.
For example, in a chemistry lab, bottles filled with liquid are used by laboratory personnel and then put directly into a waste container. They is no labeling on the bottle regarding what type of chemical was used for testing nor do they clean the bottles properly. Collection agencies do not have knowledge about the chemical that was inside the bottle. Therefore, they examine the liquid in their own lab; there is an extra charge for this testing. The company also needs to determine a solution to avoiding this type of cost as much as possible, partly by raising the awareness of the matter with laboratory personnel.
The recycle area of the ABB Corporate Research Centre where the large waste containers are placed has hygiene problems and is unprotected. Therefore, people in residential areas nearby use the company’s recycle area to dump their waste. Thus, the hazardous wastes become mixed with ordinary waste in this way as well. Changes are necessary to assuage this problem.
The materials in the laboratories are not all organized properly and some have not been handled properly. For example, the labels for some cabinets are unclear, while some cabinets have no labels, and materials are not sorted according to type. Consequently, laboratory personnel are planning to improve these issues in the laboratory system.
There are several waste-related companies that have subcontracts to collect and handle the waste from ABB Corporate Research Centre; ABB pays each a monthly bill. However, there is a lack of documentation, information, and monitoring related to the waste handling and payment method. Therefore, ABB thinks that this system needs to be analyzed and improved.
As a consequence of all of these problems, the main objective of this thesis is to study the waste management system, identify the causes behind these problems, improve efficiency, and educate the employees so they have greater awareness of the importance of proper waste processing.
1.4. Project Directives
The plan of this project is to analyze the waste management system of the Corporate Research Centre. The waste handling process in the laboratories of the company also will be studied. Defining the problem and analysis-related issues of the waste management system will be accomplished by using quality improvement tools and methods. In addition, an interview will be conducted with lab personnel as part of this thesis work.
1.5. Project Limitations
The limitations of this work work include the following:
The study is limited to the quality improvement of waste processing of the corporate research centre at Västerås in ABB AB, Sweden.
All of the analyses have been performed based on the information and estimation provided by the company personnel.
Because of regulation, it is quite difficult to obtain proper information from the company. There are different types of laboratories in the corporate research centre but work is only
focused on five laboratories.
1.6. Methodology
Abnor and Bjerke (1994) identified three methods of research approaches; Analytical, Action and System approaches. Those approaches are described below:
1.6.1. Analytical approach
The analytical approach is a method that breaks down the systems to its elementary parts and attempts to study the causes and effects of the interactions of various parts in detail by adjusting or revising variables to determine the effects on the system. In the case of an organization, it is breaking down of a system into the various workstations to attain an understanding of their interactions (Rosnay, 1997).
1.6.2. Action approach
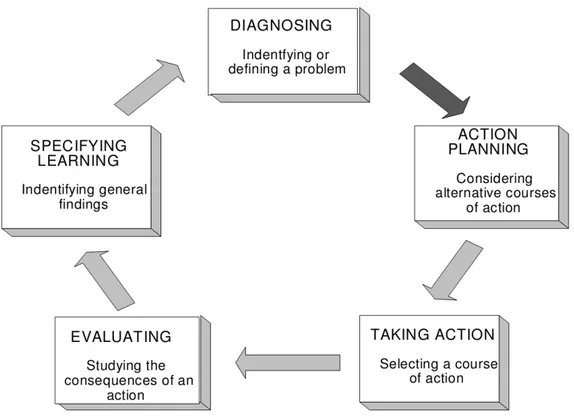
Many researchers have used the action approach. The simple and comprehensive definition is given by Rory O’Brien (1998); action research is “learning by doing”. The action approach is an approach with dual commitments, where the researchers focus on studying the systems and working together with other members to present a possible solution for a problem. The best result can be achieved when a series of continuous diagnosis, data collection, analysis, and interpretation can be performed properly. This approach is used in the real world and not in experiment and will be suited best to a situation where the problem is too ambiguous to formulate for research (Atem & Yella,2001). The phases of action approach are presented in Figure 1 (Susman, 1985).
Figure 1: Detailed action research model (Susman, 1985).
1.6.3. System Approach
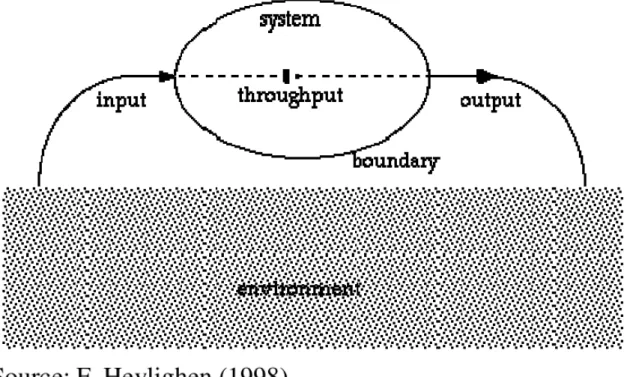
The system approach is a dynamic and complex structure with subsystems, which interacts with each other. The systems approach is a situation where a component part will work in a different way if it is isolated from the entire system. Management should observe improvement using a holistic perspective and understand the linkages and interaction between the various workstations in the whole organizational system (Atem & Yella, 2001). Observing the system in a holistic manner facilitates communication in the entire system and avoids the silo effect (Heylighen, 1998). The model of a system approach is presented in Figure 2 (Heylighen, 1998)
Figure 2: System approach model (Heylighen, 1998).
In this research, an action research is used to conduct this work. The author is participating in the organization and searching for a way to find the appropriate solution to the problem. The research has been performed using the following steps:
1. First, the data and information are collected for analysis by observing the working process and interviewing the company personnel.
2. Different theoretical methods will be studied in a theoretical background to identify the synergy between the selected relevant theoretical method and the existing process.
3. Some quality improvement tools will be used for analyzing the problem and finding the root cause of the problem.
2.
Theoretical Background and Solution Method
The fundamental concept of improvement is to change some parameters of the process or system and analyze the results if the ultimate objective is not achieved, then reiterate the process. It is essential to change the system to achieve a new level of performance. The quality improvement methodology emphasizes changes in the process and systems for effective performance. The quality improvement theory is utilized to detect unnecessary, inefficient, incorrect parts of a process and/or system and change them for a more efficient performance level.Wastes are produced during various activities within a company; as a consequence, waste management is an important issue for companies today. The government ensures that wastes that are produced as byproducts are handled properly. For example, if it is recyclable, then a company must recycle it. Otherwise, the company must dispose of it properly and companies must follow the environmental law to ensure safety of the environment. Therefore, companies need to make sure their employees put waste in its proper place to ensure safety in the recycle area and in the working environment, as well as the environment of the earth.
In the theoretical background section, the waste-related theories, methodologies, and tools of quality improvement will be discussed.
2.1. Waste Management
Any definition of waste invariably refers to lack of use or value or useless remains. This is different from useful production, as the waste product has a lack of value.
Waste management includes the formation, treatment, and disposal of wastes and their resulting materials (Lemann, 2008). The root cause of the problem can be solved by analyzing the entire flow of materials and human activities.
Waste management is a science that involves logistics, environmental impact, social responsibility, and an organization’s waste disposal costs. It is also a process related to human resources, vehicles, governmental regulating bodies, and natural resources.
2.2. 5 steps for effective waste management
A waste management system has a flow cycle with five steps (i.e. monitoring, collection,
transportation, processing, disposal/recycling). A company can make their development
sustainable by managing their waste effectively and responsibly through these steps.
Monitoring:
Determining the waste management needs, identifying opportunities for recycling and determining ways to minimize waste output and to review the progress of waste minimization. A customer can take note of the progress of their efforts to become more environmentally friendly and a more efficient business through keeping records of the various waste streams.
Collection:
Related to logistical organization to guarantee that container will not overfill and waste does not remain overly long. The correct container size and service frequency are essential to prevent overspill or excessive smell. Identification stickers must be available and proper outside color of the container can be used to identify the correct container for different wastes. Locks, chains, lids, and bars can help to prevent public access and can restraint non-trained personnel from placing rubbish in incorrect bins.
Transportation:
The organizing of transport vehicles that have the authorization and capability to collect and transport the specific wastes from customers’ place of work to a landfill or processing plant. Wastes must be transported by special vehicles that are only designed and designated for waste transportation. For example, general waste requires a vehicle that must have thicker, compacter walls compared to cardboard and paper transporting vehicles. Therefore, a series of vehicles is required by the customer to meet these waste management needs. Vehicles, drivers, and the company need licenses and approval for transporting waste from the proper council areas. EPA standards and general public safety need to be upheld. Safety standard are more important and vital to the transportation of clinical and hazardous wastes. Drivers must be training for emergency circumstances that may arise.
Processing:
Processing involves separating recyclable and non-recyclable wastes. Recyclable wastes undergo treatment and then are packed as raw materials after treatment. These raw materials are used for production in the factory. Non-recyclable wastes are delivered straight to a landfill after treatment. Liquid and hazardous wastes are sent to a treatment plant to become less harmful for human health and the environment.
Disposal/recycle:
Non-recyclable wastes are disposing of in a landfill. Legal authorities must approve the landfill sites. Legal authorities guarantee that specific wastes must be buried at correct depth so that hazardous chemicals do not enter the soils, water tables, water systems, or pipe systems. The recyclable wastes used to produce raw materials are sent to factories for producing products. Then these products are sold on the market. Companies can purchase such products and help to sustain the environment and natural resources.
2.3. Quality Improvement Methodologies
2.3.1.
FADE ModelThe FADE model is one of the models used to improve quality. It consists of four steps:
Focus: In focus step, it is important to define and verify the process and consequently identify
the area that needs to be improved. It is necessary to determine the area of improvement, as it will help to gain a clear idea about gathering data and information.
Analyze: The issue is to define the problem, to prioritize according to the merits of the problem,
then to collect data as well as required information to establish a baseline through analysis. The next step would be to find root causes of the problem and then indicate possible solutions.
Develop: In this step an action plan or solution is developed based on the data and required
information for improving the process or problem. Implementation, communication and a monitoring plan are also included in this step.
Execute: The action plan is implemented on a pilot basis and used to monitor and record the
effects on the problem. To ensure success, it is important to evaluate the system. An illustration of the FADE model and working process are presented in Figure 3.
2.3.2.
The FADE Model in Action:For example, a motel person is focusing on the linens cycle of housekeeping. After analyzing the method of handling linens, he or she found that the laundering process has a problem and is inefficient. He develops a step-by-step process (i.e., washing, drying, folding, and storing the linens). He was expecting that it would speed up the process and eliminate the wasted effort. Then he executes the process with his staff and evaluates the process efficiency a week later. The FADE model cycle works in this way. When a change is made, then one must start all over again:
evaluate the effects of changes; focus on further improvements;
analyze the problem and find root causes of the problem; develop a plan or solution for improvement; and
Execute and evaluate it again.
Repeat the cycle process until the goal is achieved.
2.3.3.
PDSAThis method is used widely for quality improvement, especially, in health care system for rapid cycle improvement. One of the unique features of this model is the cyclical nature of Affecting and assessing changes. Most are accomplished effectively through small and frequent PDSAs rather than large and slow ones (Berwick, 2003) before changes are made system wide (Berwick, 1998., Langley, 1996).
The purpose of PDSA quality improvement efforts is to establish a functional or casual relationship between changes in process and outcomes (Hughes, 2008). Langley and his colleagues, suggest three questions before using PDSA cycles:
1. What is the project goal?
2. When the goal will be reached, how it will be known? 3. What will be done to reach the goal (Hughes, 2008)?
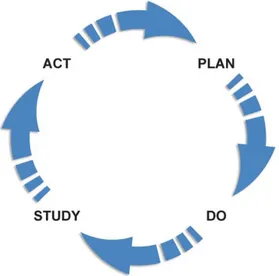
“The PDSA cycle starts with determining the nature and scope of the problem and then data and information are collected. Results from the implementation study are assessed and interpreted by reviewing several key measurements that indicates the failure or success.” (Hughes, 2008). The PDSA model consists of four steps. The illustration of the PDSA model is presented in Figure 4. Each step has different function that is given below:
Plan: Identify the problems and possible causes. The Quality improvement tools help to identify
problem and causes. Identify the opportunity for improvement and define the objectives.
Do: Collect data and information and analyze them. Make changes to improve the problem. Study: Check the results and effects of these changes on the situation. Find out the sources of
errors and reassess the measurement data. Were the results of the change better or worse or a lateral change?
Act: Standardize the changes and work on further improvements, if the result is successful.
Determine other ways to change the process or identify different causes for the problem, if the outcome is not yet successful.
Figure 4: The illustration of the PDSA Model (Wiseman and Kaprielian, 2005).
2.3.4.
SIX SIGMASix sigma originally designed as a business strategy, involves improving designing and monitoring process to minimize or eliminate waste while optimizing satisfaction and increasing financial stability (Pande et al., 2000). The performance of a process or the process capability is used to measure improvement by comparing the baseline process capability (before improvement) with the process capability after piloting potential solutions for quality improvements (Barry et al., 2003). Six sigma consists of two primary methods. One method is a way to inspect process outcomes and count the defects, calculate a defect rate per million and use a statistical table to convert defect rate per million to a sigma metric (Hughes, 2008). This method is suitable for pre-analytic and post-analytic processes. The second method uses estimates of process variation to predict process performance by calculating a sigma metric from the defined tolerance limits and the variation observed for the process (Hughes, 2008). This method is applicable for analytic processes as the precision and accuracy can be determined by experimental procedures.
Six sigma uses a five-phased process: define measure, analyze, improve and control (DMAIC). The illustrations of the six sigma phases are presented in Figures 5 and 6. The descriptions of the five phases are as follows:
Define: The first step is to define the problem and set a goal. Asking questions or analyzing the
current issues or a fundamental understanding helps to obtain a methodology to solve the problem. Focus not only on outcomes but also processes. Find the areas of improvement using the quality tools. Determine the benefits of future improvements.
Measure: Measure the operation process and collect necessary data; use tools if necessary. Look
for other data that help to measure the problem. This is a critical phase of the project.
Analyze: Analyze the data, find the root cause of the problem, and analyzing the problem by
using various types of quality tools. Then discover the process that necessary for improvements.
Improve: Improve the process to eliminate the cause of problem. Monitor the implementation. If
further improvement needed, then find the possible cause of the problem and develop solutions.
Control: Control the process or system so that the defects or faults do not occur again. Establish
Figure 5: Six sigma (DMAIC) Model (Lean Sigma Institute, 2004)
2.3.5.
Root cause analysis (RCA)Root cause analysis is a formalized investigation and problem solving approach focused on identifying and understanding the underlying causes of an event as well as potential events that are intercepted (Hughes, 2008). The organization to develop and implement an action plan consisting of improvement designed to reduce future risk of events and to monitor the effectiveness of those improvements (Joint Commission Resource, 2003).
RCA is a technique, which is used to identify trends and assess risk that can be used whenever suspected human error with the understanding that system, rather than individual factors are likely the root cause of most problems (Hughes, 2008). An RCA is a reactive assessment that begins after an event retrospectively outlining the sequence of events leading to that identified event, charting casual factors and identifying root causes to examine the event completely (Rooney et al., 2004).
The aim of RCA is to discover the underlying cause of an error by looking at enabling factors such as lack of education using a qualitative process. Those involved in the investigation to ask a series of key question (Hughes, 2008) and to find out the root cause of the problem. RCA has four major steps in the process:
Data collection Causal factor charting Root cause identification
Recommendation and implementation
Step one-data collection: The first step is to collect data. The casual factor and root causes
associated with the event cannot be identified without complete information and an understanding of the event. The majority of time is spent analyzing an event and gathering data.
Step two- causal factor charting: Causal factor charting provides a structure for investigators to
organize and analyze the information gathered during the investigation to identify the gaps and deficiencies with the investigation progresses (Rooney et. al., 2004). The causal factor chart
simple sequence diagram with logic tests. When an investigator collects the information about the occurrence, the preparation of causal factor chart should begin as soon as possible. They begin with skeleton chart but when more facts that are relevant are discovered, the chart is modified. The causal factor chart should drive the data collection process by identifying required data (Rooney et al., 2004). Data collection ends after the investigators are satisfied with the chart. As soon as the entire occurrence has been charted out, the investigators are in a good position to identify the major contributors to the incident, which is called as causal factors.
Step three-root cause identification: The investigators begin to identify the root cause after all
the causal factors have been identified. This involves the use of a decision diagram, called the root cause map, to identify the underlying reason or reasons for each causal factor (Rooney et al, 2004).
The map structures of reasoning process help the investigators to obtain the answers to questions about why causal factors exits. The root cause identification helps the investigators to identify the reasons the event occurred.
Step four-recommendation and generation: The next step is to generate the recommendation.
When root causes of a particular causal factor are identified, then recommendations are generated for preventing its reoccurrence.
2.3.6.
4Q MethodABB uses the 4Q method for making quality improvements . There are four quadrants of this method. Therefore, the name 4Q comes from these four quadrants. The improvement team will progressivly measure, analyze, improve and then control the root cause of the problems as they step through each quadrant. ABB makes significant improvements to their bussiness procedure using simple quality tools and a four step process.
The four quadrants that make up the 4Q method are Q1 measure, Q2 analyze, Q3 improve, Q4 sustain. It is important to work through the method if a company wants to have the benefits of Q4 improvement.
Skipping any quadrants will give a solution but this solution may not be the best one. The descriptions of four quadrants and why they are important are given below:
Q1 Measure:
It is important have the capability to define the issue when beginning the work. In the Q1 measure, it is necessary to understand what will be improved. This quadrant can be completed by measuring the improvement area, defining the issue, and collecting data about the current situation. A well defined problem can be solved easily.
Q2 Analyze:
After the issue is defined, it is necessary to determine the reason behind the issue. The requiement of quadrant 2 is to identify and verify the root causes. Prioritize the work based on the root cause with the greatest effect when the analyis has been performed. If the analysis has been completed properly, Q2 provide the clear map concerning where to make the improvements in the process.
Q3 Improve:
This is the quadrant where a solution is developed and implemented of the problem or improved the process (Burleson, 2009). Sometimes, more actions are needed to eliminate the problem. In this case, verifying the solution is required, which is perfect to remove the cause of the problem and make sure that, it stays in place after the solution.
Q4 Sustain:
After completing the above three steps, it is important to keep documentation so that the employee can learn about proces.It is also important to provide training to other employees about improving processes. The Q4 activity helps to keep the organization moving forward. It is important sustain the gains made from Q4 completion. The illustration of the 4Q method is presented in Figure 7.
Figure 7: 4Q Method (Burleson, 2009)
2.4. The scenarios of quality tools
2.4.1. Tools for Quality Improvement:
The quest for improving quality and lowering cost for production, transportation, process etc. is continuous. Consequently, the number of tools for quality improvement is increasing continually. Companies are bound to select from a limited number of tools which may not be best suited for their problems. Companies must consider that some tools that work for a successful company may not work for their company. Depending on the condition, they should select the best tool that will fit for their company’s environment. Examples of some improvement tools are listed below:
2.4.1.1. Checklist
This is a list of items that are carried out in a particular operation. It guides the operation as well as its purpose to collect data. “They provide a snapshot of process being studied and reveal underlying patterns, including the frequency of an event or activity” [Atem and Yella, 2001]. They are used under operative conditions to ensure all necessary actions or activities have been taken before the decision has been made. It also helps the decision making simple and effective. The illustration of a checklist is presented in Figure 8.
Figure 8: The illustration of a checklist.
2.4.1.2. Pareto Analysis
A pareto analysis is a graph of a bar chart, which ranks the causes of problem with descending order of significance. The illustration of the pareto analysis is presented in Figure 9. The presented pareto analysis states that 20% of the people owned 80% of the wealth, which implies that few key causes (20%) produced majority of the problems (80%). Therefore, if we solve these few causes, we will have a greater possibility of success.
Figure 9: Pareto analysis
2.4.1.3. Scatter Plot
A scatter plot is a graph that showing the relationship between two variables that both relates to the same event with an X-axes and Y-axes. The Y-axes represents the dependent variable and the x-axes represent independent variable. The illustration of scatter plot is presented in Figure 10. A scatter plot is especially useful, as there are a large number of data points. They give the following relationship between two variables:
Strength;
Shape – linear, curved or other; Direction – positive or negative; and Presence of outliers.
The clustering of points along a line results by a correlation with two variables.
2.4.1.4. Control Chart
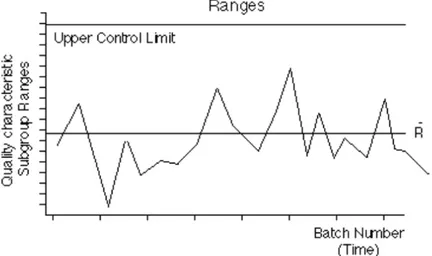
The control chart is a graph that is used for show how the process changes over time; data are plotted as a function of time. The illustration of a control chart is presented in Figure 11. It has a center line for the average, which is an upper line for upper control limit and a lower line for lower control limit. Historical data provide these lines. We can draw conclusions, whether the process variation is consistent (i.e., in control) or it is unpredictable (i.e., out of control, affected by special causes of variation) comparing current data to these lines.
Variable data are used in pairs in the control charts. The average or the centering of the distribution of data from the process is monitored by the top chart and the range, or the width of the distribution is monitored by the bottom chart. Control is used to determine whether a process is stable (in statistical control) and to predict the expected range of outcomes from a process.
Figure 11: Illustration of a control chart.
2.4.1.5. Flow Chart or Process Mapping
A flow chart is a diagram that shows the materials flow and information of a process from input to output. It helps individuals or groups to see or examine the relationships between various activities. By using this chart, it is possible to identify the sources of a problem or discover problem area that needs to be improved. The illustration of a flow chart is presented in Figure 12.
Figure 12: Illustration of flow chart.
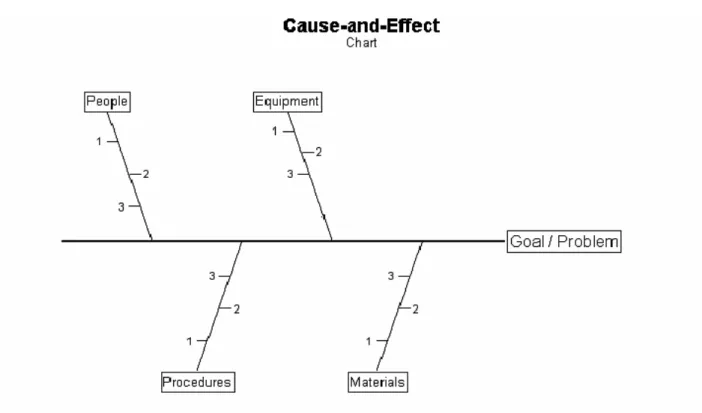
2.4.1.6. Cause and Effect or Fishbone Diagram
The Fishbone diagram was developed by Japanese quality control statistician Kauro Ishikawa. It is an analysis tool that gives a systematic way to identify the effects and causes that make or
contribute to the effects. It may be referred to as a cause and effect diagram because of the function of the fishbone diagram. It is used to determine the root cause of a problem or issue. The illustration of a Fishbone diagram is presented in Figure 13.
Step - by - step instructions are given below:
The name of the quality problem (the effect) is placed in the box at the far right of the diagram.
Draw a center line (the spine) and from the central line, draw a diagonal line like bone of a fish that represents the grouping causes of the problem. For example four M’s (i.e., Machine, Method, Measurement, and Materials) can be used by problem solvers.
Identify different causes and list them along the appropriate diagonal lines. If there present any other causes, draw a line and more branches off the line to
describe other factors that contribute to those causes.
Figure 13: The illustration of a Fishbone diagram.
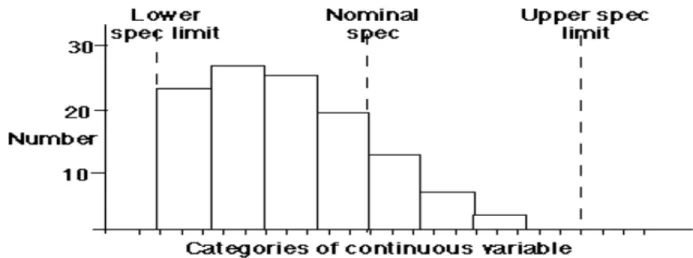
2.4.1.7. Histogram
a table. It is allowed to operate within an upper and lower tolerance limits. The illustration of an exemplary histogram is presented in Figure 14.
Figure 14: Illustration of an exemplary histogram.
2.4.1.8 5S
The 5S system is based on the English translations of five Japanese words which describe standardize cleanup:
Seiri – Sort through and sort out: Sorting through all the tools, materials etc. according to the usefulness and keep what is necessary in the work area. Other unnecessary things are discarded or relocated. Clean out the work area. This will provide more productive work in the work area. Seiton – Set in order and set limits: Tools, equipment’s and materials must be arranged systematically so that they are easy to find, use and return. There must be a place for everything and everything must always be in the right place to reduce the time needed to find things.
Seiso – Shine and inspect through cleaning: the workplace must be keep neat and clean. The work area is cleaned and everything is restored to its place at the end of the each shift and an inspection is made while doing so.
Seiketsu - Standardize: Make sure all the procedures are obvious so that defects or error stand out.
Shitsuke – Sustain: Maintaining these rules day after day, year after year. The total benefit of 5S will be reaped because it leads to positive habits.
Step – by- step instructions
1. Determine the necessary tools, equipment’s etc. within the workplace and also identify unnecessary thing and label it red post.
2. Find place to keep everything that are left. Label the place according to the use of the materials.
3. Clean everyday as routine work. 4. Repeat step 1 -3.
The aims of 5S are:
Eliminate waste from the workplace. Reduces the non-value added activities.
Establish an environment, where continuous improvement is embraced. Improve safety.
3. Applied Solution Procedures
There were discussions of different theories and tools about quality improvement and there are theories about waste management. Appropriate theories will be chosen in this section.
3.1 Project information
ABB AB Corporate Centre is doing a great deal of experimental work at the Centre. Therefore, there are various types of materials coming there for testing and various experiments. It is the responsibility of the research Centre personnel to keep the waste materials in the right places to help the research Centre provide better management of waste. However, much of the time, employees are not motivated to do this. The research Centre is involved with many entrepreneurs for waste management. Therefore, they pay a greater amount of money and there is no exact information about waste handling generated by the entrepreneurs. Additionally, the research Centre has other problems related to waste management.
3.2 Project formulation
The objective of this study is to analyze the management system related to waste and make the system more efficient. . In this system, how waste is containerized and how employees are made aware of waste distribution will be analyzed. At the same time, how employees in the laboratory act will be analyzed regarding keeping the environment inside the laboratory clean. In addition, the payment method and other activities related to the entrepreneurs will be included in the analysis. All of the information and necessary data to perform the required analysis have been provided by the research centre.
3.3. Planning for solution
The analysis-based study dealing with the assessment and improvement of quality in a waste management system has been planned in such a way that once the project is finished, the company will obtain the solution to the problem. The project has been done with two steps of planning to meet the project objectives:
The first step of planning is to analysis the whole management system in the research centre, to interview people related to the laboratory, to observe the process of producing waste and placing waste in the recycle area as well as treatment of the waste by the entrepreneur. Those works help to obtain a clear view of the problem and help to identify which types of quality tools are better for the solution
The last step of planning is to the problem and determines the root cause of the problem by using quality improvement tools. For example, a fishbone diagram is used to determine the root causes of the problem. The potential solution will be recommended to the research centre after finding the causes of the problem.
3.4. Choose appropriate tools
Waste management is an important factor in the world environment because these unwanted products cause many problems in the environment and place human life and other ecological life in danger. Today, government is much more aware about handling waste and environmental policies. Therefore, there is a great deal of legislation about waste management for companies. In addition, the reputation of a large company depends on proper waste management and how much they illustrate that they care about the environment. ABB AB is quite aware of their reputation in the global market regarding its stance on environmental stewardship. For that reason, they always try to improve their system as best as possible.
In theory, several types of improvement methodologies are discussed. Each of the methodologies is discussed about measuring the problem, finding the root cause of the problem, and recommending improvements in quality. The research centre has its own methodology concerning quality improvements. The 4Q method is used for improving the quality of the system or any other problem. However, the Six Sigma method will be used in this project to analyze the problem and determine the solution to the problem because it is used worldwide for problem solving and improvement processes. In addition, Six Sigma also will be more suitable in this research.
Six Sigma has DMAIC as a working model, which will be used in this thesis. For the purposes of this thesis, first, one must identify the problem of the project and determine what to
problem. After determining the cause of the problem, action items will be suggested for short-term improvement as well as continuous improvement.
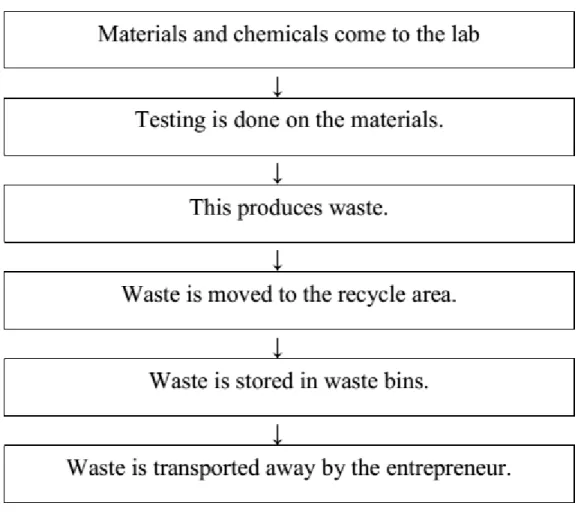
3.5. Process description
The flow chart of work process flow is illustrated in Figure 15.
Figure 15: Work process flow
3.5.1. Description
There are 24 laboratories in the ABB AB Corporate Research Centre, Västerås, Sweden. Various laboratories have their own activities and are different from each other laboratory. The laboratories are involved with all of the various ABB project work. Different types of tests are needed for their project execution and the related laboratories provide the service. The ABB AB
corporate centre’s researcher as well as ABB’s other factories use the laboratories for testing their samples. However, sometimes some laboratories work on contract for other companies by project with a standard fee.
Different types of samples come from different sections of the ABB Corporate Research Centre. The related laboratory receives the sample and obtains an overview of the expected outcome from the customer. The laboratory personnel test the sample in various ways. The results of the testing are sent to the customer and the report of the results is kept in the ABB database.
There are many materials, both small and large, sorted into the waste containers. There are different kinds of wastes produced in each of the different laboratories. For example, in the material investigation laboratory, wastes are generated that require burning: metal (copper, aluminum, and iron), organic solvents, plastics, paper, wood, and food waste. Those wastes that are produced in different testing areas are kept in waste containers inside and outside of the laboratory. Hazardous waste is kept underground and treated with special care.
Once a waste container is filled with waste, it is moved to the recycle area that is located outside on the company grounds. The entrepreneur comes once per week to collect the waste; however, sometimes when a waste container is full the research centre personnel must make a call and request the entrepreneur to collect the waste and provide an empty container.
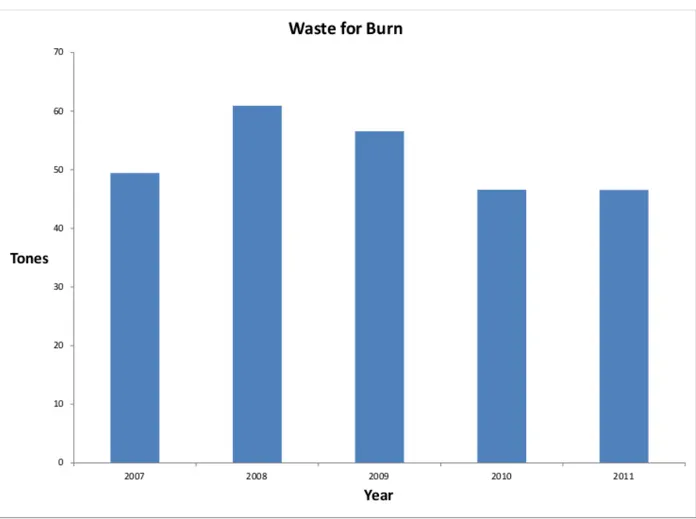
3.6. Amount of Waste
Different type of waste produced here. These wastes are allocated in different containers that are picked up by the entrepreneur for better treatment and recycling processes. The research centre must pay for the transportation and rent of the container to the entrepreneur. Some of the wastes are compensationable (e.g., metals and cardboard that the entrepreneurs take from the research centre). The research centre has a lack of information about the amount of waste produced throughout the entire centre. It has been observed that there are a myriad of ways to increase the efficiency in the waste transportation and handling system. By analyzing with the fishbone diagram, it has been found that if the management team increases the monitoring on the waste management system somewhat, the efficiency can be improved significantly.
There are six different kinds of waste materials deposited in the recycle area and other waste deposited underground. These six waste material types are considered for this thesis work. First, we must determine how much waste is produced per year and then calculate the current transportation cost and future costs of these waste materials.
The waste materials that are burnable are placed in a large container supplied by the entrepreneur with a monthly charge. When the container is filled, the research centre personnel call the entrepreneur to pick up the waste. The amounts of burnable waste produced from 2007 to 2011 are presented in Figure 20. It can be observed from the figure that in 2007, burnable waste produced in CRC was 49.43 tonnes, 60.93 tonnes in 2008, and 56.56 tonnes in 2009, 46.56 tonnes in 2010 and 46.52 tonnes in 2011.
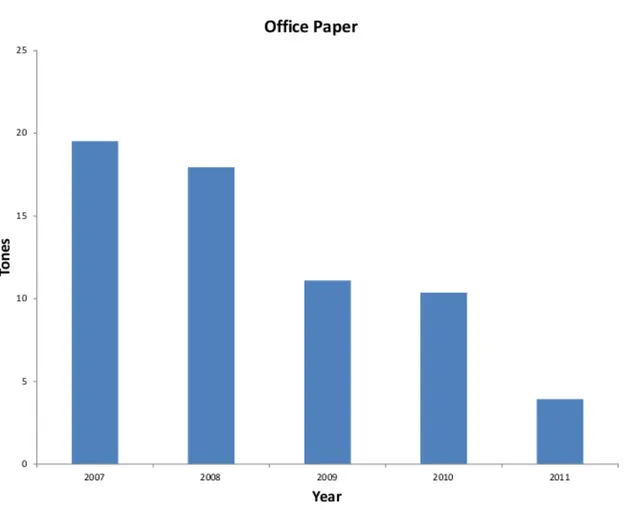
The other type of waste is office paper. Paper is commonly used in official work. Therefore, there is a large amount of office paper produced as waste in CRC every year. The amounts of office paper waste are presented in Figure 17 from 2007 to 2011. From the graph, it has been observed that 19.52 tons of office papers were produced in 2007, 17.94 tons in 2008, 11.1 tons in 2009 and 10.37 tons 2010. Only 4.00 tons of office papers were produced in 2011. However, in 2012, this will increase significantly; as there is a great deal of construction work occurring.
Figure 17: Office paper waste produced in every year in CRC.
company uses that cardboard for their own purposes but most of the time an entrepreneur picks the cardboard up every week. The amounts of cardboard waste as a function of year (based on assumption) are presented in Figure 18. From this graph, it can be observed that 6.52 tonnes were collected by an entrepreneur in 2007, 7.15 tonnes in 2008, 6.87 tonnes in 2009, 5.96 tonnes in 2010 and 6.65 in 2011.
Figure18: Graph for cardboard waste produced every year in CRC
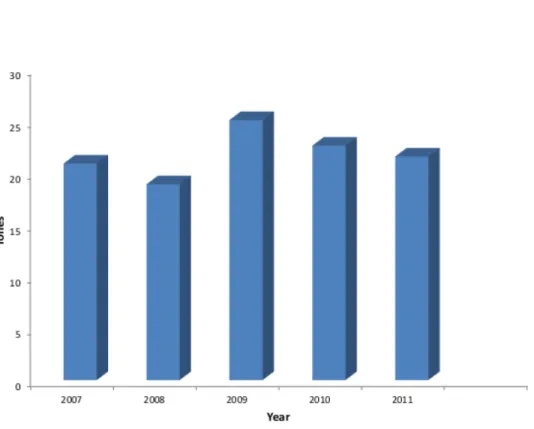
Different type of metals are used in the laboratories for experiment. Therefore, in CRC, metal waste also can be found; it is sent to be recycled and reused as raw materials by the manufacturing company. The research centre receives some compensation from the entrepreneur when they provide the metals waste to the entrepreneur in the proper way, as advised by the entrepreneur. The yearly amounts of metal wastes found in CRC are presented in Figure 19
(based on assumption). From the graph, it can be observed that the entrepreneur collected metal waste of 20.86 tonnes in 2007, 18.86 tonnes in 2008, 25.05 tonnes in 2009, 22.58 tonnes in 2010 and 21.54 tonnes in 2011.
Figure 19: Metals waste produced every year in CRC.
3.7. Working model DMAIC (Six Sigma)
3.7.1. Define
The first step is to define the problem of the project. The working area of the project is waste management in the ABB AB corporate research centre. Different types of scientific research are occurring there. Consequently, there are unwanted materials produced there that are
referred to as waste. A problem occurs when the waste materials are mixed when placed in waste containers. This could lead to the recycle area becoming dirty and less safe and this causes additional charges stemming from the handling of mixed wastes. In addition, the laboratory appears less organized than it could be at times. The research centre needs to review the waste transportation and payment method because it appears to be inefficient.
3.7.2. Measure
All of the data and required information are provided by the research centre. More information has been gathered by observing working processes and taking interviews to the employee. Based on the provided data and collected information, we will measure the root causes of the problem by using a fishbone diagram.
3.7.3. Analysis
Analysis has been performed with a fishbone diagram. Other graphs, tables, bar charts are also used to analyze the data to determine the root cause of the problem.
3.7.3.1. Fishbone diagram
As stated early, the Fishbone diagram diagram has been used to determine the root cause of the problem. It is a very effective tool for problem solving. A fishbone diagram is frequently used by a company to determine the cause of a problem.
In the fishbone diagram (Figure 20), it can be seen that the categories of people, system, and environment have the main issues. The root causes of the problem in the people section are lack of focus and lack of knowledge. Employees working in the laboratory sometimes have reduced focus when separating wastes and they have no clear knowledge about wastes and their usefulness, cost effectiveness and the effects of mixing wastes. There is no visual information and labels are unclear in most waste bin areas. Sometimes, the environment is unclean and materials in a working area are misplaced after work. Therefore, the management team should take the necessary steps to avoid those causes.
Figure 20: The fishbone diagram generated to determine the root cause of the stated problem The other problem is the payment method to the entrepreneur is not efficient. The research centre pays more each month and too many entrepreneurs are engaged in transportation and handling of the waste materials. This makes it somewhat difficult to obtain information and leads to payment variation. Therefore, a fishbone diagram is used to find the cause of the
better policies and procedures concerning waste management. Additionally, the management team could begin monitoring the system wholistically on a yearly basis.
3.7.3.2. Current Cost Calculation
The various wastes are collected by three entrepreneurs. Vafabmiljo collects burnable waste and office paper, IL Recycling collects cardboard, and Kolback collects metal waste. The monthly payment is fixed even though entrepreneurs do not collect waste every month.
Burnable waste and office paper waste. The research centre pays 8226.31 SEK per
month without VAT.
So, the research centre pays 8226.31 * 12 = 98715.72 SEK every year without VAT.
Cardboard waste. Currently, the research centre pays the entrepreneur 1325 SEK per
month.
The research centre pays 1325 * 12 = 15900 SEK per year.
Metals. Because some of the metals have value, the research centre receives 1700 SEK
(an assumption) every month from the entrepreneur after paying the transportation fee and container rental.
Therefore, the research centre contains (1700 * 12) = 20400 SEK per year from the entrepreneur.
Considering these payments, it can be seen that the research centre pays a great deal of money for waste transportation and does not receive as much compensation as is possible from proper management. Another thing is that different entrepreneurs handle each type of waste. Therefore, it is quite difficult to keep data about waste produced in the laboratory.
3.7.4. Improve
This research has determined the root cause by using a different method. Details of the analysis will be elaborated upon in the analysis section. The recommendation regarding improvement will be stated in the Conclusions and Recommendations section.
3.7.5. Control
The improvement will be sustainable when continuous improvement will be implemented to focus on the issue. Continuous improvement will help to reduce the problem.
4. Results & Analysis
4.1 Analysis
Vafabmiljö have made a comprehensive offer concerning collection and payment of all of the waste materials. We then calculated the payment according to the offer and compared the benefits of the offer to the current system. The offer from Vafabmiljö can be seen in Table 1.
Table: 1 Offer table from vafab miljö
In the Vafabmiljö offer, we can see that the emptying fees for cardboard, junk, and burnable waste are 225 SEK, 550 SEK and 698 SEK respectively. The entrepreneur will take treatment costs for burnable waste and pay some money for cardboard and metals because they are compensation able wastes that will go for recycle.
4.1.1.Transportation Interval
First we consider burnable waste.
Figure 22 is an illustration of the volume of waste collected in 2007.
Figure 22: Graph for Waste transportation in 2007
0 1 2 3 4 5 6 7
To
n
e
s
Month
Waste transportation in 2007
Figure 23 is an illustration of the volume of waste collected in 2008.
Figure 23: Graph for Waste transportation in 2008
0 1 2 3 4 5 6 7 8 1 2 3 4 5 6 7 8 9 10 11 12
To
n
e
s
Month
Waste transportation in 2008
Figure 24 is an illustration of the volume of waste collected in 2009.
Figure 24: Graph for Waste transportation in 2009
0 1 2 3 4 5 6 7 8
To
n
e
s
Month
Waste transportation in 2009
Figure 25 is an illustration of the volume of waste collected in 2010.
Figure 25: Graph for Waste transportation in 2010.
0 1 2 3 4 5 6 7 8
To
n
e
s
Month
Waste transportation in 2010
Figure 26 is an illustration of the volume of waste collected in 2011.
Figure 26: Graph for Waste transportation in 2011.
0 1 2 3 4 5 6 7 8
To
n
e
s
Month
Waste transportation in 2011
In figures 22-26, it can be seen that entrepreneurs did not collect waste during each month. However, the research centre paid a bill for each month. They were not aware of this. The research centre paid extra money to the entrepreneurs every year.
As we consider the payment method according to Vafabmiljö’s offer, the research centre must begin paying the bill in terms of an emptying fee and treatment cost rather than based on a monthly bill. This will help to save money for the research centre.
In the above graph, it also appears that the container was not full of waste but the company called the entrepreneur to collect waste because the payment is not depend on how many times the entrepreneur collects waste. However, in the new offer, the payment is dependent upon an emptying fee. Therefore, the research centre will need to be aware of how many calls for collection are made.
To analyze the above graph, we made the conclusion that when a container is full (i.e. when burnable wastes have reached above 6 tones), then the research centre personnel can call the entrepreneur to collect the waste. This reduces the number of collection times from 12 per year to 7 per year, thus reducing payments under the offer by Vafabmiljö. In this situation, the research centre needs to pay the full bill when waste will be collected by Vafabmiljö. During months when a container is not collected by Vafabmiljö, the research centre will only pay the container fee.
For Cardboard waste
Research Centre personnel supplied data about the collection time of the cardboard waste by the entrepreneur (i.e., IL Recycling). It has been seen that the entrepreneur collected waste two to three times in a month although the container was not full. The research centre paid the bill every month.
Now we consider Vafabmiljö’s offer. There is no monthly cost but the research centre has to pay for collection, only monthly container rental and a per time emptying fee. Therefore, if the research centre can reduce the number of emptying times, the cost will be reduced. It has been seen from data that the entrepreneur collected the waste at times when it was not full. Therefore, if the research centre personnel only call the entrepreneur to collect the waste when the container is full, it will help to reduce the number of times containers are emptied and reduce the overall fee.
By analyzing the data, we conclude that the research centre can reduce emptying by 24 to 30 times per year.
To analysis the data, we can get a conclusion that Research Centre can reduce emptying time 30 times to 24 times.
For metal waste
Figure 27 shows when and how much waste collected by entrepreneur in 2011.
Figure27: Graph for Metal waste transportation in 2011
In In Figure 27, it can be seen that the entrepreneur collected the container every month and the research centre paid the cost every month. According to Vafabmiljö, the research centre would now pay an emptying fee instead of a monthly fee. In this way, the research centre can reduce the cost of collection. The research centre personnel need to be aware of that. In this case, the research centre can reduce emptying time from 12 times to 8 times. These data are assumed by
0 0.5 1 1.5 2 2.5
To
n
e
s
Month
Metal waste transportation in 2011
the author for calculation because no data was available from the centre about metals waste collection.
4.1.2.New cost calculation
According to offer, first we calculate burnable waste and office paper waste together
Rent for the burnable waste container and office paper waste container per month is: (2946 + 50) SEK = 2996 SEK.
Therefore, rent for the containers per year will be: (2996*12) SEK = 35952 SEK.
The emptying fee and treatment cost are not included with payment for office paper and newspaper waste. Because the entrepreneur collects it and sends another company for the recycled office paper and newspaper waste, only the container fee is included.
Calculating the emptying fee and treatment cost of burnable waste, we see that the emptying cost is 698 SEK and treatment cost is 735 SEK / tonne.
The entrepreneur emptied the container 12 times in 2012 although the container was not full when they took the waste. When the waste bin is emptied depends on when the research centre personnel call for collection. Therefore, management can reduce the number of times the container is emptied from 12 to 7 if the personnel work to be more aware regarding waste management. The burnable waste collected by the entrepreneur last year was 46.52 tonnes.
Total emptying and treatment cost for burnable waste per year will be: (698 * 7) + (735 * 46.52) = 39078.2 SEK
Total cost for burnable waste and office paper is: (35952 + 39078.2) = 75030.2 SEK
Therefore, the difference of the current cost and new cost is: (98715.72 – 75030.2) = 23685.52 SEK
It can be seen that the fixed payment per month is not the best option for the research centre. This method costs much more because the payment depends on how much waste is generated by laboratory personnel. With this method, the research centre pays 98715.72 SEK per year but if they would make payments according to the weight of the waste, then it would cost less than the current payment.
Cardboard waste
We have seen that the research centre pays 1325 SEK per month for cardboard waste. Now we consider the vafabmiljö offer and calculate the new cost of cardboard waste. The research centre pays 1325 SEK per month to the entrepreneur for transporting the cardboard waste after they obtain compensation from the entrepreneur.
Therefore, the research centre pays (1325 * 12) SEK = 15900 SEK per year.
The entrepreneur collects waste 30 times per year but it can be reduced to 24 times per year with 6.65 tons of cardboard handled by the entrepreneur.
Therefore, the cost according to the new offer will be container rent and an emptying fee and the research centre will be paid a compensation fee for the cardboard.
The cost will be:
(164 * 12) + (225 * 24) – (300 * 6.65) SEK = (1968 + 5400 – 1995) = 5373 SEK / year. The difference in the cost is 15900 – 5373 = 10527 SEK.
Metal waste
Metal waste calculation is based on an assumption because the research centre cannot find any data for metal waste. They obtain money from metal waste; it is compensation able because it goes to a company for recycling.
The cost included a container fee and emptying fee and the research centre obtains some remuneration for providing various types of metals to the entrepreneur, which are then used as raw material for manufacturing industries after being recycled.
The container fee is 164 SEK per month and the emptying fee is 500 SEK per month. The entrepreneur takes metal waste every month and the research centre is paid every month. The research centre obtains some remuneration after this monthly bill. However, the waste pick up time can be reducing to eight times:
The cost will be (164 * 12) + (500 * 8) = 5968 SEK.
The research centre’s compensation from the entrepreneur is: (1750 * 21.54) − 5968 = 31727 SEK.
Comparison table between current cost calculation and new cost calculation is below:
Table 2: Cost comparison Table
It can be seen that if the research centre takes the new offer, burnable and cardboard waste costs can be reduced from 98715.72 SEK to 75030.2 SEK and 15900 SEK to 5373 SEK per year respectively. In addition, the research centre can obtain 31727 SEK in compensation for their metal waste.
From the above calculation, we can reach a decision that the research centre should accept the new vafabmiljö offer. This will help to save some money concerning waste transportation and all waste will begin to be handled by one entrepreneur will help the research centre to keep data and other information about waste in a single database.
4.2 Results
In this research thesis, first I have determined the scope of the entire waste disposal issue in the corporate research centre. After obtaining all types of data and information from the research centre, I have analyzed them with fishbone diagrams, bar charts, etc.
The results from these analyses are summarized below:
1. Figure 20 is the first fishbone diagram for the stated problem. I have obtained results to analyze this diagram. The main causes of the problem are people, the material environment, and the system. I have found that employees have a lack of focus when separating waste and they have a lack of knowledge about separating large amounts and