HYDROGEN GAS IN SWEDEN
Is hydrogen gas a viable energy carrier in Sweden?
KATARINA BJÖRKMAN
ABSTRACT
Detta arbete innefattar att undersöka hur vätgas kan användas i Sverige, dels för
energilagring men även som bränsle för fordon. Den ökande användningen av varierande förnyelsebara energikällor i den svenska energimixen innebär problem med stabilitet i kraftnätet, något som energilagring kan vara en lösning på. Samtidigt finns mål att fasa ut fossila energikällor, exempelvis diesel och bensin, något som transportsektorn är mycket beroende av.
Enligt intervjuerna så är ett av de stora hindren för att implementera vätgas i Sverige att det saknas standarder och regelverk. Likaså framkommer det att de intervjuobjektens projekt inom vätgas i nuläget inte är pengamässigt lönsamma. I beräkningarna framkom det att varken det nuvarande fallet eller målfallet leder till lönsamma investeringar. Den sektor som är närmast lönsamhet är transportsektorn som kräver antingen en minskning på 90 % av komponenternas kostnad eller en 10-faldig ökning av priset på fossila bränslen.
Slutsatserna dragna i denna studie är att det finns användningsområden för vätgas inom flera områden, bränsle, energilagring och inom industrin, utöver den användningen inom
industrin som finns idag. För att ha en hållbar produktion av vätgas bör denna vara med elektrolys som baseras på emissionsfri elektricitet, exempelvis från solceller. De ekonomiska målen, i studien kallat target case, är inte tillräckliga utan ytterligare kostnadsminskningar kommer att behövas.
PREFACE
I choose the topic for this thesis because of the reoccurring topic during my studies at Mälardalens högskola, namely energy storage and renewable fuel. My intention with this thesis has been to bring hydrogen into the spotlight and show how it can be used and what is necessary to make it happen.
This thesis had not been possible without the support of my family as well as the support and help from my supervisor Esin Iplik and examiner Jan Skvaril. I also want to take the
opportunity to thank Anders Neander who has been helping with inspiration and discussions to keep the thesis on track
Västerås in June 2020
SUMMARY
There is a rising demand for energy and at the same time, fossil fuels need to be phased out due to global warming. This means that the energy needs to come from renewable energy resources, for instance photovoltaics. One issue with such energy sources is that they may have variating production which can induce issues with stability in the electrical grid. This study aims to investigate hydrogen in Sweden as energy storage and vehicle fuel. Methods used are literature review, interviews and calculations.
According to the interviews are one of the main issues with implementing hydrogen the lack of standards. Today it is the local fire department who approves of hydrogen system which induces irregularities in the handling. It is also said that none of the projects in the interviews is profitable moneywise, something that also can be seen in the calculations. In order to reach break-even some serious changes with regarding costs of components or the alternative, for instance, fossil fuel and electricity. The application closest to break even is transportation which demands a 90 % decrease in component price or a 10-fold increase in fossil fuel price. In conclusion, there are future applications for hydrogen as energy storage, vehicle fuel and in industry, apart from the current industry applications. The most sustainable way to produce hydrogen is via electrolysis with emission-free electricity. In order for hydrogen to become economically viable, the target case is not enough but even greater cost reductions are needed.
CONTENT
1 INTRODUCTION ... 1 1.1 Background ... 1 1.2 Problem area ... 3 1.3 Aim ... 4 1.4 Research questions ... 4 1.5 Delimitation ... 5 1.6 Contribution to field ... 5 2 METHOD ... 6 2.1 Interview method ... 6 2.2 Calculation method ... 7 2.2.1 Solar radiation ... 72.2.2 Power and heat production and storage ... 7
2.2.3 Economics ... 8 3 THEORETICAL FRAMEWORK ... 9 3.1 Hydrogen production ... 9 3.1.1 Hydrocarbon reforming ... 10 3.1.2 Electrolysis ... 11 3.2 Hydrogen utilization ... 11 3.2.1 Fuel cells ... 11
3.2.2 Hydrogen internal combustion engine ... 13
3.3 Hydrogen storage ... 14
3.3.1 Compressed ... 15
3.3.2 Liquified ... 15
3.3.3 Hydrides ... 16
3.4 Hydrogen Safety ... 16
3.6.2 Vehicle fuel ... 18 3.6.3 Other ... 20 4 CURRENT STUDY ... 20 4.1 Buildings ... 20 4.2 Agriculture ... 22 4.3 Transportation ... 22 4.4 Industry ... 23 4.5 Solar data ... 23 4.6 Calculation data ... 24 5 RESULTS ... 27 5.1 Interview ... 27 5.1.1 Development strategist ... 27 5.1.2 Technical director ... 28 5.2 Calculation ... 30 5.2.1 Buildings ... 30 5.2.2 Agriculture ... 32 5.2.3 Transportation ... 34 5.2.4 Industry ... 35 6 DISCUSSION ... 36 6.1 Hydrogen applications ... 36 6.2 Hydrogen production ... 37
6.3 Hydrogen as energy storage ... 38
6.4 Hydrogen as fuel ... 39
7 CONCLUSIONS ... 39
8 SUGGESTIONS FOR FURTHER WORK ... 40
APPENDIX 1: INFORMATION LETTER AND INTERVIEW QUESTIONS FOR INTERVIEW WITH DEVELOPMENT STRATEGIST
APPENDIX 2: INTERVIEW WITH DEVELOPMENT STRATEGIST
APPENDIX 3: INFORMATION LETTER AND INTERVIEW QUESTIONS FOR TECHNICAL DIRECTOR
LIST OF FIGURES
Figure 1 Global solar irradiance for Västerås (Sweden) (STRÅNG Data Extraction, n.d.) ... 2
Figure 2 Wind speed from weather station Enköping Mo (Sweden) (Ladda Ner Meteorologiska Observationer | SMHI, n.d.) ... 2
Figure 3 Energy end-use 2015 per sector in Sweden (Energimyndigheten, 2017a) ... 3
Figure 4 Overall workflow for thesis ... 6
Figure 5 Hydrogen production pathways (Viswanathan & Aulice Scibioh, 2008) ... 10
Figure 6 Schematic over FC reaction (Gupta, 2009) ... 12
Figure 7 Scaled electricity demand for building ... 21
Figure 8 Scaled heat demand for building ... 21
Figure 9 Distribution of energy consumption in agriculture (Andersson et al., 2018) ... 22
Figure 10 Total radiation on PV ... 24
Figure 11 Operational strategy calculated building ... 24
Figure 12 Operational strategy off-grid house ... 29
Figure 13 Distribution of initial cost for the building in current case ... 31
Figure 14 Distribution of initial cost for the building in target case ... 31
Figure 15 SOC building current ... 32
Figure 16 SOC building target ... 32
Figure 17 Distribution of initial cost for agriculture in current case ... 33
Figure 18 Distribution initial cost for agriculture in target case ... 33
Figure 19 Distribution of initial cost transportation current case ... 34
Figure 20 Distribution initial cost transportation target case ... 34
Figure 21 Distribution initial cost for industry in current ... 35
Figure 22 Distribution initial cost for industry in target case ... 35
LIST OF TABLES
Table 1 Operating conditions for different types of FC (Gupta, 2009) ... 13Table 2 Comparison of fuel storage (Gupta, 2009) ... 14
Table 3 Li-ions battery properties (Demirocak et al., 2017) ... 15
Table 4 Development targets for EV Everywhere project (Demirocak et al., 2017) ... 15
Table 5 Explosive limits (Gupta, 2009) ... 16
Table 6 Zero sun system (Nohrstedt, 2017) ... 18
Table 7 Comparison between requirements for cars and machines (Cornander et al., 2018) 19 Table 8 Fuel consumption in Sweden 2015 (Energimyndigheten, 2017b) ... 22
Table 9 Energy content for fuels (Energimyndigheten, 2017b) ... 23
Table 10 Comparison monocrystalline PV panels (Jämförelsesida, n.d.) ... 25
Table 11 Hydrogen system data (Schoenung, 2011) ... 25
Table 14 System size for building ... 31
Table 15 LCOE for building ... 31
Table 16 System size agriculture ... 33
Table 17 Annual energy demand and production agriculture ... 33
Table 18 System size transportation ... 34
Table 19 system size for industry in current ... 35
NOMENCLATURE
Symbol Description Unit
𝜃 Angle of incidence ° 𝐼! Beam radiation W/m2 𝑅! Beam ratio % 𝐶𝐴𝑃𝐸𝑋 Capital expense $ 𝐶 Cost $ 𝑛 Day of year 𝛿 Declination ° 𝜂 efficiency % 𝐸 Energy Wh or J 𝜌" Ground reflectance % 𝜔 Hour angle ° 𝐼 Income $ 𝑟 Interest % 𝜙 Latitude °
𝐿𝐶𝑂𝐸 Levelized cost of energy $/Wh
𝑁𝑃𝑉 Net present value $
𝑂𝑃𝐸𝑋 Operational expenses $/year
𝑃 Power W
𝐼 Radiation W/m2
𝐼#$% Radiation at standard test conditions W/m2
𝑆𝑂𝐶 State of charge %
Symbol Description Unit
𝐼$ Total radiation W/m2
𝜃& Zenith angle °
ABBREVIATIONS
Abbreviation Description
AFC Alkaline fuel cell ATR Autothermal reforming BEV Battery electrical vehicle CHP Combined heat and power DMFC Direct methanol fuel cell DOE Department of Energy EC Electrolyser cell ESS Energy storage system EV Electrical vehicle FC Fuel cell
FCEV Fuel cell electrical vehicle GDP Gross domestic product GHG Greenhouse gases
HICE Hydrogen internal combustion engine HVO Hydrotreated vegetable oil
HYBRIT Hydrogen Breakthrough Ironmaking Technology ICE Internal combustion engine
IRENA The International Renewable Energy Agency MCFC Molten carbonate fuel cell
PAFC Phosphoric acid fuel cell
PEMFC Proton exchange membrane fuel cell POx Partial oxidation
PV Photovoltaic
RES Renewable energy sources SMR Steam methane reforming SOC State of charge
Abbreviation Description
SOFC Solid oxide fuel cell
VRES Variable renewable energy sources
DEFINITIONS
Definition Description
Conventional
fuel The fuels that are used today, for instance, diesel and gasoline. Energy
carrier A mean to store and transport energy derived from primary energy. Energy
density Amount of energy per volume unit
HVO A form of biodiesel produced from vegetable oil or animal fat.
Machine Fuel-powered tools such as tractors, cranes, excavators, land movers.
Specific
1 INTRODUCTION
With rising energy demand in the world and global warming, it is necessary to obtain energy from other sources than fossil fuels, but the use of renewables comes with its share of issues such as variating production. This study focuses on how hydrogen can be used as energy storage and vehicle fuel in Sweden when the share of renewables increases and fossil fuels are phased out in the energy mix.
1.1 Background
Viswanathan and Aulice Scibioh (2008) writes that both world population and energy demand is expected to increase in the future. To ensure a sustainable future, energy used cannot be derived from fossil sources, such as oil. According to Srinivasan and Stefanakos (2019) will both automotive and stationary applications need clean energy and fuel storage. Rifkin (2002) argues for how mankind is heavily dependent on fossil fuels as an energy source. He also states that if society is not prepared for the next oil and natural gas peak there is a risk that dirtier fossil fuels will be utilized. Such fuels are for example tar sand and heavy oil and utilizing them would both be more costly and also contribute with more CO2
emissions. There are several different forecasts about when the petroleum supply will end, but according to Gupta (2009), it is likely that it ends in 2050.
Global warming is a serious issue derived for over-dependence on fossil fuel according to Gupta (2009) with several dire consequences which Rifkin (2002) mentions as decreasing fauna, melting of ice, elevated sea level, more extreme weather and decreasing crops yield. In the Paris Agreement the goal is to keep global warming below 2 °C and preferably below 1.5 °C, but according to IRENA (2019), with the current emissions and trends will result in global warming of 3 °C. To avoid this a transformation of the global energy sector is needed. This transformation includes a higher share of renewable energy sources (RES), innovation and investment.
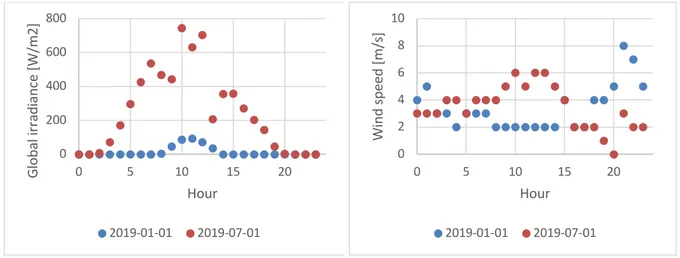
IRENA (2017a) states that two common solutions for decarbonizing the energy sector are wind and solar power, such as PV. The issue with these technologies is that their production varies over time which makes them so-called variable renewable energy sources (VRES). IRENA (2017b) describes VRES as being weather dependant with both seasonal and diurnal variations.
Figure 1 and Figure 2 show how VRES can change over time. The figures show global irradiance and wind speed for two dates: first of January and first of July 2019. Regarding global irradiance, there is a significant increase during the summer while the changes in wind speed are varying more with time than with season.
Figure 1 Global solar irradiance for Västerås (Sweden)
(STRÅNG Data Extraction, n.d.) Figure 2 Wind speed from weather station Enköping Mo (Sweden) (Ladda Ner Meteorologiska
Observationer | SMHI, n.d.)
Both IRENA (2017a) and IRENA (2017b) explain that to have a stable and functioning electrical grid both load and production needs to be in balance in real-time and IRENA (2017a) puts it in other words that enough electricity needs to be produced to cover both the losses in the grid and the consumers demand. Mansilla et al. (2018) write that if balance cannot be kept, the frequency will not be maintained. This can, for example, lead to
blackouts, according to Sabeeh and Gan (2016). When implementing a grid with a high share of VRE following parameters need to be considered according to IRENA (2017b): firm
capacity, flexibility, transmission capacity and stability. Both flexibility and stability are about handling the variability in production.
IRENA (2017b) and Jiang et al. (2018) presents that one way to handle variations in electrical production with VRES is energy storage. It is stated by IRENA (2017a) that storage will be a key part of the future development of the energy system. Further lists IRENA (2017b) that there are five main types of storage: electro-chemical, electro-mechanical, chemical, pumped hydro storage and thermal storage. The most common solution is pumped hydro storage which accounted for 96 % of the installed storage capacity during 2017. Batteries, which is an electrochemical energy storage, accounted for 1.9 % of the installed capacity during the same period, but is a technology which is rapidly increasing. Hydrogen can be used as a chemical energy storage where excess electricity is used for the production of hydrogen gas which can be utilized later.
According to Energimyndigheten (2017a), Sweden had a total supply of energy during 2015 of 525 TWh whereas the end-use was 372 TWh. The end-use was divided as presented in Figure 3 over the different sectors. Of the total supplied energy was 148 TWh from fossil sources which corresponds to approximately 28 %. In the transportation sector, the two main fuels are diesel and gasoline which stands for approximately 68 TWh of the 87 TWh.
Energimyndigheten (2017b) also support this statement by saying that approximately ¼ of the annual energy is consumed by transportation and that 2015 accounted fossil fuels for 85.1 %. Usage of fossil fuels in the transportation sector is the main cause of emissions in
0 200 400 600 800 0 5 10 15 20 Gl ob al ir ra di an ce [W /m 2] Hour 2019-01-01 2019-07-01 0 2 4 6 8 10 0 5 10 15 20 Wi nd s pe ed [m /s ] Hour 2019-01-01 2019-07-01
Figure 3 Energy end-use 2015 per sector in Sweden (Energimyndigheten, 2017a)
Gupta (2009) and Viswanathan and Aulice Scibioh (2008) describes hydrogen as the most common element on earth and Gupta (2009) continues by describing it as the essential element in both organic matter and water. Due to hydrogen’s chemically reactive nature, it is rarely found chemically free and is often found bound to either carbon or oxygen atoms. One of the issues with hydrogen is the security aspect; it has lower required ignition energy, a wider flammability range, higher flame velocity and a higher flame temperature than more ordinary fuels such as gasoline. There are problems regarding utilizing hydrogen as an energy carrier, mainly to have a cost-effective production and storage.
Mansilla et al. (2018) state that hydrogen can be used in several applications as either an energy carrier or chemical product. According to them, the annual demand is 60 million ton of hydrogen where most is used in refining and fertilizer industry. Gupta (2009) adds that as an energy carrier, hydrogen is a high-quality one and can be used with high efficiency. Forecasts show that demand for hydrogen will increase in the future. According to Mansilla et al. (2018), it will increase to approximately 200 million ton annually by 2050. This development is linked to the pricing of fossil fuels and carbon emissions, but the driving factors will be the political will and the economic competitiveness of hydrogen.
1.2 Problem area
The major part of the total energy supply in Sweden is already non-fossil but there is still 28 % which is fossil-based according to Energimyndigheten (2017a). For the power production and consumption following goals have been set by the Swedish government according to the report by SWECO (2018):
38% 1% 23% 1% 4% 2% 8% 0% 23%
Industry Construction Transportation
Forestry Government controlled business Agriculture
• 85 % lower emission by the year 2045 from businesses in Sweden compared to 1990. • 70 % lower emissions by the year 2030 from domestic transportation excluding
domestic aviation compared to 1990.
• By 2040 having a 100 % renewable power production, which is not an end date for nuclear power.
• 50 % more effective energy use (expressed as added energy per GDP) compared to 2005.
When eliminating the fossil-based energy it needs to either be replaced by a renewable energy source, removed by increasing the efficiency or a combination of both. Regarding increasing the share of RES, there are potential within the hydropower (approximately 30 TWh) but the main share is from protected rivers according to Svensk Energi (2015). This means that renewable energy needs to come from other sources. As mentioned earlier in the chapter Background, VRES needs to be combined with some form of storage to ensure stable access to electricity.
There is also the issue with fuel for transportation, farming and construction equipment. Cornander et al. (2018) state that machines are contributing to both emission of CO2 and
local air pollutants, in total 3.5 million tons of CO2 equivalents which is 7 % of the total GHG
emissions in Sweden. They also say that several municipalities have set goals to be free from fossil fuels by 2030. It is either necessary to shift to a renewable fuel or electricity, and both of these solutions come with problems such as load capacity and range. For example is there a rising demand for hydrotreated vegetable oil (HVO), according to Isaksson (2020), because of the increasing requirements to add biodiesel to ordinary fossil diesel which will lead to HVO being scarce.
1.3 Aim
The aim is to investigate the current status of hydrogen gas in Sweden, hydrogen gas’ future applications as energy storage and fuel for cars, trucks, construction and farming equipment. In the study, issues like security and storage solutions also will be investigated.
1.4 Research questions
• How is hydrogen gas used today in different application and what are the future applications?
• How can hydrogen gas be sustainably produced and used in large- and small-scale applications?
1.5 Delimitation
This is an inventory study and does not study the implementation in individual companies but aims to give a general perspective. Even though this study investigates methods of utilization, production and storage of hydrogen gas, this study does not aim to develop or design technology for this.
The focus for this is hydrogen in Sweden. This means that the solutions need to be suitable for Sweden and the Swedish climate, but literature presented can be covering other
geographical regions than Sweden.
As the problem area for this study cover targets of reducing emissions, this study will not use a system based on hydrogen production from hydrocarbons for calculations.
1.6 Contribution to field
Expected contributions from this work are to illustrate how hydrogen can be a way to reach the environmental goals in Sweden. The work is also expected to highlight what is necessary to have a successful deployment of hydrogen in Sweden.
2 METHOD
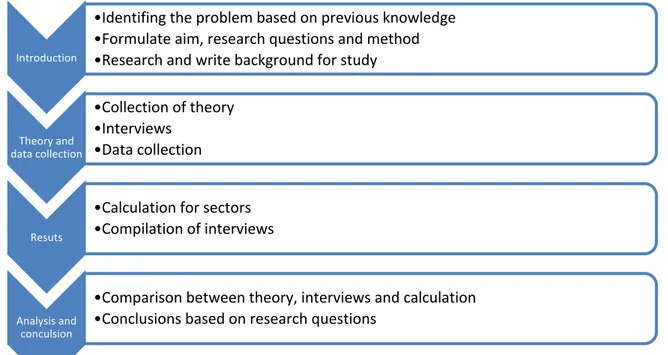
The main method for this study is based on literature review, interviews and calculation. A flowchart over the conduction of the study is presented in Figure 4.
Figure 4 Overall workflow for thesis
2.1 Interview method
Säfsten and Gustavsson (2019) describe that interviews can be used for collecting material regarding perceptions and experiences. Interviews can be structured, semi-structured or unstructured which is a description of how open-ended or close-ended the questions are. Two interviews will be conducted to collect information regarding actual hydrogen
applications and opinions regarding hydrogen utilization. The interview questions, which will be semi-structured or structured, will refer to the following topics:
• Component sizing and sizing criteria regarding system • Expected production and use
• Expected cost and returns
• Expected lifetime and maintenance
• Troubles occurring when planning and building • Security assessment
Introduction
•Identifing the problem based on previous knowledge •Formulate aim, research questions and method •Research and write background for study
Theory and data collection •Collection of theory •Interviews •Data collection Resuts
•Calculation for sectors •Compilation of interviews
Analysis and conculsion
•Comparison between theory, interviews and calculation •Conclusions based on research questions
2.2 Calculation method
The calculation, which will be done in excel, in this study will cover the size, performance and economics of hydrogen in different sectors. Calculated system will cover power production via PV system, hydrogen production via electrolysis and power and heat production via fuel cell (FC).
For the different sectors, the calculation will slightly differ. For the residential building hourly electrical and heat demand is available which makes it possible to arrange the calculations according to that, but for transportation, agriculture and industry the energy demand is only available on an annual basis. For these sectors, the system will be calculated in such a way that it covers the annual demand.
With the calculation, a sensitivity analysis will be conducted. It will be used for investigating what conditions with regards to the costs of system components, fossil fuels and electricity is needed to break even.
2.2.1 Solar radiation
The solar radiation calculations are based on the equations presented by Duffie and Beckman (2013). Declination (𝛿), Equation 1, is the angle between the suns position at noon and the equator. It is dependant of the day of the year, which 𝑛 represent. The angle of incidence (𝜃), Equation 2, which is dependant of the declination (𝛿), latitude (𝜙), slope surface azimuth (𝛾) and hour angle (𝜔), while the zenith angle (𝜃&), Equation 3, is used for calculation of the ratio of beam radiation (𝑅!), Equation 4. The ratio of beam radiation is the fraction of the direct
sun radiation that falls on an angled plane, which is used in calculating the total radiation (𝐼$), Equation 5.
𝛿 = 23.45 ∗ sin ,!"#(%&'())!"+ - Equation 1
cos 𝜃 = 𝑠𝑖𝑛𝛿 ∗ 𝑠𝑖𝑛𝜙 ∗ 𝑐𝑜𝑠𝛽 − 𝑠𝑖𝑛𝛿 ∗ 𝑐𝑜𝑠𝜙 ∗ 𝑐𝑜𝑠𝛾 ∗ 𝑠𝑖𝑛𝛽 + 𝑐𝑜𝑠𝛿 ∗ 𝑐𝑜𝑠𝜙 ∗ 𝑐𝑜𝑠𝛽 ∗ 𝑐𝑜𝑠𝜔 + 𝑐𝑜𝑠𝛿 ∗ 𝑠𝑖𝑛𝜙 ∗ 𝑠𝑖𝑛𝛽 ∗ 𝑐𝑜𝑠𝛾 ∗ 𝑐𝑜𝑠𝜔 + 𝑐𝑜𝑠𝛿 ∗ 𝑠𝑖𝑛𝛽 ∗ 𝑠𝑖𝑛𝛾 ∗ 𝑠𝑖𝑛𝜔 Equation 2 𝑐𝑜𝑠𝜃& = 𝑐𝑜𝑠𝜙 ∗ 𝑐𝑜𝑠𝛿 ∗ 𝑐𝑜𝑠𝜔 + 𝑠𝑖𝑛𝜙 ∗ 𝑠𝑖𝑛𝛿 Equation 3 𝑅! = '()* '()*! Equation 4 𝐼$ = 𝐼!𝑅!+ 𝐼+C,-'()./ D + 𝐼𝜌"C,0'()./ D Equation 5
2.2.2 Power and heat production and storage
The equation for calculating the power produced from the PV panels (𝑃(12312), Equation 6, is retrieved from How HOMER Calculates the PV Array Power Output (n.d.). In the original equation from the reference is the PV derating factor used, which according to PV Derating
Factor (n.d.) is a factor that includes power reducing elements such as wiring losses, but it
has been replaced with the PV efficiency (𝜂). 𝑃(12312= 𝑃4526+∗ 𝜂 ∗ C 7"
7#"$D
Equation 6
The change in energy in the storage (∆𝐸) can be described by Equation 7, which in this case is retrieved from Moran (2015). It is an energy balance and says that the change is equal to what comes in and goes out of the control volume, in this case, a storage.
∆𝐸 = 𝐸89− 𝐸(12 Equation 7
For the state of charge (SOC), Equation 8, is based on equations from J. Jiang and Zhang (2015). By combining Equation 7 and Equation 8, the general equations for SOC in the next timestep (𝑆𝑂𝐶(𝑡 + 1)), Equation 9. It can then be extended to consider if the electrolyser is charging the storage, Equation 10, or if the fuel cell is discharging the storage, Equation 11. 𝑆𝑂𝐶(𝑡) =::(2) %&' Equation 8 𝑆𝑂𝐶(𝑡 + 1) =:(2)-∆: :%&' Equation 9 𝑆𝑂𝐶(𝑡 + 1) = 𝑆𝑂𝐶(𝑡) +>∗∆: :%&' Equation 10 𝑆𝑂𝐶(𝑡 + 1) = 𝑆𝑂𝐶(𝑡) − ∆) * :%&' Equation 11
Equation 12 describes that the energy supplied by PV (𝐸@A) and fuel cell (𝐸B%) and used by
electrolyser (𝐸:%) must be equal to the electrical load (𝐸C(5+). This is based on the statement from IRENA (2017a) and IRENA (2017b) presented in the Background, that electricity produced and consumed must be equal.
𝐸C(5+ = 𝐸@A− 𝐸:%+ 𝐸B% Equation 12
2.2.3 Economics
For evaluation of the economics of the system the levelized cost of energy (LCOE), Equation 13, has been used. Hansen (2019) describes the LCOE as a measure of cost per produced unit of energy. 𝐿𝐶𝑂𝐸 =∑ $+,)-(/)12,)-(/) (314)/ 5 /67 ∑5/67: Equation 13
𝑁𝑃𝑉 = ∑9 7(2)0%(2)(,-4)/
2EF Equation 14
3 THEORETICAL FRAMEWORK
This chapter contains the literature review done for this study. It is containing theory and results from other studies which will be used for analysing the results from this study. Viswanathan and Aulice Scibioh (2008) writes that forecasts indicate that as the world population continues to increase, so will the energy demand. They also say that in order to have a sustainable future this energy must come from non-fossil sources. Such an energy carrier can be hydrogen which Mansilla et al. (2018) point out as they state that hydrogen is a solution to decarbonizing several sectors. Both Gupta (2009) and Viswanathan and Aulice Scibioh (2008) say that hydrogen can be considered as an ideal fuel and a flexible energy carrier. Gupta (2009) describes an ideal fuel as following: clean, unlimited, convenient and independent of foreign authorities. It is also stated by Schoenung (2011) that pairing RES with hydrogen energy storage is a good way to make use of excess energy.
Some of the benefits, as Gupta (2009) mentions, are the diversified supply of hydrogen and that the usage of it does not contribute with any emissions. Another benefit is the high specific energy where Viswanathan and Aulice Scibioh (2008) gives the example that
hydrogen has a specific energy of 142 MJ/kg while liquid hydrocarbons only have 47 MJ/kg. This means that the specific energy for hydrogen is three times higher.
3.1 Hydrogen production
When it comes to producing hydrogen, there are two main options according to Gupta (2009), either form hydrocarbons or electrolysis. Figure 5 below, which is based on the description of hydrogen production pathways by Viswanathan and Aulice Scibioh (2008), shows the overall possible way to go from primary energy source to hydrogen. For example, fossil fuels can be used in producing hydrogen from hydrocarbons and electrolysis, but to use it in electrolysis the fossil energy needs to be converted into electricity.
Figure 5 Hydrogen production pathways (Viswanathan & Aulice Scibioh, 2008)
3.1.1 Hydrocarbon reforming
Both references Gupta (2009) and Viswanathan and Aulice Scibioh (2008) say that one possible way to produce hydrogen is from hydrocarbons. But when hydrogen is produced from hydrocarbons, such as natural gas, CO2 is emitted, this is mentioned by amongst others
by Rifkin (2002). Gupta (2009) claims that for each ton of hydrogen produced from
hydrocarbons approximately 2.5 ton of CO2 is emitted. He describes that there are two kinds
of hydrocarbon processes and they are oxidative (Equation 15) and non-oxidative (Equation 16) processes. Oxidative processes are for example SMR, POx and ATR which are described more closely below.
𝐶9𝐻G+ 𝑜𝑥𝑖𝑑𝑎𝑛𝑡 → 𝑥𝐻/+ 𝑦𝐶𝑂 + 𝑧𝐶𝑂/ Equation 15
𝐶9𝐻G+ 𝑒𝑛𝑒𝑟𝑔𝑦 → 𝑥𝐻/+ 𝑦𝐶𝑂 + 𝑧𝐶𝑂/ Equation 16
Steam reforming (SR) is the most widely used method when it comes to producing hydrogen from hydrocarbons according to Viswanathan and Aulice Scibioh (2008). The most common type of SR is steam methane reforming (SMR) and says that this process has been providing the major part of hydrogen. The size of SMR plants can vary from less than 1 ton/hour to 100 ton/hour. According to Gupta (2009), the CO2 equivalent emissions for hydrogen
Gupta (2009) also writes about the process partial oxidation (POx). This process can be used with or without a catalyst for producing hydrogen.
The last hydrocarbon main process is autothermal reforming (ATR). Gupta (2009) describes this process as a combination of both POx and SMR.
It is also possible to convert other materials, containing hydrogen and carbon. Gupta (2009) say that with gasification, hydrogen can be produced from both coal and biomass. Because biomass is considered as carbon neutral the production of hydrogen is net-zero emissive.
3.1.2 Electrolysis
Another way to produce hydrogen is via electrolysis, which according to Gupta (2009) can be produced with any type of electricity: renewable, nuclear or fossil. The kind of electricity that is used affect whether the hydrogen can be considered as a sustainable energy carrier.
Cornander et al. (2018), Nordling (2019) and Gupta (2009) say that as long as the electrolysis is done with renewable electricity the hydrogen production will not cause any emissions. Mansilla et al. (2018) say that one operating strategy is to use excess electricity and convert it into hydrogen. The chemical reactions that happen in the electrolyser, according to Gupta (2009), is described in Equation 17. It shows that different reactions happen in different parts of the electrolyser, but the overall reaction is splitting water into hydrogen and oxygen. ! 2𝐻8𝑂 → 2𝐻9+ 2𝑂𝐻: (𝐸𝑙𝑒𝑐𝑡𝑟𝑜𝑙𝑦𝑡𝑒) 2𝐻9+ 2𝑒:→ 𝐻 8 (𝐶𝑎𝑡ℎ𝑜𝑑𝑒) 2𝑂𝐻:→; 8𝑂8+ 𝐻8𝑂 + 2𝑒 : (𝐴𝑛𝑜𝑑𝑒)→ 𝐻8𝑂 → ; 8𝑂8+ 𝐻8 (𝑂𝑣𝑒𝑟𝑎𝑙𝑙) Equation 17
The production cost of hydrogen is heavily linked to the cost of electricity according to Mansilla et al. (2018).
3.2 Hydrogen utilization
There are two main ways to utilize hydrogen, either via combustion engine or via fuel cells, this is according to Gupta (2009). When using hydrogen as fuel the main by-product is water, this is also stated by Cornander et al. (2018).
3.2.1 Fuel cells
The schematics below (Figure 6) is based on descriptions of how FC is working by Gupta (2009). Hydrogen is imputed on the anode side where it is split into protons and electrons. Protons travel to the cathode side via the electrolyte while the electron travels through an electrical circuit. On the cathode side hydrogen reacts with oxygen and form water molecules. As Cornander et al. (2018) say, the by-product is water. When it comes to choosing fuel and oxygen source, Viswanathan and Aulice Scibioh (2008) claim that for achieving maximum efficiency pure hydrogen and oxygen should be used.
Figure 6 Schematic over FC reaction (Gupta, 2009)
FC can be divided into two categories, either low-temperature FC and high-temperature FC, according to Cornander et al. (2018). In these categories there are six different types where Viswanathan and Aulice Scibioh (2008) and Gupta (2009) names the following:
• Alkaline fuel cell (AFC)
• Direct methanol fuel cell (DMFC) • Molten carbonate fuel cell (MCFC) • Phosphoric acid fuel cell (PAFC)
• Proton exchange membrane fuel cell (PEMFC) • Solid oxide fuel cell (SOFC)
Table 1 is based on information presented by Gupta (2009). The numbers presented are simplification, for instance, is the operating temperature for SOFC 800-1000 °C. These numbers are confirmed by Comparison of Fuel Cell Technologies (n.d.).
Table 1 Operating conditions for different types of FC (Gupta, 2009) FC type Operating
temperature [°C] Efficiency [%] Typical power range [kW]
AFC 60-90 45-60 <20 DMFC 60-130 40 <10 MCFC 650 45-60 >1000 PAFC 200 35-40 >50 PEMFC 80 40-60 <250 SOFC 1,000 50-65 >200
Viswanathan and Aulice Scibioh (2008) say that FCs have several benefits. These are for instance no emissions of NOx or SOx, good efficiency at part-load, higher efficiencies than
combustion engines, possible to use in CHP applications and they are relatively simple. One example of the application of FC is in space shuttles where FCs are used for providing both electricity and drinking water.
Different FC has different possible applications. As mentioned previously, FC can be used in CHP systems. For CHP systems Viswanathan and Aulice Scibioh (2008) says that FC with higher operating temperatures such as PAFC, SOFC and MCFC are suitable. Cornander et al. (2018) and Gupta (2009) say that PEMFC is best suited for automotive applications.
Properties that make PEMFC more suitable for this is a high energy density, quick start-up, fast reaction to power changes and not being placement sensitive.
As different FC are suitable for different applications, each type of FC comes with its
drawbacks. Viswanathan and Aulice Scibioh (2008) express that high-temperature FC often require expensive materials and long start-ups. On the other hand, PEMFC which is a low-temperature FC contains platina and is sensitive to moisture as disadvantages according to Cornander et al. (2018). Gupta (2009) sums the overall disadvantages with FC is their cost and durability.
Cornander et al. (2018) say that 2017 was a capacity of approximately 700 MW of FC
delivered for transport applications and approximately 290 MW for stationary applications.
3.2.2 Hydrogen internal combustion engine
According to Gupta (2009) is FC is not the only way to use hydrogen as fuel. Another way is to use a hydrogen internal combustion engine (HICE). Verhelst and Wallner (2009) say that HICE is beneficial as it does not require as high purity as FC but also as ICE is possible to use in bi-fuel systems. With a bi-fuel system, it is possible to run the engine on, for instance, either hydrogen or gasoline which means that the hydrogen fuelling infrastructure does not have to be fully developed.
3.3 Hydrogen storage
Srinivasan et al. (2017) say that the largest challenge when it comes to implementing
hydrogen is how to viably store it. Similarly, Gupta (2009) claims that critical factors such as on-board vehicle storage and transportation are crucial for the success of hydrogen.
Sommerfeldt et al. (2016) say that one reason for adding an energy storage system (ESS) in buildings is to increase the self-consumption of self-produced electricity.
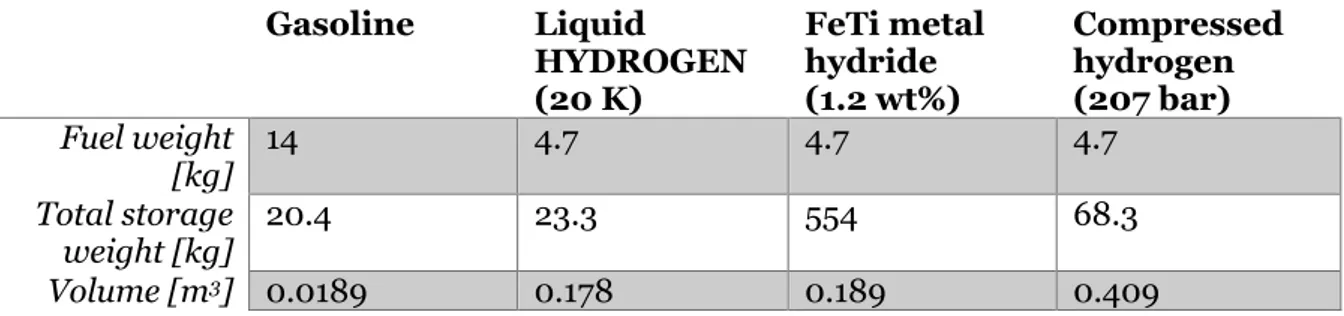
Gupta (2009) says that one of the advantages with utilizing hydrogen as an energy carrier is its high specific energy content which is 140.7 MJ/kg and it is considerably higher than for other conventional fuels. At the same time, hydrogen has a very low energy density in comparison with other fuels and the energy density is 8491 MJ/m3. This low energy density
poses is a problem when it comes to storage as a larger tank is needed to store the same amount of energy as for conventional fuel. One example of this is that at ambient conditions 1 kg of hydrogen occupies a volume of 11 m3. In Table 2 a comparison between different
storage solutions for 662 MJ (which is equal to five gallons of gasoline) is made.
Table 2 Comparison of fuel storage (Gupta, 2009)
Gasoline Liquid HYDROGEN (20 K) FeTi metal hydride (1.2 wt%) Compressed hydrogen (207 bar) Fuel weight [kg] 14 4.7 4.7 4.7 Total storage weight [kg] 20.4 23.3 554 68.3 Volume [m3] 0.0189 0.178 0.189 0.409
Desirable characteristics of a hydrogen storage are according to Shafiee et al. (2017): high hydrogen capacity, a simple process of activation, equilibrium pressure and minimum degradation. Another property that is needed is low losses as Hemme and van Berk (2018) say that hydrogen that is lost result is an energy loss.
The main possible methods of hydrogen storage, according to Cornander et al. (2018), are to store the hydrogen as a gas, liquid or solid. Gupta (2009) mentions that it is also possible to store hydrogen in other ways such as carbon materials or silica microspheres. Depending on the phase which the hydrogen is stored at enables different possible transportation methods and both Cornander et al. (2018) and Gupta (2009) mention pipelines, gas tanks and liquid tanks either as liquid hydrogen in cryogenic tanks or as other hydrogen-rich fluids such as ethanol.
Competing energy storage are batteries and according to Jiang et al. (2018) are batteries the most promising energy storage. This is due to characteristics such as high energy density and batteries not being very dependent on their geographical placement. Cornander et al. (2018) express that the trend with battery development is that they can be used with more power demanding engines, charges faster, lasts longer and is getting cheaper. Between 2008 and 2013 the price on ion batteries dropped by 75 %. Table 3 below presents properties for Li-ion batteries according to Demirocak et al. (2017) while Table 4 shows the development targets.
Table 3 Li-ions battery properties (Demirocak et al., 2017)
Specific energy [Wh/kg] 90-190 self-discharge at 25 °C [%/month] <5
Table 4 Development targets for EV Everywhere project (Demirocak et al., 2017) Parameter 2012 status 2022 target
Cost [$/kWh] 500 125
Specific energy [Wh/kg] 80-100 250
Energy density [Wh/L] 200 400
Specific Power [W/kg] 500 2,000
An issue with Li-ion batteries is that they are classified as dangerous goods, this is mentioned by Cornander et al. (2018). Another is that they contain cobalt, but they have the advantage that they do not contain heavy metals like lead, cadmium or quicksilver. Cobalt is a debated material because the majority is mined in Congo and the mining business in Congo is criticised by the organisation Amnesty International.
How the batteries are utilized affect their technical life span, this is described by Jiang et al. (2018). He gives an example where a battery is cycled at a depth of discharge at 20 % and then it can be cycled 9,000 times. If the same battery is cycled at depth of discharge of 100 % it would only last for 4,500 cycles.
3.3.1 Compressed
According to Gupta (2009) for short-term storage, the most promising technology is
compressed hydrogen storage. Disadvantages described by Viswanathan and Aulice Scibioh (2008) with this technology is the size and weight of the storage tank. This can also be seen in Table 2.
3.3.2 Liquified
Hydrogen condenses at -253 °C according to Gupta (2009) and Cornander et al. (2018) say that storing hydrogen as a liquid is a possible solution. Gupta (2009) says that the benefit of storing hydrogen as a liquid is that the tank will be smaller and not as heavy which is also shown in Table 2. Liquid hydrogen has disadvantages and both Viswanathan and Aulice Scibioh (2008) and Gupta (2009) mention that boil-off, which is where hydrogen evaporates
in the tank, and the high energy demand to condense hydrogen are two issues with storing hydrogen as a liquid.
3.3.3 Hydrides
Viswanathan and Aulice Scibioh (2008) mentions hydrides as a possible storage solution and Gupta (2009) describes hydrides as a solid material which can absorb and desorb hydrogen. There are two types of hydrides metal and organic chemical were Shafiee et al. (2017) say that the most common compositions are lanthanum nickel and magnesium hydride.
Shafiee et al. (2017) describe hydrides as a safe and efficient storage method of hydrogen. It is also said that hydrides operate at constant pressure and that they have a higher energy
density than compressed hydrogen. Gupta (2009) mentions that the size of hydride storage is similar to liquid storage, but hydrides are considerably heavier which can be seen in Table 2. Viswanathan and Aulice Scibioh (2008) describes that the absorption process in the hydrides are exothermic while the desorption process is endothermic. Gupta (2009) highlights an issue with this by the following example; If the formation enthalpy is 40 kJ/mol and the hydride absorb 5 kg of hydrogen at 3 minutes, the total heat rejection is 100 MJ and the heat is 550 kW.
3.4 Hydrogen Safety
Safety is a big part of implementing hydrogen as both Rifkin (2002) and Viswanathan and Aulice Scibioh (2008) writes that the public feels strongly and remembers accidents where hydrogen has been involved. Such accidents are for instance Hindenburg and the Challenger disaster.
Gupta (2009) sees safety issues in comparison with conventional fuels, for instance: wider flammability range, lower ignition energy, faster flame velocity and it burns hotter than methane. This is also seen by Viswanathan and Aulice Scibioh (2008) who mention the flammability range between 4 % to 75 % and the explosivity of hydrogen and air mixtures. Gupta (2009) summarizes that due to the high flammability of hydrogen, high standards will be set on the safety equipment. In Table 5 the explosive limits for gasoline, methane and hydrogen are presented and these limits show between which concentrations the fuel can be ignited.
Table 5 Explosive limits (Gupta, 2009)
Fuel Lower explosive limit [%] Upper Explosive Limit [%]
Gasoline 1.4 7.6
Methane 5 15
explains this by the example that due to its fast dispersion hydrogen is hard to ignite if it starts to leak.
Viswanathan and Aulice Scibioh (2008) states that to commercialize hydrogen, safety measures are needed.
3.5 Economy and Politics of Hydrogen
Whether hydrogen will be a success is strongly linked to the political will and economic competitiveness according to Mansilla et al. (2018). Examples of these factors are the price of fossil fuel and emissions. Gupta (2009) writes that to have a successful deployment of
hydrogen technology, government incentives will be necessary. Mansilla et al. (2018) describe that the competitiveness of hydrogen can be increased by a regulatory framework such as carbon tax.
Gupta (2009) describes that hydrogen can contribute to a more even distribution of energy resources between countries and regions. This is because RES is available all over the world and therefore the hydrogen production is not limited to a specific geographical area.
Hydrogen has probably a more promising future as a transportation application than a stationary power generating application according to Mansilla et al. (2018). This is mainly due to low electricity prices. Stationary hydrogen applications can be profitable but that is highly dependent on the local context.
Sommerfeldt et al. (2016) describe that self-consumed electricity can be valued at full retail price but overproduction which is sold to the grid can only be valued as the wholesale price. According to Demirocak et al. (2017) has the expansion in the battery market been caused by the interest in hybrid EVs and ordinary EV.
3.6 Hydrogen applications
Viswanathan and Aulice Scibioh (2008) say that one benefit of utilizing hydrogen is that it does not produce CO2 or any harmful emissions. The downside with implementing hydrogen
is that extensive changes must be made in the infrastructure and that could become very costly.
3.6.1 Energy storage and power production
Mansilla et al. (2018) says that FC could be used in several power applications, for instance, backup power generation, off-grid or microgrid applications. It is even possible to utilize fuel cells for CHP. A hydrogen system can either be placed at the production site or the end-consumer, both solutions have different benefits. At the production site, a hydrogen system benefits impact of intermittence, need of forecasts, transmissions capacity and increase the
possible share of RES in the grid. In other words, the hydrogen system is used for stabilizing the grid and balance markets. If the system is placed at the end-consumer it can instead be used to smooth out the local demand curve which in its turn reduce variations in load profile and therefore forecasting need. According to Cornander et al. (2018), there are no large-scale hydrogen-fuelled generators on the market.
One project where hydrogen is used as energy storage is the Zero sun project. The aim of the Zero Sun project is described by About Zero SunTM | ZeroSun (n.d.) as showing how solar
technology can be utilized. As the project takes place in Skellefteå (Sweden) where sunlight is scarce during the winter season, the project is also an example that it can be possible to implement on other places.
According to the web page How it works | ZeroSun (n.d.) hydrogen gas is mainly used as energy storage. In Table 6 are the component’s capacity presented, based on (Nohrstedt, 2017). Further describes How It Works | ZeroSun (n.d.) that the house is equipped with PV panels which in first-hand supply electricity to the house for direct consumption. If there is any leftover electricity it is firstly stored in batteries but if the batteries are fully charged the electricity is converted to hydrogen via an electrolyser. When the PV panels and batteries cannot supply enough electricity, hydrogen is converted into electricity via an FC. Apart from obtaining electricity from hydrogen, it can also be used in FCEV.
Table 6 Zero sun system (Nohrstedt, 2017) Component
PV 25 kW installed capacity Battery storage 100 kWh
Electrolyser 1 m3 H2/h Hydrogen storage capacity 2,000 m3
Hydrogen storage 150 steel gas tubes, 300 bars Fuel cell 3-5 kWh electricity
Residual heat storage 3 accumulator tanks á 500 L Additional heat Geothermal heat pump
3.6.2 Vehicle fuel
Cornander et al. (2018) write that hydrogen has been designated by the EU as a possible emission-free replacement for fossil fuels in the transport sector. Hydrogen has been used as fuel before, for instance in NASA's Apollo programme and ASEA submarines, but the first commercialized hydrogen-fuelled car came 2015.
Mansilla et al. (2018) explain that important factors for choosing hydrogen in the
transportation sector are factors such as the economics of owning and buying, the fuelling time and driving range. Driving range are an issue according to Gupta (2009) as the low density of hydrogen pose as a problem when it comes to storage. Cornander et al. (2018) say that FCEV has however benefits such as they can be fuelled faster than battery electrical
which makes FCEV space-saving and that they have roughly the same fuelling time as conventional vehicles.
FC can be used in different ways to electrify vehicles, for instance, says Cornander et al. (2018) that FC can be used as range extenders but then the main energy source is batteries. Whether batteries or FC are the main energy source is dependent on factors such as cost, size and weight.
Machines fall under the so-called Maskindirektivet (Swedish for Machine Directive) and have lower requirements when it comes to emissions than vehicles used for transportation have according to Cornander et al. (2018). This means that there is great potential for
improvements. If ICEs in machines was replaced with either batteries, FCs or a combination of both, the emissions from machines would be zero or close to zero which would improve both local and working environment. In Table 7 are conditions for cars and machines are compared.
Table 7 Comparison between requirements for cars and machines (Cornander et al., 2018)
Cars Machine
Low power High power Low initial cost Low total cost Mainly parked Mainly used
Normal environment Harsh environment Transportation Workplace
Charged overnight Charged over breaks
According to Rifkin (2002) is the major issue with implementing hydrogen the
infrastructure. As long as there is insufficient infrastructure the car manufactures will hesitate to produce and sell hydrogen-fuelled cars and the opposite situation applies to energy companies. Similarly says Cornander et al. (2018) that the main issues seen by machine manufactures the infrastructure regarding fuelling or charging and the energy density in the energy carrier. This applies to both FCEV and BEV.
Vätgas Sverige (n.d.) shows on their map over hydrogen fuelling stations that there are five available stations in Sweden. A hydrogen fuelling station can operate off-grid which
Cornander et al. (2018) exemplify by mentioning the PV powered fuelling station in Kjørbo (Norway). A similar fuelling station has been put up in Mariestad (Sweden) which is reported by Carlqvist (2019). This operates off-grid and gets its electricity from PV. The fuelling station is used by the home care department which has 8 hydrogen cars which are remodelled BEVs where the FC and hydrogen tank replace the battery pack.
It is also possible to produce synthetic fuels with hydrogen and Mansilla et al. (2018) mention producing methane with the process methanation step. Gupta (2009) similarly describes how coal and hydrogen can be utilized for producing other fuels, for instance, methane which is shown in Equation 18.
Cornander et al. (2018) claim that the trend regarding the electrification of machines is leaning towards batteries. This is seen as battery-powered machines are becoming a more common alternative when it comes to machines which do not require high power levels during longer periods.
According to Cornander et al. (2018), it is important to consider the total cost of ownership as a cheaper fuel is not a guaranty to a lower total cost of ownership if fuelling or charging affect the productivity of the machine.
3.6.3 Other
There are other applications for hydrogen apart for power production and vehicle fuel as Cornander et al. (2018) mentions the HYBRIT project. This is a project where hydrogen is used for separating iron and oxygen instead of coal. One of the reasons for doing this is that SSAB's steel production is one of the least emissive but is still emitting 9.8 million ton of CO2.
4 CURRENT STUDY
In this chapter are input data for the calculations presented. It also describes any data treatment made.
4.1 Buildings
Figure 7 and Figure 8 shows the scaled electricity and heat demand for the building. The original annual electricity demand is approximately 120,000 kWh and original annual heat demand 300,000 kWh. According to Normal Elförbrukning Och Elkostnad För Villa (2020) is a normal electricity consumption for a single-family house with district heating
5,000 kWh/year. The building’s consumption is scaled to have an annual consumption 5,000 kWh. In Figure 7 and Figure 8 are the scaled energy demand of the building presented.
Figure 7 Scaled electricity demand for building
Figure 8 Scaled heat demand for building 0,0 0,2 0,4 0,6 0,8 1,0 1,2 1,4 1,6 1 16 31 46 61 77 92 107 122 137 153 168 183 198 213 229 244 259 274 289 305 320 335 350 El ect rici ty de m and [k W h] Day of year 0 2 4 6 8 10 12 1 16 31 46 61 77 92 107 122 137 153 168 183 198 213 229 244 259 274 289 305 320 335 350 He at d em an d [k W h] Day of year
4.2 Agriculture
Andersson et al. (2018) write that Sweden has 70,000 agricultural companies of which 20,000 have agriculture as a full-time occupation. The agriculture sector consumes approximately 3.7 TWh each year and Figure 9 shows how these are distributed.
Figure 9 Distribution of energy consumption in agriculture (Andersson et al., 2018)
The type of farm affects which part that accounts for the main energy consumption,
according to Andersson et al. (2018). For instance, may a farm with plant cultivation as main occupation demand more energy for fuel while a farm with milk production as the main occupation may need more energy towards milk handling such as cooling and washing of equipment.
4.3 Transportation
According to Energimyndigheten (2017b) was 117.4 TWh of energy used by the
transportation sector whereof 87.2 TWh was for domestic transportation. Of fossil fuels were 30.22 TWh of gasoline and 45.03 TWh of diesel used. Transportation by road (includes cars, public transportation and cargo transportation by truck) is the main energy consumer and it accounted for 93.6 % of the energy consumption 2016. Table 8 presents the quantity of fuel used while Table 9 specifies the energy content for the different fuels.
Table 8 Fuel consumption in Sweden 2015 (Energimyndigheten, 2017b) Fuel Quantity Unit
Gasoline incl. low-blended ethanol 3,348 1,000 m3 Ethanol 274 1,000 m3 Diesel incl. low-blended diesel 4,923 1,000 m3 biodiesel 1,127 1,000 m3
Fuel; 62% Electricity; 21%
Table 9 Energy content for fuels (Energimyndigheten, 2017b) Fuel Quantity Energy content
Gasoline 1 m3 32.76 GJ Diesel 1 m3 35.28 GJ Ethanol 1 m3 21.24 GJ Natural Gas 1,000 m3 39.78 GJ Biogas 1,000 m3 34.92 GJ
For recalculating the energy demand of the transportation excluding losses an efficiency of combustion engines of 42 % has been used. According to Thomas (2015) is 42 % the best ICE efficiency, but an ordinary driving cycle has an efficiency of 10-12 %.
4.4 Industry
According to Nordling (2019) was the total energy use in industry 136 TWh during 2017 and of this accounted for electricity for 50 TWh and biofuel for 56 TWh. In order to change the industry sector into becoming fossil-free, the energy consumption will increase with at least 32 TWh electricity and 18 TWh of biofuel and bio-based raw material.
Hydrogen can be used in some industries and Nordling (2019) says that the iron and steel industry, refinery industry and chemical industry are the ones. The area of use is different for different industries, for instance, can hydrogen replace coal in iron and steel industry (this is an ongoing project called HYBRIT) but changing all of these would increase the electricity demand by approximately 15 TWh to supply the hydrogen. Other industries, for instance, the mining industry, can also utilize hydrogen as a fuel for operating machines and internal transportation.
4.5 Solar data
Solar radiation data used for calculations are retrieved from STRÅNG. It covers the direct and diffuse radiation for the city Västerås, Sweden. Data collected from STRÅNG is missing the solar radiation for 31st of December 2019 and this is handled by using the mean values
between 1st of January and 30th of December. Also, 2019 is a leap year and the 29th of
February has been excluded in order to fit radiation data to match building load profile. Figure 10 shows the radiation on PV over a year.
Figure 10 Total radiation on PV
4.6 Calculation data
The calculation is based on the following system configuration: PV, electrolyser cell (EC), storage and FC. Calculation strategy is to size a system which is able to cover the energy demand of the calculation subject, for instance, building or fossil fuel consumption in transportation.
The operational strategy for the calculated building is shown in Figure 11. In the figure, it is shown that firstly PV supply to the building and any excess is supplied to EC which produce hydrogen that charges the storage. Any deficit is covered by FC produced electricity. For transportation, industry and agriculture, there is no load connected to the hydrogen system which means that all electricity is used for producing hydrogen.
0 20 40 60 80 100 120 140 160 1 16 31 46 61 77 92 107 122 137 153 168 183 198 213 229 244 259 274 289 305 320 335 350 Tot al radi at ion on pane ls [k W /m 2] Day of year
It is only for the industry calculation which the calculation strategy is slightly different. For the industry, it is known, based on Nordling (2019), that replacing coal in the steel industry with hydrogen will increase the electrical demand by 15 TWh. Based on this, the calculation is bringing forth how much hydrogen can be produced from that with current and target
efficiencies, but also how much such a system would cost.
For the PV a mean value for specific cost, module power and efficiency are used. The mean values are based on a test done by Energimyndigheten and the results from this test is presented at Jämförelsesida (n.d.), see Table 10 for data. For calculations, a theoretical PV module with a module power of 165 W/m2, efficiency of 16 % and a specific cost of
11.34 SEK/W are used.
Table 10 Comparison monocrystalline PV panels (Jämförelsesida, n.d.)
Manufacturer JA Solar Rene-sola Solar-World SunPower Swe-Module Yingli Solar Model name
JAM6(BK)-60-260/SI JC250S-24/Bb-b Sunmodule Plus SW 250 mono black SPR-E20-327 Windon Tatu 265 Mono Panda YL270C-30b Specific cost [$/W] 1.02 1.08 1.01 1.62 0.99 1.02 Efficiency [%] 15.4 15.0 14.7 19.0 16.0 16.4 Module rated power [W] 260 250 250 327 265 270 Area [m2] 1.63 1.62 1.68 1.64 1.65 1.63
Efficiencies and specific costs for EC, storage and FC used in the calculations are based on the ones used by Schoenung (2011). The target values presented in Table 11 are from the DOE hydrogen program called Multi-year Program Plan
Table 11 Hydrogen system data (Schoenung, 2011)
EC Storage FC
Current efficiency [%] 73.5 - 55
Target efficiency [%] 75 - 58
Current cost [$/kW] or [$/kWh] 340 15 500
The system lifetime is assumed to be 20 years, which is also used in the study by Schoenung (2011). It is also assumed that it is necessary to reinvest in new EC and FC during the system lifetime, in the calculation, the component lifetime is set to 10 years based on that mean component in Table 12, which is based on IRENA (2018), has an operating time of 65 000 h which would translate to, with a constant operation, 7.4 years. From Table 12 is the
operational cost of 2 % of the investment cost taken.
Table 12 Data electrolyser system (IRENA, 2018)
Technology ALK PEM
2017 2025 2017 2025
Efficiency [%] 65 68 57 64
Lifetime electrolyser [operating h] 80,000 90,000 40,000 50,000
CAPEX [$/kW] 832 532 1,331 776
OPEX [% of initial CAPEX] 2 2 2 2
CAPEX replacement [$/kW] 377 238 466 233
Output pressure [bar] 0 15 30 60
System lifetime [years] 20
As said in chapter 3.6.1, it is possible to use hydrogen in CHP applications. For the building calculation, the recoverable heat is calculated. It is assumed that 50 % of the heat loss from the FC is recoverable.
For the economic calculations, an interest of 3 % is assumed. It is supposed to cover any interest for eventual bank loans.
The results will be reported as USD, $, while some of the calculation data is in other
currencies. For the currency conversion from SEK to USD, it assumed that 1 SEK equals $ 0.1 which is according to USA-DOLLAR - USD (n.d.). For the costs in Euro (€) it is assumed that 1 € equals to 11.09 SEK which is according to Euro till SEK - Aktuell Kurs Och Historisk
Utveckling (n.d.).
Some of the calculated results are either dependant or can be compared with the cost of alternatives, such as grid-connected electricity or fossil fuel. According to Normal
Elförbrukning Och Elkostnad För Villa (2020) is the price for electricity for a villa, including
charges and tax, 1.54 SEK/kWh. This is confirmed by Lindahl (2017) who says that within the residential sector the electricity price is 1.0-1.8 SEK/kWh. The industry pays instead 0.55-1.00 SEK/kWh. In the calculation for a building is an electricity price of 1.4 SEK/kWh used. Agriculture has been interpreted as an industry as it is a company who buys the electricity and, in the calculations, a price of 0.775 SEK/kWh is used.
Weimar (2020) reports on how fuel prices have changed over the beginning of since 2018. The maximum price for gasoline respectively diesel during this period is 17.14 SEK/l and 17.16 SEK/l, while the prices on 22nd of April 2020 were 13.53 SEK/l for diesel and
12.28 SEK/l for gasoline. For the calculation, an average between the price for gasoline and diesel has been used. A price for fossil fuels of 13.52 SEK/kWh or 12.90 SEK/L has been used.
District heating can be bought for 1.09 SEK/kWh according to Fjärrvärme - Pris Och
Kostnad (2020) and this price is used for the building calculation. For the heat demand for
agriculture, an assumption that the heat is produced by a heat pump with a COP of 3 is made.
5 RESULTS
In the following sub-chapters are results from interviews and calculations presented. Key points from the results are that today is investing in hydrogen is not a profitable and
calculations show that price development for both fossil fuels, electricity and components are necessary.
5.1 Interview
In chapter 5.1.1 and 5.1.2 are summaries from interviews with a development strategist in a municipality and technical director of a hydrogen company. Full transcriptions of the interviews are available in the appendix, but they are in Swedish.
5.1.1 Development strategist
The main sustainability project, which is a collaboration between the municipality and the trade and industry, was originally started to make up for lost jobs and make use of the
potential business in sustainable development. Within the main project, the municipality has been interested in and active in several of smaller sustainability projects fall, which the hydrogen fuelling station is one.
At present, there are two hydrogen projects in the municipality: A hydrogen fuelling station and a preschool with hydrogen storage. The preschool is only in the planning stage, but the fuelling station is in operation. It is based on PV, electrolyser and container storage. 4,000 kg of storage capacity is connected to the PV, but the establishment’s total storage capacity is 40,000 kg.
The interviewee says that hydrogen production via electrolysis is a good example of a circular economy. Electrolyser split water molecules into hydrogen and oxygen, which is an emission-free process as long as the electricity is sustainably produced. Hydrogen can be used as fuel while oxygen could be fed into, for instance, a fish farm.
The plans for a fuelling station came when the chairman of the municipal council, who believe in hydrogen, came across a spare fuelling station from a Danish project. Interviewee express that hydrogen is a part of the future. Another reason for going with hydrogen is that it is easy to store and contributes to sustainable development.
The initial investment cost for the fuelling station was slightly less than 20 million SEK, but if the same station was built today it would have cost half, which is approximately
10 million SEK. An ordinary gas station would cost 5-8 million SEK or $ 500,000-$ 800,000 to build. To build the hydrogen fuelling station, the municipality received financial aid from foundations.
The hydrogen is sold for a price of 90 SEK/kg or $ 9 /kg, where the price in Europe varies between 80-110 SEK/kg or $ 8-$ 11 /kg. With 1 kg of hydrogen, it is possible to drive an FCEV for approximately 100 km, the total driving range for an FCEV is approximately 400 km but the prognosis for the future says 600-800 km when FCEV is mass-produced. A network of hydrogen fuelling stations are spreading through Europe, the current number is 850 stations. A fuelling takes around 4 minutes.
At the moment the municipality has fourteen hydrogen-fuelled cars which they refuel at their station. The plan is to enlarge the fuel cell car fleet as leasing contracts, and such expires, because according to the municipality’s calculation fuelling station investment will start being profitable when they refuel 50-100 cars. A benefit with the use of fuel cell cars is that CO2 emissions can be removed from ecological accounting.
Moneywise the investment in the hydrogen fuelling station has not been profitable. On the other hand, it has given job opportunities and PR.
The issue with implementing hydrogen today is that it is difficult to certify the systems. Today it is the local fire department who has the responsibility for certifying the systems which pose as an issue. Therefore, there is a need for standards and national strategies in order to have a larger deployment of hydrogen outside research projects. Another issue is that some officials see hydrogen as a competing instead of a complementing technology, for instance with biogas.
With regards to security, the interviewee says that the fire department often sees a larger risk with lithium-ion batteries. Hydrogen is familiar to the fire department as it has been used in industry for 100 years.
The interviewee says that the public’s concern should be met by open communication. For instance, explaining how hydrogen works and that there is a security system around it.
5.1.2 Technical director
The interviewee’s hydrogen system consists of 25 kW of PV, 144 kWh of lead batteries, electrolyser, stele flask gas storage with a capacity of 11 m3 water volume, 5 kW FC and
15 kVA generator. Its initial cost was approximately 2.5 million SEK or $ 250,000 but today it would have cost 1.5 million SEK or $ 150,000. The most expensive part was the storage which cost 625,000 SEK or $ 62,500 at the initial investment.
Hydrogen storage is used as a seasonal storage, in other words, excess electricity is stored as hydrogen while the daily electricity comes from the batteries. Pressure in the storage is 300 bar, but higher pressure could be used which would demand more expensive components.
An overview of the operational strategy is shown in Figure 12. Electricity is produced by the PV; it goes in first-hand to the house’s electrical demand. Any excess is firstly used to charges the battery and secondly is used in the electrolyser in order to produce hydrogen. During the night the electrolyser continues to run on electricity from the battery as the battery has a daily cycling. During wintertime, the battery is charged by the fuel cell when the PV production is not enough.
Figure 12 Operational strategy off-grid house
According to the interviewee, there is very little maintenance on the system. The major maintenance is replacing some filter, for instance, air and ion filters, and replacing the FC coolant.
One problem with installing hydrogen systems is that there are almost no standards or regulations when it comes to hydrogen outside the industry. Today it is the local fire
department who approves of these systems. It introduces varying handling of approving the systems, but there are projects for creating standards.
Being off-grid ensure independency of outside power companies, but also a more secure and controllable system. When installing an off-grid system the goal is to be able to have the same standards as if the house was grid-connected. As the hydrogen system offers the opportunity to be off-grid, it can also be used for back-up power.