The Dividend Policy Issue and its Impact on
the Risk in a Stock
A study of the relationship between the dividend policy and the volatility of the stock
price on the Swedish market
Master thesis within: Corporate Finance Authors: Gusten Gustafsson
Anton Sandgren
Tutor: Andreas Stephan
Co-tutor: Pingjing Bo
i
Acknowledgements
The authors of this study want to extend their thanks to all people that have been involved in the process of writing this report. The support and encouragement that have been received during the process have been outstanding.
We want to thank our supervisor Andreas Stephan for the supervision and input throughout the writing of this thesis. A big thank you also goes out to Kristofer Månsson that provided aid and guidance for the statistical parts of the study.
Finally, yet importantly, we also want to show our gratitude to our colleagues in the seminar group. The feedback and ideas during the writing has helped us to improve this thesis.
________________________ ___ ____________________________ Gusten Gustafsson Anton Sandgren
ii
Master’s thesis within Finance
Title: Dividend policy’s impact on risk
Authors: Gusten Gustafsson & Anton Sandgren
Tutor: Andreas Stephan
Co-tutor: Pingjing Bo
Date: May 2016
Keywords: Dividend policy, Stock price volatility, OMXSPI
Abstract
The question of paying out a dividend or not, is an issue all companies have to consider. The dividend policy in a company does not only affect the company itself, but also the shareholders. Several aspects have to be considered by the managers when suggesting if to pay out a dividend, and how large the amount should be. What if this decision could be simplified if it is proven that the size of the dividend affects the stock price volatility? This study intends to examine the relationship between the dividend policy of a company and the volatility of the stock price. Volatility is often seen as a measurement of risk, and if the relationship exist this suggests that the managers that decide over the dividend policy can reduce level of risk in the stock price by altering the dividend policy.
The study will be conducted on the Swedish stock market, including all companies that pay out a dividend. The study period stretches from year 2000 to 2015. Different variables will be used in a regression to be able to determine the relationship between dividend policy and stock price volatility.
The findings of this study suggest that if a company increases its dividend policy, increase the dividend and/or increase the payout ratio, the less volatile the stock price will be. This suggest that managers can reduce the risk of the stock by altering the dividend policy.
iii
Table of Contents
Acknowledgements ... i
Abstract ... ii
1
Introduction ... 1
Background ... 1 Problem Discussion ... 3 Purpose ... 5 Delimitations ... 62
Theoretical Framework ... 7
Theories of Dividend ... 7 2.1.1 Dividend Policy ... 72.1.2 Dividend Irrelevance Theory ... 8
2.1.3 Relevance of Dividend Policy ... 8
Risk and Dividend ... 11
Market Efficiency Hypothesis ... 13
Literature Review ... 14
3
Method ... 18
Methodological Approach ... 18 Research Strategy ... 18 Data Collection ... 19 3.3.1 Gathering of Data ... 193.3.2 Study Period and Sample Size ... 20
3.3.3 Trustworthiness of the Data ... 20
Research Method ... 21
3.4.1 Regression Model ... 22
3.4.2 Control Variables ... 23
3.4.3 Definition of the Dependent and Independent Variables ... 24
3.4.4 Expected Results and Hypothesis ... 26
iv
4
Empirical Results ... 29
Descriptive Statistics ... 29
Correlation ... 30
Regression with P-VOL, D-Yield and P-OUT ... 32
Regression with Control Variables ... 33
Regression with D-YIELD excluded ... 35
Regression with P-OUT excluded ... 36
Graphs ... 37
5
Analysis ... 42
Correlation and Multicollinearity Issues ... 42
Regression Outputs ... 43
5.2.1 Regression with only D-Yield and P-OUT ... 43
5.2.2 Regressions with Control Variables ... 44
5.2.3 Regressions with D-YIELD and P-OUT excluded ... 46
Theoretical Implications of the Empirical Results ... 47
6
Conclusion ... 51
7
Discussion and Suggestion for Further Studies ... 53
8
Bibliography ... 55
9
Appendices ... 59
Regression outputs ... 59
Data output for the graphs ... 61
v
T
ABLETABLE 1–THE RESULTS FROM THE PREVIOUS RESEARCH ... 17
TABLE 2-DESCRIPTIVE STATISTICS ... 29
TABLE 3–AVERAGE CORRELATION COEFFICIENTS ... 30
TABLE 4–THE CORRELATION COEFFICIENT BETWEEN DIVIDEND YIELD AND PAYOUT RATIO ... 30
TABLE 5–MINIMUM CORRELATION COEFFICIENTS ... 31
TABLE 6–MAXIMUM CORRELATION COEFFICIENTS ... 31
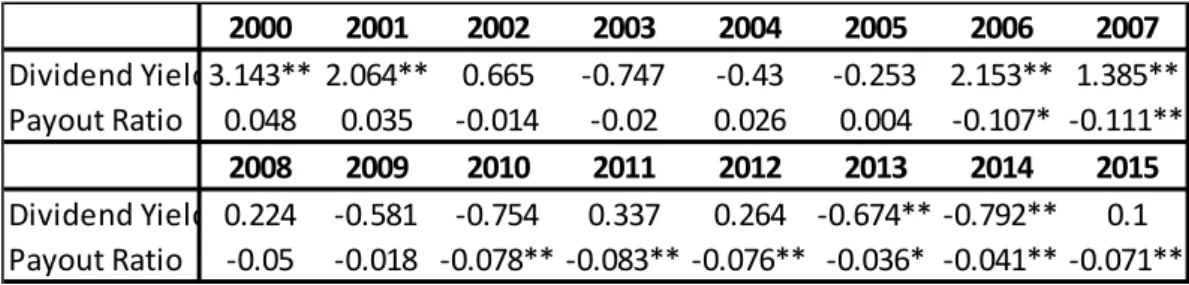
TABLE 7–REGRESSION OUTPUT WITH ONLY DIVIDEND YIELD AND PAYOUT RATIO INCLUDED ... 32
TABLE 8–THE AVERAGE COEFFICIENTS OF THE SIGNIFICANT VALUES (DIVIDEND YIELD AND PAYOUT RATIO) ... 32
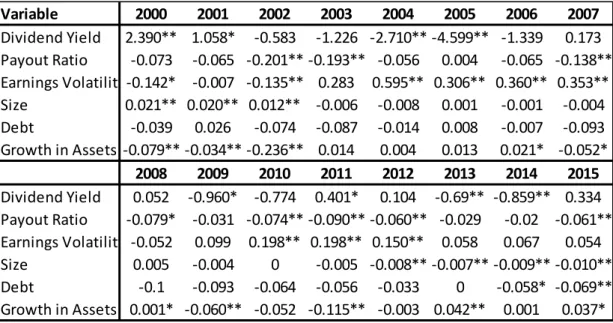
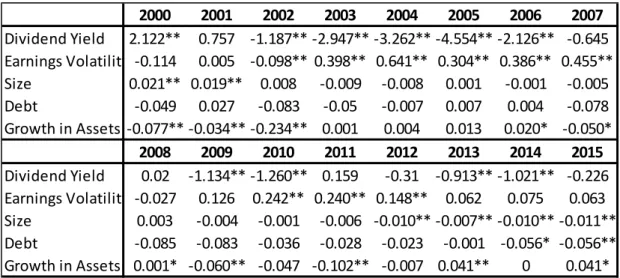
TABLE 9-REGRESSION OUTPUT WITH ALL VARIABLES INCLUDED... 33
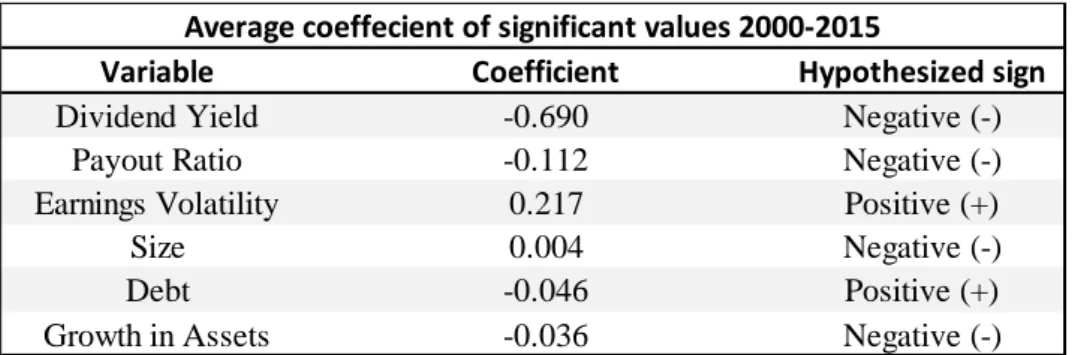
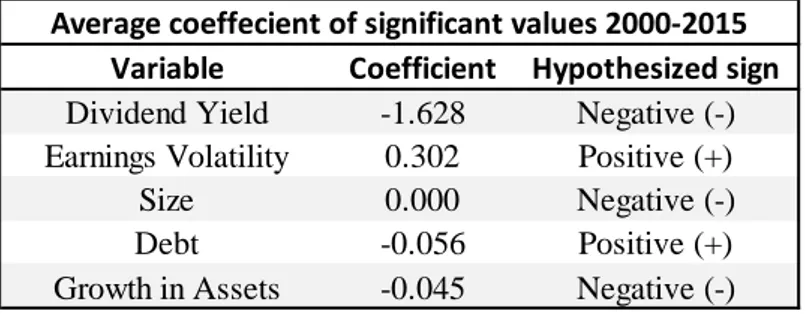
TABLE 10–THE AVERAGE COEFFICIENTS OF SIGNIFICANT VALUES (ALL VARIABLES) ... 34
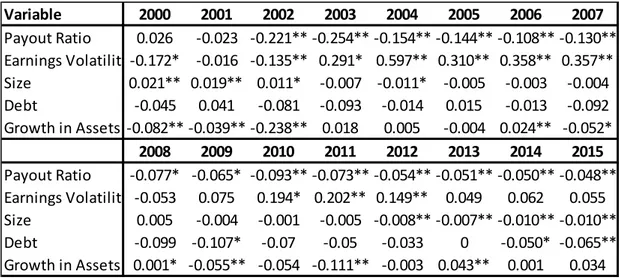
TABLE 11–REGRESSION OUTPUT WITH DIVIDEND YIELD EXCLUDED ... 35
TABLE 12-THE AVERAGE COEFFICIENTS OF THE SIGNIFICANT VALUES WITH DIVIDEND YIELD EXCLUDED ... 35
TABLE 13–REGRESSION OUTPUT WITH PAYOUT RATIO EXCLUDED ... 36
TABLE 14-THE AVERAGE COEFFICIENTS OF THE SIGNIFICANT VALUES WITH PAYOUT RATIO EXCLUDED ... 37
TABLE 15-HYPOTHESIS AND THE COEFFICIENTS FROM REGRESSION WITH ALL VARIABLES ... 44
G
RAPHSGRAPH 1–DIVIDEND YIELD 37
GRAPH 2–PAYOUT RATIO 38
GRAPH 3–EARNINGS VOLATILITY 39
GRAPH 4-SIZE 39
GRAPH 5-DEBT 40
1
1 Introduction
This chapter introduces concepts and issues of the dividend and presents the Swedish market and the stock exchange. The problem discussion and the purpose section describe and define the intention of this study.
Background
The dividend is and has always been an important tool for companies, being it is the return the investor receives for investing in the company. Shareholders want a return from their investment and for the company to appease them the board decide how much that should be paid out to the shareholders, and how much that should be retained within the company from the current or retained earnings (Kania & Bacon, 2005). Dividend policy refers to the payout pattern of dividends to shareholder over a period of time (Baker & Weigand, 2015). Therefore, the dividend policy has been, and still are very important for companies today. Dividend policy and the theory of dividend is a widely researched area. There are many different aspects within the subject, and for every aspect, there are different opinions. The dividend policy issue is a problem many researchers have tried to solve; therefore, it is no wonder that there are several different opinions within the subject (Bhattacharyya, 2007). The principal question regarding dividend policy concerns the matter of paying or not paying out a dividend (Håkansson, 1981). Before that question can be answered, other implications of the problem have to be considered. The tax preference of the investor and the tax situation in the specific market have to be kept in mind. Retaining the money in the company to be able to invest them in future projects could be a reason not to pay out a dividend. A famous paper investigating the dividend is Black’s (1976) “The Dividend Puzzle”, where he states: “The harder we look at the dividend picture, the more it seems like a puzzle, with pieces that just don’t fit together” (Black, 1976, p.8). He concludes that the issue is not an easy problem to solve and that everybody look at it in different ways. For some, the tax problematizing could be the most important question, and for others the opportunity to invest the dividend in other assets is more relevant. The opinion is highly individual and therefore it is difficult to find a correct answer.
2
Beside the dividend issue, companies today face another challenge that has become more substantial over the years, globalization. Companies today tend to be more active in several countries, some are multinational and some are global. This has made the markets more dependent of each other. The financial links between countries today have become much stronger which also contributed to the rapid downfall of economies throughout the world in the recent financial crisis. When the mortgage market in the U.S. started to collapse and Lehman Brothers filed for bankruptcy it did not just affect the U.S. market but the world economy (Profilet & Bacon, 2013). The financial crisis in 2008 also had a great impact on the Swedish stock market. Today, over 40% of the Swedish market is directly or indirectly connected to export which makes Sweden very sensitive to the surrounding world. The industrial companies in the country suffered great losses because of the declining export, which caused the small firms that are subcontractors to face problems too. Because of the uncertain macroeconomic perspective, the stock market in Sweden faced high volatility (Öberg, 2009). This caused investors to look for investments and securities exposed to less risk. A trend that began was that funds started to flow into companies that have a high dividend yield. The inflow of cash in these stocks contributed to stability. The motive with such a trend was that investors reasoned that if the market collapsed again they would at least receive a dividend (Kania & Bacon, 2005).
Volatility is the rate of change in the price for a security over a period of time that is specified. The greater the volatility, the greater the risk of a loss or a gain. If a stock is considered volatile, it is more difficult to predict what the firm’s future price will be; therefore, the stock is deemed riskier (Profilet & Bacon, 2013).The volatility in the Swedish stock market has been moderately stable during the last 20 years with some anomalies. Amid times of uncertainty, in both the Swedish market and in the macro
perspective, the volatility increases rapidly. On the other hand, in times of tranquility in the markets, the fluctuations are very small (Riksbanken, 2014). In 1863, Stockholm securities exchange were founded, and today it is owned and operated by NASDAQ. NASDAQ OMX Stockholm is a market for all types of securities but the most important market is the equity market. The stock exchange is divided in to three segments, large, mid and small cap. Companies with a market value over 1 billion euroare listed in the large cap,
3
the companies that has a market value below 150 million euroare listed in the small cap. Those three segments are referred to as the OMXSPI. In addition, there are other markets such as Aktietorget and First North, but those markets are very small and contain a special niche of companies (NASDAQ, 2016).
For all companies listed on OMXSPI, the dividend issue is a question that have to be considered and treated. Depending on what phase the company is in its life cycle, different aspects have to be contemplated. In addition, the current macroeconomic state has to be kept in mind, in good times yielding money to the shareholders could be more appeasing while retaining them could be a safer option in tougher times. There are many issues and aspects of the dividend policy that have to be considered before taking a decision.
Problem Discussion
According to financial theory, the aim for the management is to generate value for the shareholders and maximize their wealth (Jensen, 2001). Despite empirical research and comprehensive theorizing in the subject, researchers debate on how big of a part dividend policy plays in achieving this purpose (Baker & Weigand, 2015). Several aspects of the dividend have to be considered by the company when conferring on the issue. To begin with, the firm has to decide if they are going to payout a dividend at all. The firm’s current situation regarding its life cycle, current state of the company, future strategies, tax issues etcetera, plays a major role in the decision. Furthermore, there is also the shareholder’s interest to consider. One important field of application for the dividend is to use it to attract investors and pay some interest on their investment, to secure a part of their investment in the firm. Linter’s study (1956) establishes that managers perceived that the stockholders were eligible to a part of the firm’s earnings through dividends. To please the shareholders is an important part of the decision.
Beside from the company’s and the shareholders’ view of the dividend issue there is also the market aspect. The market perceives and react to news concerning the dividend and this could affect the company, both for good and bad (Kania & Bacon, 2005). Another aspect from the market perspective is the use of the dividend when analysts valuate the
4
company. The dividend becomes a tool and an opportunity for the firm to present and distribute information. Thus, using it is a convenient occasion to take advantage of.
Once the decision has been made to start paying out a dividend and the company has made their first payment, it is difficult to go back to not paying a dividend. A slight increase or the same dividend as the year before has been conventional way to address the dividend distribution. To lower or even withhold the payment is considered to be a sign of weakness and is a signal that the company could be facing trouble. In their studies, Lintner (1956) and Baker and Powell (1999) conclude that it is important for managers not to lower the dividend because of those implications.
Dividend policy can be interpreted in many different ways. To be able to measure it, it can be divided into two separate terms. To start with, there is the dividend yield. The dividend yield is the financial ratio that indicates how much the company pays out in dividends relative to its share price. It is presented as a percentage. This is the amount, or percentage, that the investor receives as a return from the investment. The second part of the dividend policy is the payout ratio of the company. The payout ratio is the proportion of earnings paid out as a dividend to the shareholders. It is presented as a percentage. It is calculated by taking the dividend per share divided by the earnings per share.
The dividend yield and the payout ratio together represent the dividend policy of a company. The managers of the firm determine dividend policy for the company. If, and how much of a dividend that should be paid out to the shareholder is determined by the policy. For the shareholder, the dividend is a return on their investment. An investment is always associated with risk, apart from securities such as a treasury bonds that are
considered riskless. Risk can be measured in different ways, but a common method is to use the standard deviation, the volatility of the stock price.
With this in mind, is there a way for the managers to lower the volatility of the stock price, by altering the dividend policy? Earlier studies (Baskin, 1989; Allen & Rachim, 1996; Hashemijoo, Ardekani, & Younesi, 2012; Ramadan, 2013) have been able to find a significant negative relationship between the volatility of the stock price and the dividend policy of a company. By increasing the dividend payout, the less volatile the stock price
5
becomes. This implies that the managers can lower the risk of the stock by applying a specific type of dividend policy. Earlier studies have been conducted in different markets across the world with similar results, but in the Scandinavian area, no extensive research has been performed. Performing a similar study in the Swedish market can fill the gap of this area. By conducting this study, the authors investigate and answer the following questions:
Are the independent variables correlated and does that affect the result?
Will our results from the Swedish market differ or look the same as the results from previous research conducted in other markets?
What is the relationship between dividend policy and the volatility of the stock price on the OMXSPI?
Can managers affect the stock price volatility by altering the dividend policy?
Purpose
In this study, the authors want to examine the relationship between the dividend policy of a firm and the volatility of the stock price. Similar studies have been conducted in different markets in different parts of the world. The findings are relatively consistent, a significant negative relationship exist between the dividend policy and the stock price volatility. The implication of the findings suggest that by altering the dividend policy the managers of the firm can affect the volatility of the stock price. Volatility is often seen as a measurement of risk and this suggests that the managers can lower the risk of the stock.
This study will investigate if this phenomenon also exists in the Swedish stock market. This will help to improve and facilitate the dividend issue many companies face today. Furthermore, in excess of the dividend yield and the payout ratio, other variables will be interpreted and utilized to validate the findings. A correlation test will be performed to see the interaction between the independent variables.Including several control variables diminishes the risk of acquiring results where causality affects the outcome.
6
Delimitations
The purpose of the study is to investigate if dividend policy affects the stock price volatility in Sweden; therefore no other markets will be included in the study. However, other studies’ results that have been conducted in other countries will be used to compare and analyze against. Only stocks listed on the OMXSPI will be included, no other markets in Sweden. To fit the purpose of the study, only stocks that pay out a dividend will be included in the sample. Since preferred stocks do not have voting rights and they have an appointed dividend, they will be excluded from the study. In addition, companies that only distribute special dividends that are paid out irregularly will be excluded since special dividends is not characterized the same as regularly paid out dividends.
There will be no exclusions related to type of company or the industry where the company operates. Neither will the size of the company affect the presence in the sample. As long as the company is listed on small-, mid or large-cap they will be included. Due to
inconclusive data, the study period will be limited to 2000-2015. The data before year 2000 are missing values for most of the variables, which makes it unsuitable for the study.
7
2 Theoretical Framework
This chapter will introduce theories about dividend policy, risk, and market efficiency hypothesis in order to help the reader understand the empirical results and the analysis.
Theories of Dividend
2.1.1 Dividend Policy
The dividend policy is highly individual for every firm, depending on the growth
opportunities and capital requirements for the company. Depending on what situation the company faces, the mangers of the firm have to find the optimal payout ratio for their business and work for the investors’ best interest. Kania and Bacon (2005) separate dividend policy into four different strategies; these are the pure residual dividend policy, the smoothed residual dividend policy, the constant dividend residual policy, and the small quarterly dividend with annual bonus.
The pure residual dividend policy is a strategy where the firm sets it budget for investment opportunities and other capital requirements, then they determine the optimal capital structure and lastly the remaining earnings will be paid out as a dividend to the investors (Droms & Wright, 2010). This strategy will give a different dividend from year to year and it is not sure the company will generate any dividends after proceeding these steps (Kania & Bacon, 2005). The smoothed residual dividend policy strategy is simply to ignore temporary changes in earnings, only the long-term changes are important when changing the dividend. The main goal of this strategy is to have a low as possible fluctuating dividend between the years, but with an increasing dividend per share over time (Shapiro, 1990). The constant payout residual dividend policy states that the company should maintain a specific payout ratio so that the dividend fluctuates with the earnings of the company (Kania & Bacon, 2005). The last strategy is the quarterly dividend strategy where the company delivers a quarterly dividend and possibly an extra bonus at the end of the year. The managers in a company that has fluctuating earnings and investments, benefits by a strategy of this sort since they have some flexibility within the cash management.
8
2.1.2 Dividend Irrelevance Theory
Modigliani and Miller (1961) claim in their irrelevance theory that the dividend should be irrelevant for investors. They argue that the dividend should not have any effect on the share price, except that the share price should decrease with the same amount as the dividend. The investor’s wealth should not be affected because of the choice of which dividend policy the company uses. The general idea of the theory states that this is true in a world with no transaction costs or any taxation on capital gain or dividend. The theory also assume that all earnings is paid out and that the management always acts in the investor’s best interest. A perfect market has free information and where no seller or buyer can affect the price by themselves (Modigliani & Miller, 1961). Håkansson (1982) also supports this view where he reports that the dividend should be irrelevant to a firm’s value when the market is efficient and the investors have the same homogeneous beliefs and time additive utilities. Miller and Scholes (1978) state that a dividend should either be irrelevant or that capital gain should be better for the investor since the tax were higher on dividends than on capital gain.
Shapiro (1990) argues that this theory will only hold if the investment strategy is
independent of the firm’s dividend policy. This means that if the firm’s investment strategy is influenced by whether they do or do not pay out a dividend, the theory will not hold. That would be the case when the investments strongly influence the firm’s future cash flows.
2.1.3 Relevance of Dividend Policy
Baker and Powell (1999) argue in their study that managers believe that paying out a dividend is an effective tool to maximize the value to the investors and that the best
dividend policy should be a balance between the dividend payout and future growth. These findings are also consistent with the findings of Lintner (1956). He states that dividends are an important factor of the firm value. Gordon (1962) uses the dividend in his valuation method for corporations, which means that the dividend has a vital role, in his point of view.
9
Although investors may be in theory mathematically indifferent to dividend policy, empirically, dividends themselves have proven very relevant in the eyes of investors for behavioral reasons (Shapiro, 1990). There are no perfect capital markets and they are not frictionless. Therefore, the dividend policy can affect the investors through market imperfections and behavioral considerations. These market imperfections are the bird-in-hand theory, the signaling effect, the agency theory and the clientele effect (Baker & Weigand, 2015).They describe four different and relevant aspects of why dividend policy is important for the investors and the dilemma the managers faces in a firm when to choose dividend strategy.
2.1.3.1 Bird-in-Hand Theory
The Bird-in-Hand Theory is a theory presented by Lintner (1962) and later supported and named by Bhattacharyya (1979). The general idea of the theory is that investors would rather receive a dividend today then wait for the capital gain tomorrow. The strongest argument for this is the level of uncertainty in an investment; therefore, investors wants to secure some of the invested money (Hussainey, Mgbame, & Chijoke-Mgbame, 2011). Even more, Gordon (1962) state that investors wants to receive a dividend rather than wait for a capital gain, even if the internal rate of return is the same. This is because there is a risk with waiting for capital gains and that risk exist even in perfect capital markets, according to Lintner (1956).
Bhattacharyya (1979) has the idea that outside investors has imperfect information about the expected earnings of a firm. Therefore, the uncertainty makes the investor to prefer a secure dividend before a capital gain. The theory has received quite a lot of criticism and there has not been any supportive research about this, even though some academically prominent people support the theory (Hussainey et al. 2011).
2.1.3.2 Agency Cost
The Agency cost theory argues that managers do not always work in the shareholders’best interest, namely that they are more interested in their own gain. For example, when the management team decide to payout a smaller amount and instead use the retained earnings to overinvest and spend it on perquisites for the management team (Al-Malkawi, 2007).
10
This theory contradicts to the irrelevance theory by Modigliani and Miller (1961), where they assume that the management always work in the shareholders’best interest.
Jensen and Meckling (1976) argue that the agency cost arises when delegating the decision making to agents, from the owners. They say that this cost will be higher if both the owner and the agent/manager are utility maximizers, since managers will not act in the
shareholders’ best interest. The insider is better off if they do not have a high payout ratio since there will be more retained earnings that could be spent on self-interest (Jensen & Meckling, 1976).
2.1.3.3 Signaling Hypothesis
The dividend signaling hypothesis states that if managers suggest anincreased dividend in a firm, the managersbelieve that the outlook ofthe company is positive, and this could imply that the firm can maintain a high dividend in the future. This implies that when a firm increases its dividend and is able to maintain it, it is a positive signal to the investors and an incentive to buy the stock. The managers indicate that the company is doing well. Studies have shown that firms which increased their dividend with 10% or more saw their stock price increase by 1.34%. In contrast, it was the opposite for firms that lowered their dividend, their stock prices decreased by 3.71% (Berk & DeMarzo, 2014).
The studies by Lintner (1956) and Baker and Powell (1999), state that managers believe that changes in dividend should be triggered by permanent changes in profits, rather than temporarily. Baker and Weigand (2015) also argue that the managers choose the dividend payout policy based on private information about the company’s future profits. They state that insiders get this incentive when the current market value is lower than the intrinsic value.
2.1.3.4 Clientele Effects of Dividends Theories
Modigliani and Miller (1961) argue that investors prefer stocks in cases where the
company fulfilla specific need. This is because investors face different tax treatments but also transactions costs in different markets. Investors in the high tax brackets will tend to prefer stocks with no or a low dividend. Berk and DeMarzo (2014) state that in a market
11
where individual investors held 54% of market value but only received 35% of the dividends.
There are two different types of clientele effect, taxation and transaction costs. These effects are different for all investors, depending on the size of your portfolio, what type of investor you are, and where the securities are traded (Hussainey et al. 2011).
The tax-preference theory states that firms with low payout ratios increases the value of the stock. This is because the required rate of return gets lower, since high payout stocks has a negative tax implication against capital gain. (Al-Malkawi, 2007) However, this is not the case in Sweden since the taxation level is the same for both capital gains and dividends (Skatteverket, 2016).
Risk and Dividend
There are two types of risks associated with investing in assets; these are the systemic risk and the unsystematic risk, which are undiversifiable and diversifiable respectively. The risk of owning a specific asset is the unsystematic risk, in the case of stock, the firms-specific risk. The systematic risk is the risk of the market and this risk affect all stocks on the market. When investing in several stocks in a portfolio, the unsystematic risk is diversifiable, as the specific risk do not affect the whole portfolio as much (Berk & DeMarzo, 2014). Since investors are risk averse, the volatility of a stock in their portfolio is important, because it is a measure of exposed risk (Hussainey et al. 2011).
The dividend policy affects a stock in several ways; most research illustrates how the dividend affect the return of the stock, but the risk of the stock is also an important issue. The most common risk measurements are variance and standard deviation, which is the volatility of a stock (Berk & DeMarzo, 2014). Ben-Zion and Shalit (1975) conducted a research on the 1000 largest American industrial companies, where they showed a negative relationship between the dividend yield and the companies risk, meaning that a lower risk is related to a high dividend and the other way around. They also reported that risk is positively related to leverage and has a negative relation with size of the firm. The positive relation with leverage means that companies with high leverage have a greater risk than companies with lower leverage. Firm size has a negative relation to the risk of the firm,
12
which indicates that larger firms usually have a higher level of diversification than smaller firms do (Ben-Zion & Shalit, 1975).
There are four theoretical mechanisms that could explain the relationship between dividend yield and the stock price volatility, but also the relationship between payout ratio and stock price volatility. These four mechanisms are:
Duration Effect Rate of Return Effect Arbitrage Realization Effect Informational Effect
The first two represent the mechanisms of the cash flows and the latter two imply that managers could affect the volatility of a stock and by that lower the risk of the company (Baskin, 1989).
Duration is a common expression for demonstrating the sensitivity of a bond to changes in the interest rate. However, the duration can be used when looking into how sensitive stocks are to changes in the equity discount rate (Berk & DeMarzo, 2014).
Firms with high dividend yield and a stable payout policy will have a shorter duration. Short-term debt is not as volatile as long-term debt in the case of changes in the interest rate. Similarly, the price of high yielding firms will not fluctuate as much as low-yielding firms does when the discount rate changes (Baskin, 1989). Baskin's (1989) research shows that this is true with all other factors equal. The Gordon growth model (Gordon, 1962) have been used to illustrate this. However, the model assumes that there is a constant growth in dividend, so the effect could be more general than this (Allen & Rachim, 1996). According to Baskin (1989), firms with low dividend yield will be valued more for the future earnings than the assets in the firm. Gordon (1962) argues that the firm with low dividend will be more sensitive to changes in rate of return estimates. When estimates about the rate of return are less reliable, the volatility of the stock in firms with low dividend will be higher. This effect could be partly of systematic risk (Baskin, 1989).
13
Allen and Rachim (1996) argues that both dividend yield and the payout ratio has an important role in showing the growth opportunities of the company, this because of the cost of capital can be high. They state that it is rational by firms with large investment requirements to have low dividend payout and retain the earnings for investments.
The arbitrage realization effect is a theory that assumes that the financial markets could be materially inefficient. The hypothesis states that stocks that are undervalued can stay undervalued for a long time since forces of equilibrium can be slow. For example, an investor should not buy a stock that is worth more if the undervaluation will remain under the holding period. A firm that pays no dividend and where the undervaluation will not disappear has no chance of delivering any excess return (Baskin, 1989).
Baskin’s (1989) information effect share the same idea as the signaling effect, which is that the dividend policy can give a signal to the investors how the firm is doing and how
insiders think about the firm’s future. Investors can have more reason to believe that the earnings are permanent if they are followed by a raise of the dividend payout (Baskin, 1989). The information effect could also be negative for the firm’s stock; if a firm starts to pay out a dividend it could be a signal that the firm does not have the same investment opportunities as before (Berk & DeMarzo, 2014).
Market Efficiency Hypothesis
The Market Efficiency hypothesis states that financial markets are efficient if prices of the assets reflect all available information, and that there is no information asymmetry between investors. Fama (1970) developed the theory and it has three different forms, weak, semi-strong, and strong. In the weak form, the securities are priced by all historical prices and returns. In the semi-strong form, the prices are based on public information and prices corrects immediately. The last form, strong, represent the market when even insider information will not gather any excess return to the investor, because all information plus the insider information is publicly available (Fama, 1970). The theory of a perfect market is also important for other theories like the irrelevance theory by Modigliani and Miller (1961), since the assumption is that there should be no taxes and transaction costs as well as all information should be publicly available. Berk and DeMarzo (2014) interpret the
14
theory as when new information gets available the investors with the information will intervene in the stock, which will change the price immediately because of the competition between investors. The accuracy of the theory depends on the number of investors that has the information (Berk & DeMarzo, 2014).
The arbitrage realization effect contradicts to the market efficient hypothesis since it states that the forces of equilibrium could be slow or even non-existent (Baskin, 1989). The market efficiency hypothesis depends on the numbers of investors that trade the asset and how aggressive the competition is, this makes markets with low activity and bad
information flow less efficient (Berk & DeMarzo, 2014).
Literature Review
The phenomenon this study investigates has been researched in other studies in both different countries and in different markets. Large developed markets in big countries like the U.S and the U.K, as well as smaller emerging and developing markets like the Dhaka stock exchange in Bangladesh and the Amman stock exchange in Jordan, are subject to studies. The studies that have been conducted use similar approaches but some alterations exist. The most common variations are the number and type of variables used in the regression model, and what characteristics the sample have. Some studies like Hashemijoo et al. (2012) and Ramadan’s (2013) focus on a certain sector within the market, in this case consumer product companies and the industrial sector respectively.
Beside which sector within a market that is being used, the study period and the size of the sample differs across the studies. Except for Baskin’s (1989) and Allen and Rachim’s (1996) studies the other use data from somewhere in between late 1990’s up to the year of 2013. The number of firms used in the sample are determined by in what kind of market the study is conducted. The emerging markets are smaller and the developed markets are usually bigger, therefore the selection in each market can differ a great deal. In his study, Baskin (1989) uses a vast sample of 2344. No other study comes even close to a sample that comprehensive. In the same market (the U.S), Profilet and Bacon (2013) also conducted a study but with a sample size of 599 firms. In the studies with emerging markets, the sample size most commonly has a range of 80-130 companies.
15
There are two studies in the research area that most other studies use as their benchmark, both when it comes to how to execute the study and to compare their results with. The first one is the study made by Baskin (1989) and he is the first one to conduct this kind of study. Using the stock price volatility as the dependent variable and dividend yield and payout ratio as the independent variables in a regression model, Baskin (1989) finds that there is a negative relationship between the dividend policy and the volatility of the stock price. To make the test more credible he introduces other variables to include in the regression model to eliminate the threat of correlation problems between the dividend yield and payout ratio to affect the result. The variables included are earnings volatility, market size, debt, and growth in assets. A test including these variables were performed with the same result. Baskin’s (1989) way of performing his study became the standard way of
conducting this type of study. Most studies that have been performed since uses the same variables and regression model.
The second study of importance is Allen and Rachim’s (1996). They perform their study in the Australian market with 173 companies listed on the stock exchange. The interesting aspect of this study is that the results contradict Baskin’s (1989) findings. Allen and Rachim (1996) found a positive relationship between dividend yield and the stock price volatility but a negative significant relationship between the payout ratio and the volatility of the stock price. The results do not fully support Baskin’s (1989) theory that dividend policy can influence stock price, because it is not clear where the causality resides (Allen & Rachim, 1996).
The studies by Baskin (1989) and Allen and Rachim (1996) set the standard for this type of study. Almost all research later on uses the same method and variables in their regressions. Furthermore, the findings of the studies are also compared with Baskin’s (1989) and Allen and Rachim’s (1996). Except from Allen and Rachim’s (1996) study, most other research have reached the same conclusion as Baskin (1989), that the dividend policy affects the volatility of the stock price. There is diverseness between the studies regarding the results of every variable, but the conclusion remains the same.
The variables that representsthe dividend policy in the regression model are the dividend yield and the payout ratio of the company. In addition, a set of control variables are
16
introduced and included in the regression. The results from other studies regressions are displayed in Table 1.The studies conducted by Hussainey et al. (2011); Hashemijoo et al. (2012); Profilet and Bacon (2013) and Ramadan (2013) get a significant negative
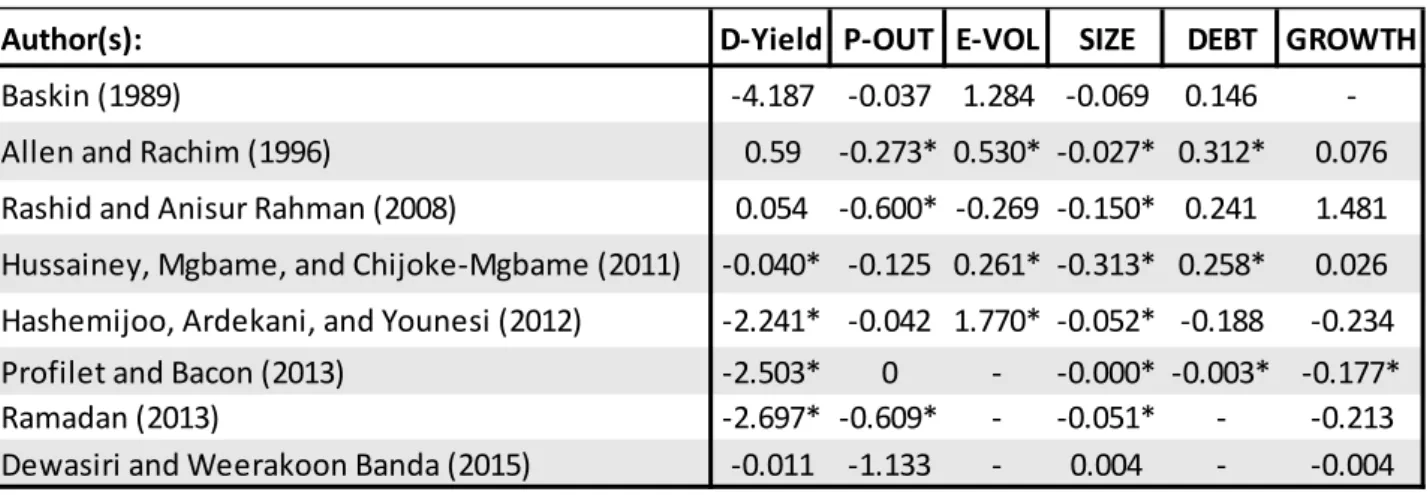
relationship between the dividend yield and the stock price volatility. The same significant negative relationship is found with the payout ratio in the studies by Allen and Rachim (1996); Rashid and Anisur Rahman (2008) and Ramadan (2013). In contrast, the earnings volatility variable is positively significant in the studies by Allen and Rachim (1996); Hussainey et al. (2011) and Hashemijoo et al. (2012). The variable that gets most stable results in nearly all of the studies is size. It has a significant negative relationship with the dependent variable in all the studies listed in Table 1 except for the one by Dewasiri and Weerakoon Banda (2015). The debt variable has more varying results. Two studies, Allen and Rachim (1996) and Hussainey et al. (2011), get a positive significant relationship, while Profilet and Bacon (2013) get a significant negative one. Regarding the growth variable, some studies did not include it in the initial test, but instead used it in different variations of the regression. It is only Profilet and Bacon (2013) that get a significant result from the variable, which raise the question if the variable should be included in the initial regression, or just in a variation of the formula.
An interesting aspect of the research is that most studies are published recently which make their findings up to date. The relevance of the findings also becomes up to date when using data that has been collected recently. Moreover, another interesting aspect of the research that has been conducted is the geographical spread of it. The European market, (Hussainey et al. 2011), the U.S market (Baskin, 1989; Profilet & Bacon, 2013) and the Asian market (Rashid & Anisur Rahman, 2008; Hashemijoo et al. 2012) are represented. Getting similar results between such diverse markets indicate that the results are evident.
17 Table 1 – The results from the previous research
Author(s): D-Yield P-OUT E-VOL SIZE DEBT GROWTH
Baskin (1989) -4.187 -0.037 1.284 -0.069 0.146
-Allen and Rachim (1996) 0.59 -0.273* 0.530* -0.027* 0.312* 0.076
Rashid and Anisur Rahman (2008) 0.054 -0.600* -0.269 -0.150* 0.241 1.481
Hussainey, Mgbame, and Chijoke-Mgbame (2011) -0.040* -0.125 0.261* -0.313* 0.258* 0.026
Hashemijoo, Ardekani, and Younesi (2012) -2.241* -0.042 1.770* -0.052* -0.188 -0.234
Profilet and Bacon (2013) -2.503* 0 - -0.000* -0.003* -0.177*
Ramadan (2013) -2.697* -0.609* - -0.051* - -0.213
Dewasiri and Weerakoon Banda (2015) -0.011 -1.133 - 0.004 - -0.004
18
3 Method
This chapter explains which methodological approach has been chosen and why. Further, it will introduce the strategy of the study and how it is conducted. Finally, the credibility of the study is discussed and the method is critically assessed.
Methodological Approach
The research approach of this study is of a deductive character. The deductive approach is the most common used approach in the view of the relationship between theory and research (Bryman & Bell, 2011). The process will follow the standard deductive format. From a theory, a hypothesis will be stated. After that, the data collection begins and from the tested and analyzed data, findings will be retrieved. The hypothesis will be either confirmed or rejected depending on the results. Finally, a revision of the theory can be made with the conclusion drawn from the tested hypothesis (Bryman & Bell, 2011). This paper will only focus on establishing whether there exists a relationship between the dividend yield and the stock price volatility. The question of why the relationship exist is not the primary objective of this study. Even though the subject may be touched upon and some reflections and ideas may be investigated, the authors leave it for future studies to investigate why the relationship exist.
Research Strategy
There are two main data collection methods, quantitative and qualitative data collection. The distinction between the two methods is that the quantitative method generatesand uses numerical data, and the qualitative method generates data in form of words that are more difficult to measure (Saunders, Lewis, & Thornhill, 2012). The choice of method lay ground to the strategy of the research. Today, the two methods are not mutually exclusive and the usage of a mix between them is common. Research refer to this as mixed method, but the usage of a mono-method is still widespread. This study use a quantitative data collection mono-method. The focus of the study is to validate a hypothesis and to be able to obtain accurate and measureable results that are generalized and suitable to draw statistically reliable conclusions from; for this purpose, the quantitative method is used.
19
Within the quantitative strategy, there are different designs that affect in what way you ask your research question. In addition, the answer you get from your questions will be
affected from the design of the study (Saunders et al. 2012). The research design of the study will first and foremost be of descriptive character. To establish the relationship of the hypothesis is the primary objective. An explanatory design will only be used secondary to the descriptive. When analyzing the results, the explanatory method might prove useful.
Data Collection
Two different types of data are used in research, primary and secondary data. New information generated by the researcher in order to answer the research questions are considered to be primary data. This data is often very time-consuming and costly to gather. Secondary data on the other hand is data that already exist, such as records and reports from companies, share prices, and surveys. This information is often more easy to access and therefore is most commonly used in most economic research (Zikmund, Babin, Carr, & Griffin, 2010). This study uses secondary data retrieved from economic databases. This is the most efficient way to get the data needed for the study, both speaking in cost terms but also time efficiency, especially since the data will cover a long period of time. A cross-sectional design of the data collection represents a certain form of research. This type, along with the longitudinal design is the most commonly used to measure changes in business research. The data is collected at multiple points in time. The strength of this type of design is the capacity to study change and development over a longer time-period (Bryman & Bell, 2011). This type of data collection is used in this study. The features of the design fit this study faultlessly. The data covers a long period of time and the cross-sectional research design was the most suitable option.
3.3.1 Gathering of Data
For many researchers the main advantage of using secondary data when conducting research is the huge saving of resources. In general, this saving gives the researcher more time to study the data set. Consequently, focus can be directed towards the analysis and the interpreting part. The use of secondary data also has the advantage of already being
20
primary data collected by the researcher. Others can check the data relatively easy, which makes the findings more open to public scrutiny (Saunders et al. 2012).
Although many data sets that are available from reliable sources seem to be trustworthy, it is hard to determine the quality of the data. The researcher must critically asses the data and the sources must be evaluated carefully. In this study, the authors strive to access as reliable data as possible. The sources utilized to gain data has been carefully picked with a critical point of view.
3.3.2 Study Period and Sample Size
The study period of this investigation will be as extensive as possible. The authors strive to collect as much data as possible. With this intention, the authors attempt to ensure that the findings and the results will be as accurate and factual as possible.In the data collection process, it was discovered that before the year of 2000, the data from the Swedish stock exchange was inconclusive. Not all variables were able to be included because of the lack of data. Therefore, to get as accurate and conclusive results from the data as possible the study period was specified to 2000-2015.
The tests are being performed on stocks that are listed on the Stockholm stock exchange. Beside the lack of data, the further back in time we go, there is also another issue to be addressed. Numerous of the companies on the stock exchange were not even listed before year 2000. This was taken into account when deciding which study period that should be used. The firms that has never paid out a dividend have been excluded from the sample. Furthermore, preferred stocks have also been excluded from the sample since they do not contain all the data that is necessary to be able to perform the tests. Companies that only have paid out a special dividend on few occasions have been removed since the objective with such a dividend does not apply in this study. Out of the 320 companies listed on the Swedish stock exchange, 178 are included in the sample.
3.3.3 Trustworthiness of the Data
Credibility refers to the internal validity of the study. The internal validity concerns the question of whether a conclusion that incorporates a causal relationship between a
21
dependent and an independent variable holds (Bryman & Bell, 2011). To avoid this issue, control variables will be used to establish that such relationship does not occur.
The external validity often refers to the transferability of a study. That is the question if the results of the study can be applicable and generalized beyond the research topic at hand (Saunders et al. 2012). In this study, this issue is not a major concern. The data that is used covers the full market and is representative. The statistical methods that are used can also be used in other contexts.
The dependability and stability of a study is very important. The measurement should be stable over time so that the results fluctuates as little as possible (Bryman & Bell, 2011). This study will use cross-sectional data, data that has been retrieved over a long period of time. This will assure that the dependability will not be an issue.
The measure of confirmability is difficult. Every author strives to affect the outcome of the study as little as possible. The matter of objectivity is sensitive and to which degree the author has allowed his or her values to affect the investigation should be kept to a
minimum. Complete objectivity is impossible in business research (Bryman & Bell, 2011). The authors have strived to affect the outcome as little as possible.
Research Method
To test if the phenomenon existin the Swedish market multiple regressions will be performed on the data. In a multiple regression two types of variables are being used, a dependent variable and one or several independent variables. A dependent variable may change in response to changes in other variables or manipulation of other variables. An independent variable is being manipulated and/or changed to measure its impact on a dependent variable. In this study, the stock price volatility will be the dependent variable and the dividend yield and the payout ratio will be the independent ones. Furthermore, the regression model will be expanded with control variables that will be included in the regression. They will also be independent variables. The study of Baskin (1989) shapes both the theoretical framework of the study, and the design of the regression (Hashemijoo et al. 2012). In addition to the regression model, a correlation analysis will be performed on the data to see if the variables are interrelated.
22
3.4.1 Regression Model
To find the relationship between the variables and the volatility of a stock, a regression model will be used. A regression model is a statistical tool, which calculates the
quantitative effect the independent variables has on the dependent variable. To cover outliers from the mean the model has an error term, ε. The 𝛽0 is the intercept of the linear
model, which means that without any influence from other variables this is the average volatility of the stocks. In the research, there are more than one independent variable, which means that a multiple regression model has to be used. The multiple regression model is similar to the simple regression model, however, it has more than one
independent variable, and it contains a new coefficient for every variable (Sykes, 1993). The Simple linear regression model is defined as (Anderson, Sweeney, Williams, Freeman, & Shoesmith, 2010, p. 492)
𝑌 = 𝛽0 + 𝛽1𝑥 + 𝜀 (1)
The Multiple regression model is defined as (Anderson et al., 2010, p. 557)
𝑌 = 𝛽0 + 𝛽1𝑥1 + 𝛽2𝑥2 +…. + 𝛽p𝑥p + 𝜀 (2)
Where the 𝛽p is the unknown parameters.
When performing a regression to see the relationship between the independent variable and the dependent variable, the existence of multicollinearity between the independent
variables has to be controlled. This is because the assumption of the regression is that no independent variable is correlated to each other. Multicollinearity generally exist when the correlation coefficient is greater than 0.70 (Drury, 2008).
From the regression output the coefficients will be retrieved, and the confidence interval of the variables. This output will then be illustrated in a graph for each variable to see the development over the study period. The confidence interval will be on the 90% level. The share price volatility will be regressed on the independent variables, with focus set upon the dividend yield and the payout ratio utilizing multiple least square regression, and when including the variables in the formula it takes on this form:
23
P-VOL = 𝛽0 + 𝛽1D-YIELD + 𝛽2P-OUT+ε (3)
Beside the regression model and the correlation analysis, descriptive statistics will be provided. Mean, minimum and maximum, and the standard deviation will be calculated. The normality assumptions of data in case of statistical analysis should be met. For large samples though, normality assumptions can be ignored due to the central limit theorem. Since the study is not profoundly dependent on the normality assumptions and it includes a large sample, it can be assumed that the stock prices follows a normal distribution
(Kleinbaum, Kupper, Muller, & Nizam, 1998). An estimation of the standard deviation of stock market returns equivalent to our measured volatility can also be calculated by multiplying the mean volatility with a constant, 0,6008, that is provided by Parkinson (1980).
3.4.2 Control Variables
The volatility of the stock price is often related to the basic risks the firm encounter in their product markets. The market risk may affect the optimal choice of dividend policy;
because of this, a control variable will be included to control the inherent variability in the firm’s earnings stream (Baskin, 1989). This variable is called earnings volatility, hereafter known as E-VOL.
Given the operating risk in a firm, there should be a connection between the leverage and the stock price volatility. Holding the operating risk constant, greater leverage should induce greater stock price volatility (Allen & Rachim, 1996). To display this in the study a control variable is included to reflect the corporate advantage. This variable is called Long-term Debt, hereafter known as DEBT.
The size of the firm may affect the volatility. Larger firms are often more diversified, both geographically and across industries, which lowers the risk for the firm. Furthermore, institutions and analysts tend to focus their time and funds on larger listed companies (Allen & Rachim, 1996). The market of smaller firms is because of this commonly more illiquid, there is less information available, and as a consequence of this, the price volatility tends to be higher. Because of the lack of information and the illiquidity of the stocks, new
24
events and new information could cause investors to act irrationally which causes even more volatility. Another aspect of the market size that has to be considered is that the size can influence the dividend policy in a firm. Firms with a more dispersed shareholder allocation could be more willing to use dividend policy as a signaling device (Baskin, 1989). Without a control variable for size a false relationship might be found, larger firms just happen to pay more dividends, thus a variable to control for this was a requisite. This variable is called firm size, hereafter known as SIZE.
The dividend payout policy might be inversely linked to the growth in assets and investment opportunities. The previously mentioned duration and rate of return effects assume timing differentials in the firm's cash flows. A variable to reflect growth was included. The suggestion that any remaining link between dividend policy and stock price volatility, after controlling for the influence of growth, would be suggestive of either the arbitrage or information effect (Baskin, 1989). The variable is called growth in assets and will hereafter be known as GROWTH.
3.4.3 Definition of the Dependent and Independent Variables
The dependent variable in this regression is the stock price volatility (P-VOL). The formula for the variable is derived from Parkinsons’ (1980) extreme value estimation of the variability of the rate of return. The number were obtained directly from Datastream, the authors made no calculations.
The two most important independent variables are dividend yield and the payout ratio. The dividend yield (D-YIELD) is expressed as the ratio of the cash dividend paid out to the shareholders and the market value of the stock. These numbers were obtained directly from Datastream; the authors made no calculations.
The payout ratio (P-OUT) is the percentage of the earnings that are paid out as dividends to the stockholders. The ratio is calculated by taking the ratio of a company’s dividend per share to the earnings per share. The numbers were obtained directly from Datastream; the authors made no calculations.
25
The variables listed from this point are control variables. The earnings volatility (E-VOL) measures how much the earnings fluctuate compared to the mean. The variable is
calculated by taking the ratio of a company’s EBIT (Earnings Before Interest and Taxes) to the total assets for each year. In the next step, the ratio is subtracted by the average of the ratio for all years and then squared. Lastly, the standard deviation is calculated by taking the square root (Dichev & Tang, 2009). Earnings and total assets numbers were obtained directly from Datastream.
The firm size (SIZE), or market value, is expressed as the share price multiplied by the number of shares issued. To get the variable to reflect the order of the magnitude in real terms, a transformation was made with a natural logarithm to convert the variable. The numbers for market value were obtained directly from Datastream and the authors performed the calculation with the natural logarithm.
The long-term debt (DEBT) is the ratio of the company’s long-term debt to the total assets. By calculating the ratio, we are able to see how much leverage the company has. The numbers for long-term debt and total assets were obtained directly from Datastream. These numbers represent all interest-bearing financial obligations excluding commitments due within one year. The calculations to get the ratio were made by the authors.
Growth in assets (GROWTH) is calculated by taking the ratio of the change in total assets during a year to the level of total assets at the beginning of the year. Asset growth is one of the most fundamental investment objectives. The numbers were obtained directly from Datastream.
After adding the control variables to the formula, it takes on this form:
P-VOL = 𝛽0+𝛽1D-YIELD+𝛽2P-OUT+𝛽3E-VOL+𝛽4SIZE+𝛽5DEBT+𝛽6GROWTH+ε (4)
Where, α is the intercept, β is the regression coefficient and ε is the error term. This specification of the model is similar to the ones used by Baskin (1989); Allen & Rachim (1996); Hashemijoo et al. (2012) and Hussainey et al. (2011).
26
3.4.4 Expected Results and Hypothesis
By reviewing the earlier studies and see what results they have acquired, see Table 1, some expectations from the study can be anticipated. The dividend yield, payout ratio, size, and growth in assets are expected to have a negative relationship with the stock price volatility. Thus, given an increase in either of the variables would induce a decrease of the volatility of the stock price. Significant negative relationships were acquired in most studies for dividend yield, payout ratio, and size. The variables that are expected to be positively related to the stock price volatility is the earnings volatility and the debt. Also in their case, significantly positive relationships have been reported.
The two variables that represents dividend policy in the study is dividend yield and payout ratio, they are of most importance in the regression model. The stock price volatility is expected to be effected negatively by the dividend yield. Baskin (1989) explained the negative impact based on the duration effect and the arbitrage effect. To demonstrate the duration effect he used the Gordon growth model (Gordon, 1962), and for the arbitrage effect, Black and Scholes’s (1974) study was utilized.
Moreover, also the payout ratio is expected to be inversely related to the stock price volatility. Baskin (1989) derived this impact from the rate of return effect and the
information effect. He argued that dividend payout could be used as a proxy for predicted growth and investment opportunities. In addition, he also explained that high dividend payout can be taken as a sort of stability of the firm, and therefore reduce the stock price volatility (Hashemijoo et al. 2012).
Beside the regression coefficient, correlation tests will be performed. In the Australian study by Allen and Rachim (1996) the correlation between dividend yield and the payout ratio is 0.424, the study in U.K. by Hussainey et al. (2011) got a correlation of 0.668, and in the Malaysian study by Hashemijoo et al. (2012) they retrieved a correlation of 0.537. The correlation between the variables is notoriously high in several studies compared to correlation between the other variables. Because of this, two regressions will be added. One regression in which all variables except D-Yield will be included, and one in which all
27
variables except P-OUT will be included. This was performed to eliminate the threat of multicollinearity in the results.
P-VOL =𝛽0+ 𝛽1P-OUT+𝛽2E-VOL+𝛽3SIZE+𝛽4DEBT+𝛽5GROWTH+ε (5)
P-VOL =𝛽0+𝛽1D-YIELD+𝛽2E-VOL+𝛽3SIZE+𝛽4DEBT+𝛽5GROWTH+ε (6)
By studying the literature and the previous studies, six hypotheses have been constructed. These hypotheses represent what the authors believe the outcome from the regressions will be. For each variable, a hypothesis has been created. The hypothesized sign only considers the coefficient, not the correlation.
H1: The dividend yield has a negative relationship with the volatility of the stock
price.
H2: The payout ratio has a negative relationship with the volatility of the stock
price.
H3: The earnings volatility has a positive relationship with the volatility of the
stock price.
H4: The firm size has a negative relationship with the volatility of the stock price.
H5: The long-term debt has a positive relationship with the volatility of the stock
price.
H6: The growth in assets has a negative relationship with the volatility of the stock
price.
Critical Assessment
This study uses secondary data as its primary source. By using secondary data, the question of the reliability of the sources must be considered. The data is gathered from the database Datastream, which gather the data from companies’ annual reports. The companies have to follow Swedish law and regulations that the stock exchange state, therefore the data should be reliable and useful. However, one issue is still observed since there are values missing in the data. This problem is handled by the statistical software used in the study, so the issue is not that problematic.
28
Within Swedish law and regulations, there are some possibilities for the companies to interpret different accounting standards and tax deductions, which will make the statistics somewhat ambiguous. However, the only way to solve this is to go through the companies’ annual reports and look at how they have produced the outcome and from that data conduct the study. This would be very time consuming and hard to interpret, and since the time is limited this is something that will be overlooked.
The length of the study period could be another critical point of the study, since the more data that is gathered the more reliable the results will be. When the data was gathered, the first idea was to collect as much data as possible back in time. However, the database only contained data that could be used from year 2000 and forward. Before that, too many missing values for the variables was the biggest issue.
29
4 Empirical Results
This chapter presents the results that were obtained from the statistical tests that were performed. First, the descriptive statistic and the correlation test will be presented. After that, the regressions will be displayed and lastly the graphs from the regressions.
Descriptive Statistics
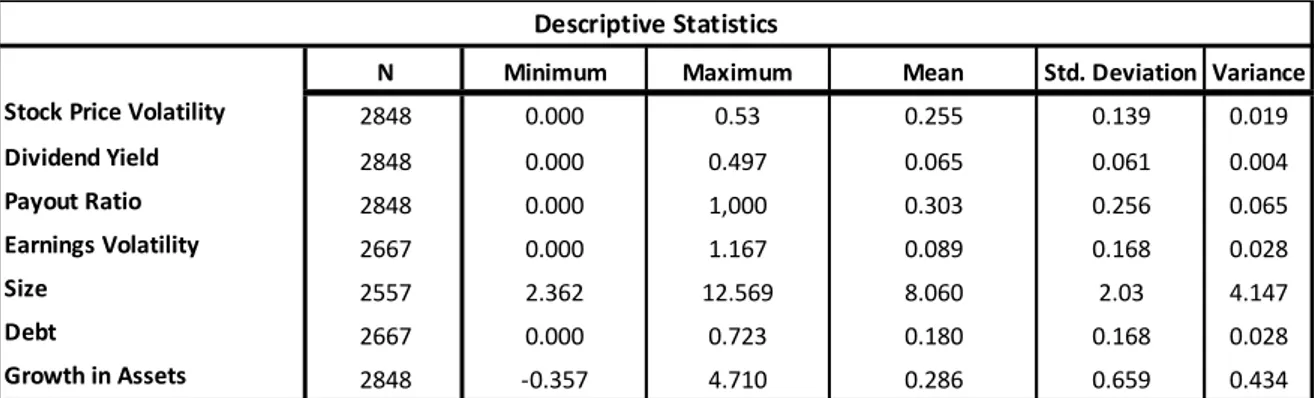
Table 2 - Descriptive Statistics
Table 2 represents the descriptive statistics of the data that have been used in the
regressions; it illustrates maximum, minimum, mean, standard deviation and variance. As mentioned in the method, the data set consist of 178 companies listed on the NASDAQ OMX Stockholm stock exchange and for each company 7 different variables are used. The most important variables are the stock price volatility, dividend yield and the payout ratio. As was stated in the method, stock prices are assumed to follow a normal distribution pattern; therefore, the standard deviation of stock market returns is equivalent to the measured volatility in of this study. This can be achieved by taking Parkinson’s (1980) formula, in line with Baskin (1989). (Hussainey et al. 2011) The mean price volatility, 0.255 is multiplied by the constant provided by Parkinson (1908), 0.6008, giving a result of 15.36%. The result for Hashemijoo et al. (2012) UK study was 17.66%, for Allen and Rachim’s (1996) Australian study was 29.42% and for Baskin’s (1989) U.S. study the result was 36.9%.
N Minimum Maximum Mean Std. Deviation Variance
Stock Price Volatility 2848 0.000 0.53 0.255 0.139 0.019
Dividend Yield 2848 0.000 0.497 0.065 0.061 0.004 Payout Ratio 2848 0.000 1,000 0.303 0.256 0.065 Earnings Volatility 2667 0.000 1.167 0.089 0.168 0.028 Size 2557 2.362 12.569 8.060 2.03 4.147 Debt 2667 0.000 0.723 0.180 0.168 0.028 Growth in Assets 2848 -0.357 4.710 0.286 0.659 0.434 Descriptive Statistics
30
Correlation
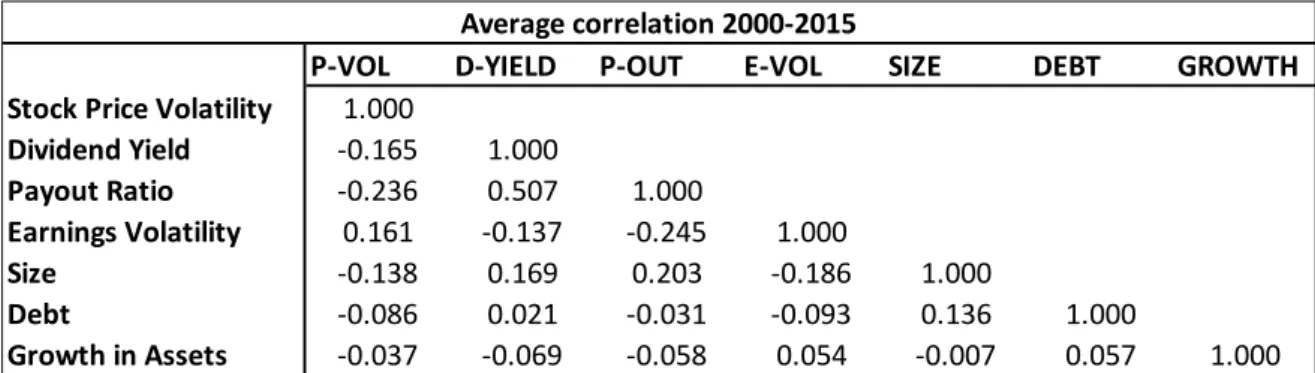
Table 3 – Average correlation coefficients
To display the correlation between the variables more explicit, a correlation matrix was created, see Table 3. No correlation coefficient between the dependent variable and the independent variables is greater than ±0.236. In the Australian study by Allen and Rachim (1996), the correlation between the dependent and independent variables is not greater than ±0.335, in the study in U.K. by Hussainey et al. (2011) they do not get a greater result than ±0.446, and in the Malaysian study by Hashemijoo et al. (2012) they did not retrieve a greater value than ±0.542. For multicollinearity to exist there must be correlation between two independent variables that is equal to or greater than 0.70 (Drury, 2008). The highest correlation in this test exist between dividend yield and payout ratio, 0.507. Since the number is relatively high compared against the other values, two regressions were added where the variables D-YIELD and P-OUT are excluded separately. Except for the
correlation between dividend yield and the payout ratio, no other correlation is greater than ±0,243, which is a strong indication that correlation between the independent variables in the regression is not a problem and that no multicollinearity exists.
Table 4 – The correlation coefficient between dividend yield and payout ratio
Table 4displays the correlation between the dividend yield and the payout ratio for all the years. Since the highest correlation was found between those variables and the risk of
P-VOL D-YIELD P-OUT E-VOL SIZE DEBT GROWTH
Stock Price Volatility 1.000
Dividend Yield -0.165 1.000 Payout Ratio -0.236 0.507 1.000 Earnings Volatility 0.161 -0.137 -0.245 1.000 Size -0.138 0.169 0.203 -0.186 1.000 Debt -0.086 0.021 -0.031 -0.093 0.136 1.000 Growth in Assets -0.037 -0.069 -0.058 0.054 -0.007 0.057 1.000 Average correlation 2000-2015 2000 2001 2002 2003 2004 2005 2006 2007 0.439 0.491 0.383 0.745 0.667 0.648 0.657 0.526 2008 2009 2010 2011 2012 2013 2014 2015 0.142 0.438 0.387 0.326 0.606 0.488 0.548 0.627
31
having trouble with multicollinearity is greatest between them, all values for each year is displayed.
Table 5 – Minimum correlation coefficients
This matrix displays the minimum values of the correlation coefficients for the study period 2000-2015. The lowest values are the correlation between the stock price volatility and dividend yield -0.516, and between stock price volatility and payout ratio -0.506. No other coefficient is lower. No correlation coefficient is below or above the multicollinearity value of ±0.70.
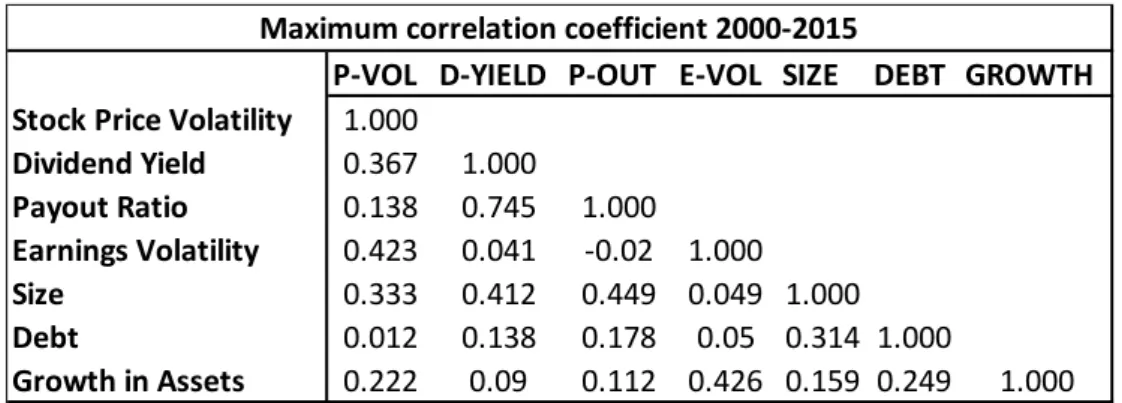
Table 6 – Maximum correlation coefficients
The maximum values of the correlation coefficient are presented in this matrix. The correlation between the stock price volatility and earnings volatility 0.423, and between size and both dividend yield 0.412, and payout ratio 0.449, are among the highest values. Also in the case of the maximum value, there is no number that exceeds the
multicollinearity boundary.
P-VOL D-YIELD P-OUT E-VOL SIZE DEBT GROWTH Stock Price Volatility 1.000
Dividend Yield -0.516 1.000 Payout Ratio -0.506 0.142 1.000 Earnings Volatility -0.218 -0.393 -0.431 1.000 Size -0.425 -0.046 0.037 -0.398 1.000 Debt -0.222 -0.116 -0.189 -0.228 -0.181 1.000 Growth in Assets -0.361 -0.283 -0.204 -0.322 -0.217 -0.175 1.000
Minimum correlation coefficient 2000-2015
P-VOL D-YIELD P-OUT E-VOL SIZE DEBT GROWTH Stock Price Volatility 1.000
Dividend Yield 0.367 1.000 Payout Ratio 0.138 0.745 1.000 Earnings Volatility 0.423 0.041 -0.02 1.000 Size 0.333 0.412 0.449 0.049 1.000 Debt 0.012 0.138 0.178 0.05 0.314 1.000 Growth in Assets 0.222 0.09 0.112 0.426 0.159 0.249 1.000