Ex-post empirical assessments of
environmental policies
– a literature review
Searching for a research design that can capture
causal effects of environmental policies on
environmental performance
Elisabeth Lång
VTI utlåtande 961 D.nr.:2020/0361-7.4
Table of Contents
Summary ...5
Sammanfattning ...7
1. Introduction ...9
2. Methods ...11
3. Empirical assessments of environmental policies ...13
3.1. Ex-ante empirical assessments of environmental (biofuel) policies: computational models ...13
3.2. Ex-post empirical assessments of environmental policies ...15
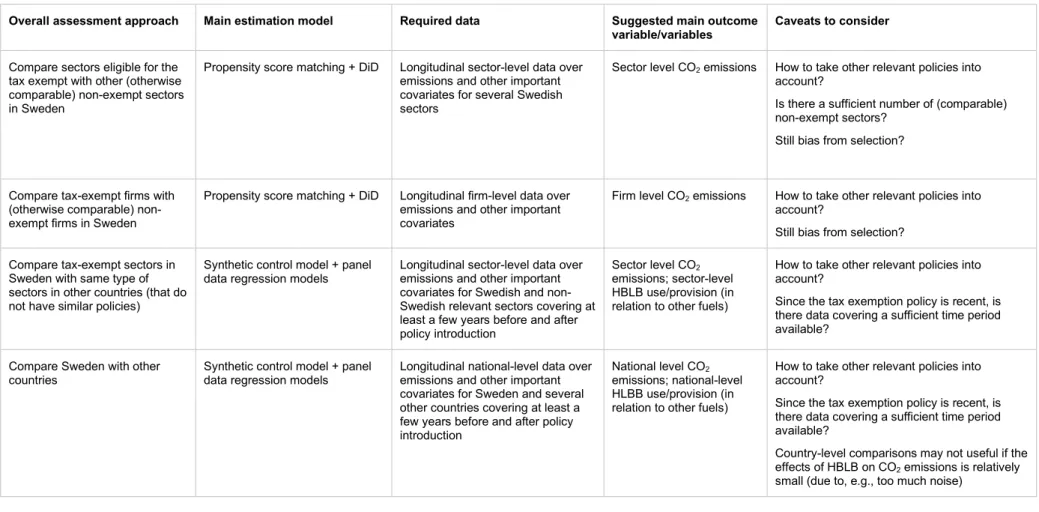
4. Suggestions for research designs to assess the Swedish tax exemption of pure and high-blended liquid biofuels ...30
Summary
Ex-post empirical assessments of environmental policies – a literature review by Elisabeth Lång (VTI)
In this essay, scientific literature that performs ex-post empirical (counterfactual) assessment of environmental policies is reviewed. The main purpose of the literature review is to get an overview of ex-post empirical assessment approaches, i.e. research designs, that aim to capture the causal effects of environmental policies on environmental performance. The literature review is intended to give guidance in the search for a suitable and feasible research design to assess the Swedish tax exemption
of pure and high-blended liquid biofuels.
30 articles are reviewed and grouped by research design/estimation model. Considering the small number of studies that apply counterfactual analysis explicitly on liquid biofuel policies, the review will include ex-post empirical assessment studies that focus on the broader concepts of renewable energy, CO2 taxation, and emission trading systems. Furthermore, since the literature on climate
change is dominated by studies employing computational (simulation) models, the literature review also includes a few (ex-ante) computational model studies. Based on research designs applied in the reviewed literature, together with the features of the Swedish tax exemption of pure and high-blended liquid biofuels, suggestions for research designs for ex-post empirical (counterfactual) assessment are given.
Sammanfattning
Ex-post empirisk utvärdering av miljöstyrmedel – en litteraturöversikt av Elisabeth Lång (VTI)
I denna studie granskas vetenskaplig litteratur som utför ex-post empirisk (kontrafaktisk) utvärdering av miljöstyrmedel. Det huvudsakliga syftet med litteraturöversikten är att få en överblick av ex-post empiriska utvärderingsmetoder som syftar till att identifiera kausala effekter av miljöstyrmedel på miljöutfall. Litteraturöversikten är avsedd att ge vägledning i sökandet efter en lämplig och
genomförbar forskningsdesign för att utvärdera Sveriges skattelättnader för rena och höginblandade
flytande biodrivmedel.
Litteraturöversikten inkluderar 30 artiklar, vilka grupperas efter forskningsdesign/estimeringsmodell. Då antalet studier som tillämpar kontrafaktisk analys på styrmedel för flytande biobränsle är få inkluderar litteraturöversikten även studier som fokuserar på de bredare begreppen förnybar energi, CO2-beskattning och system för handel med utsläppsrätter. Vidare, då litteraturen om
klimatföränd-ringar domineras av studier som använder sig av simulerings-/beräkningsmodeller för att skatta utfall av miljöstyrmedel, inkluderar litteraturöversikten även några sådana studier. Baserat på litteratur-översikten ges förslag på forskningsdesign som kan vara lämplig för ex-post empirisk (kontrafaktisk) utvärdering av Sveriges skattelättnader för rena och höginblandade flytande biodrivmedel.
1.
Introduction
A vital part of Sweden’s strategy on climate change is to promote use of motor fuels produced from biomass. Increasing the share of biofuels relative to fossil fuels is an important step for Sweden to achieve the 2030 EU target, as well as its national target to reduce greenhouse gas (GHG) emissions from domestic transports by at least 70% until 2030 compared to 2010 (EC 2017).1 Therefore⸻to
make biofuels become a competitive alternative to their fossil fuel equivalents⸻Sweden has had a state-aid approval from the EU allowing Sweden to exempt pure and high-blended liquid biofuels (HVO100, B100, and E85) from energy and carbon dioxide (CO2) tax.
As with any type of public policy, it is essential to assess the tax exemption of pure and high-blended liquid biofuels to ensure, e.g., policy effectiveness (did the policy have the intended impact on the
environment?), policy efficiency (are scarce resources used in the ‘best’ way?), and adaption needs
(should the policy be modified to be more effective/efficient?). However, considering the multitude of ongoing policies and other factors affecting the economy simultaneously, it is often difficult to perform valid and reliable evaluations of public policies. Bohlin (1998), referring to a methodology to evaluate economic instruments developed by OECD, suggests an ex-post assessment approach consisting of a set of seven criteria.2 Not going into details, these criteria can all be summed into one
to consider: “what would happen without the [policy instrument]?” (criterium no.7 in Bohlin (1998)). To answer this question, we need to apply a counterfactual analysis framework in order to capture the causal effects of the policy of interest.
The main purpose of this literature review is to get an overview of ex-post empirical assessment approaches that aim to capture causal effects of environmental policies on environmental (and economic) performance. The overview is intended to give guidance in the search for a suitable and feasible research design to assess the Swedish tax exemption of pure and high-blended liquid biofuels. Note that, due to small number of studies that apply counterfactual analysis explicitly on liquid biofuel policies, this review will include ex-post empirical assessment studies that focus on the broader concepts of renewable energy, CO2 taxation, and emission trading systems. Moreover, considering that
the literature on climate change is seemingly dominated by (ex-ante) studies employing computational models, this literature review will also include a few computational model studies.
This literature review is not intended to give an exhaustive presentation of all alternative research designs applied within the area of environmental policy, nor is it intended to describe research methodologies in specific details (for that I refer to the reviewed studies and recommended
econometric literature). Rather, this literature review is aimed to give an overview of applied research designs and identification strategies to assess environmental policy, as well as give guidance on when the different examples of identification strategies are suitable/feasible.3 Moreover, this literature
review is restricted to studies that are peer-reviewed (published in scientific journals, with the exception of a few working papers). Hence, reports from government agencies and other grey literature is not considered. For more details on the inclusion-exclusion criteria for the reviewed literature, see Section 2. Finally, this study does not intend to provide an explicit recommendation for
1 The EU climate and energy key targets for 2030 is to reduce GHG emissions by at least 40% compared to the
1990 levels, have at least 32% share of renewable energy, and at least 32.5% improvement in energy efficiency. These targets will be updated, including a 55% net GHG emission reduction target, in 2021 (EC 2020a).
2 The criteria in Bohlin (1998) to pursue when ex-post evaluating environmental policy (CO2 tax) are:
environmental efficiency; cost effectiveness; administrative and compliance costs; revenues; wider economic effects; dynamic effects and innovation; and what would happen without the tax?
3 Here, research design is defined as the broader concept of the overall strategy to address a research question.
An identification strategy is a narrower concept referring to how to use empirical methods on observational data to resemble a randomized experiment as closely as possible (see, e.g., Angrist and Pischke (2008)).
a specific research design or identification strategy to assess environmental policy. Instead, the final choice of research design for assessment of the Swedish tax exemption of pure and high-blended liquid biofuels should be devised based on the specific research question, data availability, as well as other theoretical and practical constraints.
The remainder of this essay is organized as follows. Section 2 presents the methods applied in the literature search. Section 3 presents the review of literature performing ex-ante empirical assessment (Section 3.1) and ex-post empirical assessment (Section 3.2) of environmental policies. Based on the literature reviewed, Section 4 gives suggestions for research designs to assess the Swedish tax exemption of pure and high-blend liquid biofuels.
2.
Methods
In this literature review, a combination of bottom-up and top-down searches was applied to obtain a representative sample of scientific studies assessing environmental policies (with the latter
complementing the former). The bottom-up search for literature is advantageous for scholars relatively new to a particular research field or research question. It is a systematic search process usually starting with identifying relevant keywords (search words). The next step in the bottom-up search is to use these keywords to work your way up to specific research findings, building general knowledge on the way. The top-down search is a less systematic approach, advantageous when the researcher is familiar with the research field or research question. It usually begins with (more detailed) searches in specific journals, articles, or authors. In this essay, the literature search was performed iteratively, updating the search process as needed, and included the following steps:
Bottom-up search
• formulation/identification of inclusion-exclusion criteria and keywords • systematic broad search using Web of Science (advanced search) • complementing searches in Scopus and Google Scholar
• initial evaluation and selection of search hits (research field/question, article title, abstract) • in-depth evaluation and selection of articles from the initial evaluation (the complete article). Top-down search
• applying a more specific combination of keywords in the searches (in Web of Science, Scopus, and Google Scholar)
• author search (searching directly for specific work by known authors in the research field) • references in (articles’ lists of) references
• searches in specific journals
• initial and in-depth evaluation and selection of search hits (see above).
Starting with the bottom-up search, the inclusion-exclusion criteria, used to select relevant articles to be included in the literature review, were devised:
Inclusion-exclusion criteria
• include articles that perform (ex-post) empirical assessment of environmental policy
concerning (liquid) biofuels, renewable energy, or GHG (CO2) emissions⸻exclude theoretical
articles and qualitive (case) studies as well as studies not directly connected to environmental policy
• include (ex-post empirical) articles that aim to capture causal effects of environmental policies⸻exclude descriptive studies
• include (peer-reviewed) articles published in scientific journals (also including working papers) between 2000 and 2020⸻exclude articles published before 2000, student literature, governmental agency reports, research institute reports, and other grey literature
• include articles mainly studying countries within the OECD⸻exclude articles focusing on non-OECD countries4
• include articles that focus on (direct) impacts of environmental policy on environmental performance (GHG emissions, supply and demand for biofuels/renewable energy)⸻exclude articles in which the main focus is innovations and technology development or
secondary/indirect effects of environmental policy.
Based on the inclusion-exclusion criteria, the keywords to be used in the search engines/literature databases were identified:
Keywords
• Policy keywords: economic instrument; policy/policies; policy instrument; environmental polic*; tax; carbon dioxide tax; tax reduction; tax exemption; tax credit; aid; state aid; subsid*; emission trading system*; (EU) ETS; regulation*; mandate*5.
• Fuel/energy keywords: biofuel*; biodiesel; biogas; ethanol (E85); HVO; B100; FAME; renewable energy; renewable fuel*.
• Assessment keywords: assessment*; evaluat*; impact*; effect*; causal effect*; counterfactual analysis; empirical; ex-post; econometric*; panel data (model).
• Other keywords: transport*; greenhouse gas (GHG) emission*; climate; climate change; mitigation; carbon dioxide (CO2).
The keywords were then used in various combinations to find relevant literature. When the initial number of search hits were large, only the 100 most cited studies were considered in the initial selection of relevant literature. Following the bottom-up and top-down search procedures described above, the final sample of selected articles for the review consists of 26 ex-post assessment studies and three ex-ante assessment studies (and one meta-analysis). The articles were then grouped by research design and main estimation model. Two of the reviewed studies stand out when it comes to applying suitable research design to estimate causal effects when there is no ‘ideal’ control group, Andersson (2019) and Gerster and Lamp (2019). Based on these, a set of four alternative research designs for assessment of the Swedish tax exemption for pure and high-blended liquid biofuels is proposed.
4 This inclusion-exclusion criterium is based on that OECD countries are likely to share more similarities with
Sweden compared to non-OECD countries. This distinction may be of importance when searching for a suitable and feasible research design to assess Swedish environmental policy.
3.
Empirical assessments of environmental policies
The common assumption is that environmental policies improve firms’, regions’, or countries’ environmental performance and thus, overall, contribute to mitigating climate change. Yet, evaluating the effectiveness and efficiency of an environmental policy is not an easy task – not the least
considering the multitude of ongoing policies making it difficult to single out the effect of one specific policy.
The literature on climate change is dominated by studies employing ex-ante (but also ex-post) computational/simulation models, in particular the computational general equilibrium (CGE) model (Bagatunde et al. 2017). Considering this, although this literature review’s focus is ex-post empirical assessment, reviewing studies applying computational model methods seems inevitable. A few carefully chosen computational modelling studies assessing environmental (biofuel) policies are therefore briefly described (Section 3.1).
Although ex-ante computational models are useful for theoretical model building, a drawback is that they are, in fact, highly theoretical.6 Ex-post empirical assessment, on the other hand, is based on
realized events and can provide estimates of both short- and long-term outcomes of an intervention such as the introduction of an environmental policy. However, in order to capture the true impact of environmental policy instruments (as opposed to descriptive analysis) we need to employ a research design that is designed to estimate the causal effects of an intervention.
This literature review will focus on studies intending to estimate causal effects of policy interventions in a counterfactual analysis fashion. Due to small number of studies that apply counterfactual analysis explicitly on (liquid) biofuel policies, the review of ex-post empirical policy assessment will include studies that focus on the broader concepts of renewable energy, CO2 taxation, and emission trading
systems (Section 3.2). The studies that have research designs/identification strategies that stand out as potentially useful for an assessment of the Swedish tax exemption of pure and high-blended liquid biofuels will be discussed in more detail in Section 4.
3.1. Ex-ante empirical assessments of environmental (biofuel) policies:
computational models
The application of computational models, such as CGE models and agent-based modeling, to assess various aspects of policies aimed for adaption of climate change have increased in recent years (see, e.g., Babatunde et al. (2017) and Castro et al. (2020) for overviews). The motivation for the use of such models is that environmental policies cannot be evaluated independently of the rest of the economy (Kretschmer & Peterson 2010). Environmental policies normally, directly or indirectly, affect several economic sectors and involves many levels of decision-making in an economy.
Moreover, ex-post assessment of the welfare impacts of biofuel production may be difficult since the increase in the use of biofuels is recent (Nkolo et al. 2018).
A vast number of CGE studies assess the impact of biofuel policy instruments and use on overall income and economic growth. The overall conclusions to be drawn from this strand of literature is however ambiguous, with varying results on the impact of biofuel policies. Nkolo et al. (2018) performs a meta-analysis of 30 CGE studies from across the world published between 2006 and 2017. They find that biofuel-supportive policies generate significant impacts on GDP and household
incomes, but the signs and magnitudes of the simulated effects vary between geographic regions as
6 Andersson (2019) provides an example of large differences in results from an application of a simulation
approach and an ex-post empirical assessment; the ex-post empirical assessment of CO2 tax by Andersson (2019)
shows that the effect of CO2 tax on CO2 emissions is almost 40 times larger than the estimated effect in an earlier
well as type of biofuel considered. For instance, OECD and Asian countries seem to have higher gains from biofuel policies in terms of GDP compared to North America, whereas Europe and Asia had higher gains in terms of household income. Biofuel policy impact on GDP is positive for a scenario including both biodiesel and bioethanol, but negative in a scenario including bioethanol only.
Applying computational models, many scholars have assessed the impacts of biofuel policies on GHG emissions. For instance, Beckman et al. (2011) employ a global CGE model to simulate regional impacts of biofuel mandates on economic patterns of production, consumption, trade, land use, and GHG emissions over a 30-year period. Two scenarios are considered in this study, Scenario 1, which includes medium-term (5–7 years into the future) biofuel mandates for US, EU, and Brazil, and
Scenario 2, which covers medium-term mandates that have been set for all world regions. The
simulation results suggest that the impact of biofuel mandates on GHG emissions varies with industry (forest and pasture), but the aggregate net effect is negative (with largest effect in Scenario 2). Thompson et al. (2011) use partial equilibrium modelling to assess impacts of US biofuel policies on world markets for petroleum and GHG emissions. This study focuses on implications of policies for biofuels, agriculture, petroleum, and petroleum product markets 10 years into the future. Interestingly the overall results suggest that, under certain conditions, eliminating policies aiming to increase the use of US biofuels results in a net reduction in world GHG emissions. The explanation for this is that eliminating such policies would lead to substitution of biofuels for gasoline and diesel in the US. Following this, the global petroleum product prices would increase, reducing demanded quantities abroad and, hence, GHG emissions originating from abroad would decrease. Notably, as the authors also mention, there is uncertainty in the international elasticities of supply and demand used in the computations, which casts some doubt on the results’ reliability. Moreover, it is likely that there are other factors, not considered in this study, important for the linkage between biofuel policies and GHG emissions.
Fischer and Newell (2008) assess different types of policies aiming to reduce CO2 emissions as well as
promote innovation and diffusion in renewable energy. In their theoretical model, two subsectors in a perfectly competitive market are included, one emitting (fossil fuels) and one non-emitting
(renewables). The model also has two stages (covering a number of years each), in which electricity generation, consumption, and emissions occur in both stages, but investment knowledge only take place in the first stage (for more details on the set-up of the model, see Fischer and Newell (2008)). The policy scenarios considered includes a no policy scenario, four price-based policies (related to taxes, tradeable permits, and subsidies), and two rate-based policies (portfolio and performance standards). Fischer and Newell then perform a numerical application of the model on US electricity production. The simulation results suggests the following ranking of policy effectiveness in reducing emissions: (1) emission price; (2) emission performance standard; (3) fossil power tax; (4) renewables share requirement; (5) renewable subsidies; and (6) R&D subsidies. It is also emphasized that “an optimal portfolio of policies achieves emission reductions at a significantly lower cost than any single policy” (p.144).
3.2. Ex-post empirical assessments of environmental policies
As of today (fall of 2020), there are close to 700 active renewable energy policies in Europe. These policies come in different shapes and forms, such as fiscal/financial incentives, regulations and mandates, grants and subsidies, tax reliefs, et cetera, to promote renewable energy use in one way or another (IEA 2020). Two of the most common renewable energy policy instruments across the world are feed-in tariffs (FiT) and renewable portfolio standards (RPS). Both are designed to reduce investors’ risk by creating long-term markets for renewable energy generation. FiT aim to increase investment in renewable energy technologies by offering long-term contracts, which often entails promising an above-market price for the energy that they deliver, to renewable energy producers. RPS, on the other hand, are mandates (or “quotas”) rather than financial incentives. They typically require an increasing share of electricity generation from renewable sources of the total electricity generated (Carley et al. 2017, IEA 2020). In addition to FiT and RPS, there are a multitude of policy instruments and programs aiming to promote renewable energy, such as blending mandates, renewable energy production tax credits, and sales tax credits.
Closely related to renewable energy policies are CO2 taxation and emission trading systems, as they
ultimately have the same overall climate change goals. CO2 taxation and emission trading systems,
such as the EU emission trading system (EU ETS), take aim to reduce GHG (CO2) emissions. Both are
market-based instruments, with the former working ‘directly’ through price mechanisms in accordance with the ‘polluter pays’ principle and the latter is a cap-and-trade system with transferable permits (EC 2020b, Government Offices of Sweden 2020).
The mutuality of these environmental policies (renewable energy policies, CO2 taxation, and emission
trading systems) is that they are likely to have impacts on the economy that is not only connected to climate change (see, e.g., Brännlund and Lundgren (2010), De Gorter and Just (2009a,b), and
Jorgenson et al. (1992)). Implementing new policies or policy reforms can entail high direct costs. But it could also impose indirect costs (or gains) in terms of changed firm profitability, international competitiveness, or consumer demand, to name a few. As a result, the net effect of policy
implementation on overall welfare may be negative. Hence, assessing the effectiveness and efficiency of environmental policies are of great importance for an economy.
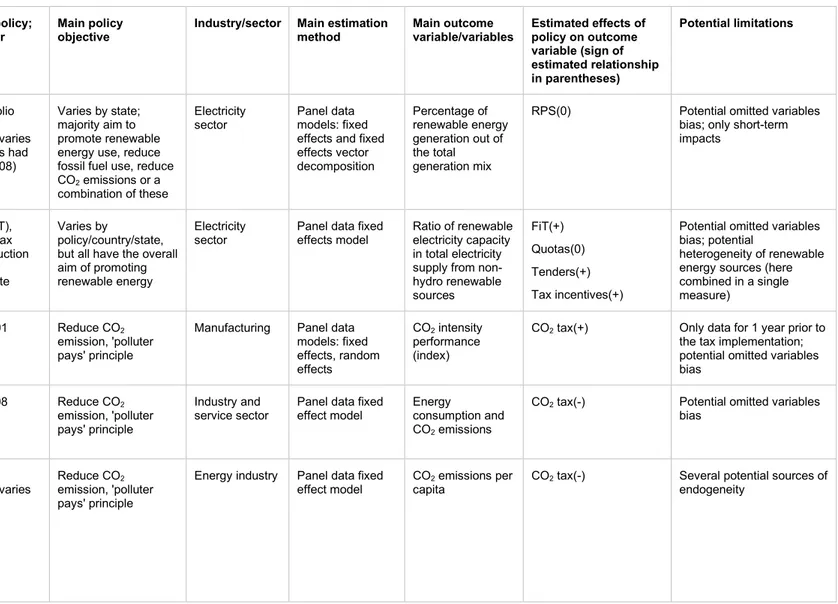
Performing ex-post empirical assessment, we usually want to find the causal effects of an intervention. The gold standard for estimating causal relationships is to use randomized experiments. However, randomized experiments are often too costly or not ethically feasible. The next best thing is to use observational data in such a manner that we approximate a randomized experiment—this approach is what is sometimes called identification strategy (Angrist & Pischke 2008). Some of the literature that aim to estimate the causal effects of different environmental policies are presented below (see also Table 1 and Section 4).7 8 The literature is grouped in accordance with main estimation method
applied: panel data (fixed or random effects) models; two-stage (Heckman selection) modeling;
instrumental variable estimation; difference-in-difference (DiD) and propensity score matching; synthetic control models; cross-sectional models on firm survey data; and time-series analysis.
7 Note that potential limitations in Table 1 refers to potential issues that could be of importance for interpreting
the results and evaluating specific research designs. Note that these limitations does not necessarily represent an exhaustive list of all potential limitations.
8 Another study that gives a good overview of ex-post assessments of environmental policies using state- or
Table 1 Ex-post empirical assessments of environmental policies Author(s), publication year Country; data; time period Environmental policy;
introduction year Main policy objective Industry/sector Main estimation method Main outcome variable/variables Estimated effects of policy on outcome variable (sign of estimated relationship in parentheses)
Potential limitations
Carley, 2009 US; annual state-level data; 1998-2006
Renewable Portfolio Standard (RPS); introduction year varies by state (27 states had active RPS by 2008)
Varies by state; majority aim to promote renewable energy use, reduce fossil fuel use, reduce CO2 emissions or a
combination of these
Electricity
sector Panel data models: fixed effects and fixed effects vector decomposition Percentage of renewable energy generation out of the total generation mix
RPS(0) Potential omitted variables bias; only short-term impacts
Kilinc-Ata,
2016 EU and US; annual country-/state-level data, 1990-2008
Feed-in tariffs (FiT), quotas, tenders, tax incentives; introduction year varies by policy/country/state
Varies by
policy/country/state, but all have the overall aim of promoting renewable energy
Electricity
sector Panel data fixed effects model Ratio of renewable electricity capacity in total electricity supply from non-hydro renewable sources FiT(+) Quotas(0) Tenders(+) Tax incentives(+)
Potential omitted variables bias; potential
heterogeneity of renewable energy sources (here combined in a single measure)
Brännlund et
al., 2014 Sweden; annual firm-level data; 1990-2004
CO2 taxation; 1991 Reduce CO2
emission, 'polluter pays' principle
Manufacturing Panel data models: fixed effects, random effects CO2 intensity performance (index)
CO2 tax(+) Only data for 1 year prior to
the tax implementation; potential omitted variables bias
Fauceglia et
al., 2020 Switzerland; annual firm-level data; 2002-2015 CO2 taxation; 2008 Reduce CO2 emission, 'polluter pays' principle Industry and
service sector Panel data fixed effect model Energy consumption and CO2 emissions
CO2 tax(-) Potential omitted variables
bias Hajek et al., 2019 Denmark, Finland, Ireland, Slovenia, and Sweden; annual country-level data; 2005-2015 CO2 taxation;
introduction year varies by country
Reduce CO2
emission, 'polluter pays' principle
Energy industry Panel data fixed
effect model COcapita 2 emissions per CO2 tax(-) Several potential sources of endogeneity
16
VTI
utlåtande
Author(s), publication year Country; data; time period Environmental policy;
introduction year Main policy objective Industry/sector Main estimation method Main outcome variable/variables Estimated effects of policy on outcome variable (sign of estimated relationship in parentheses) Potential limitations Montoya Gómez & Zimmer, 2017 39 countries in OECD and BRICS; firm-level data; 2007-2012
Renewable energy loans and subsidies (RELS), feed-in tariffs (FiT), expansion of combined generation of heat and power (CHP), energy audits (EA), energy efficiency (EE) loans and subsidies; introduction year varies by country
Varies by country; majority aim to promote use of renewable energy Manufacturing, energy, and utility sector
Panel data first difference model; Heckman selection model CO2 emissions RELS(-) FiT(+) CHP(+) EA(+) EE(0)
Potential omitted variables bias Delmas & Montes-Sancho, 2011 US (48 states); annual state-level and electric-utility-level data; 1998-2007 Renewable portfolio standard (RPS); Mandatory green power option (MGPO); introduction year varies by state
Promote renewable
energy use Electricity sector Two-stage (Heckman selection) model Renewable capacity MGPO(+) RPS(0/-) Possible multicollinearity in main model Jaraite et al.,
2014 Sweden; annual firm-level data; 1999-2008
EU ETS; 2005 CO2 taxation; 1991
Reduce CO2 emission Multiple
non-energy sectors Two-stage (Heckman selection) model Environmental expenditure; environmental investment Expenditure: EU ETS(+) CO2 tax(+) Investment: EU ETS (-/0) CO2 tax (0)
Short time series with respect to the introduction of the EU ETS
Hitaj, 2013 US; annual county-level data; 1998-2007
Federal renewable energy production tax credit (PTC), state-level sales tax credit (SLSTC), production incentives (PI); property tax incentives (PTI); renewable portfolio standard (RPS); introduction year varies by policy and county (state)
Varies by policy/state, majority aim to promote use of renewable energy
Wind power Random effects tobit; instrumental variable estimation Addition in MW to existing installed wind capacity in a county PTC(+) SLSTC(+) PI(+) PTI(0) RPS(0) Small number of uncensored observations; potential endogeneity and inefficiency from several sources
VTI
utlåtande
961
Author(s), publication year Country; data; time period Environmental policy;
introduction year Main policy objective Industry/sector Main estimation method Main outcome variable/variables Estimated effects of policy on outcome variable (sign of estimated relationship in parentheses)
Potential limitations
Li et al., 2014 US; annual state-level data, 1960-2008; household-level data, 1995, 2001, 2009 Gasoline tax;
introduction year varies by state (by end of 1930s, all 48 states had state gasoline tax)
Tax revenues (reduce gasoline consumption; 'polluter pays' principle)
Transportation
sector Instrumental variable estimation; panel data fixed effects model; first difference model Gasoline consumption; vehicle miles traveled (VMT); vehicle fuel economy (miles per gallon, MPG) Gasoline consumption: gasoline tax(-) VMT: gasoline tax(0) MPG: gasoline tax(+/?)
Only considers short-term responses to (relatively small) tax changes
Davis & Kilian,
2011 US; monthly country-level and state-level data; 1989-2008
Gasoline tax;
introduction year varies by state (by end of 1930s, all 48 states had state gasoline tax)
Tax revenues (reduce gasoline consumption; 'polluter pays' principle)
Transportation
sector OLS; instrumental variable estimation; structural vector autoregressions Gasoline consumption; CO2 emissions
Gasoline tax(-) Only considers short-term responses to (relatively small) tax changes
Martin et al.,
2014 UK; annual manufacturing plant-level data; 1993-2004 CO2 taxation; 2001 Reduce CO2 emission; 'polluter pays' principle Manufacturing Instrumental variable estimation Several related to energy intensity and use, emissions, and economic performance Energy intensity: CO2 tax(-)
Electricity use: CO2
tax(-) Economic performance: CO2 tax(0) Questionable exogeneity of treatment status Carley et al., 2017 164 countries; annual country-level data; 1990-2010
Feed-in tariffs (FiT); Renewable portfolio standards (RPS); introduction year varies by country Varies by policy/country/state, majority aim to promote use of renewable energy Electricity
sector DiD Percentage of total electricity from RE; total RE
generation
FiT(+) RPS(+)
Possible endogeneity of FiT; unclear if parallel trend assumption holds
Stevens, 2018 US, monthly electric power plant-level data, 2003-2014
Clean air interstate rule (CAIR), 2005; Regional greenhouse gas initiative (RGGI), 2009; Air resource board (ARB) emission trading program, 2012/2013
Reduce SO2 and CO2
emissions Electricity sector DiD Natural gas-fired combined cycle (NGGC) capacity factor = (actual electricity output/potential output) CAIR(+) RGGI(0) ARB(0)
Unclear if the parallel trend assumption holds
18
VTI
utlåtande
Author(s), publication year Country; data; time period Environmental policy;
introduction year Main policy objective Industry/sector Main estimation method Main outcome variable/variables Estimated effects of policy on outcome variable (sign of estimated relationship in parentheses)
Potential limitations
Lin & Li, 2011 Denmark, Finland, Norway, the Netherlands, Sweden; annual country-level data; 1981-2008 CO2 taxation;
introduction year varies by country
Reduce CO2
emission, 'pollutor pays' principle
Multiple DiD Growth rate in per
capita CO2
emissions
Finland: CO2 tax(-);
No statistically
significant results for the other included countries
Unclear if the parallel trend assumption holds; disregarding sector heterogeneity
Gerster &
Lamp, 2019 Germany, annual plant-level data, 2007-2013
Exemption from the Renewable energy sources levy
(Erneuerbare energien
gesetz, EEG, levy);
policy reform 2012
Foster
competitiveness of exporters in international markets
Manufacturing Propensity score
matching and DiD Plant-level electricity consumption; fuel input choices; competitiveness indicators; CO2 emissions Electricity consumption: tax exemption(+) Own electricity generation capacities: tax exemption(-) Competitiveness: tax exemption (0) CO2 emissions: tax exemption(+)
Only short-term impacts; do not consider plant
entry/exit; not completely robust to selection Jaraite-Kažukauske & Di Maria, 2016 Lithuania; annual firm-level data; 2003-2010
EU ETS; 2005 Reduce CO2 emission Multiple Propensity score
matching and DiD COCO22 emissions; intensity;
investment behavior; profitability of firms CO2 emissions: EU ETS(0) CO2 intensity: EU ETS(+/0) investment: EU ETS(+) profitability: EU ETS(0)
External shocks may have caused CO2 leakage,
influencing the results, unclear external validity
Huseynov &
Palma, 2018 US (California); annual state-level data; 1997-2014
Low Carbon Fuel
Standard (LCFS); 2007 Reduce CO2 emission Transportation sector Synthetic control; DiD; Lasso machine learning CO2 emissions per mile in the transportation sector; total emissions in the transportation sector
LCFS(-) Only short-term impacts
VTI
utlåtande
961
Author(s), publication year Country; data; time period Environmental policy;
introduction year Main policy objective Industry/sector Main estimation method Main outcome variable/variables Estimated effects of policy on outcome variable (sign of estimated relationship in parentheses)
Potential limitations
Andersson,
2019 Sweden; annual data per capita CO2 emissions from transport, 1960-2005; annual gasoline consumption and price, 1970-2011
CO2 taxation (and
value-added tax on transport fuel); 1991
Reduce CO2
emission; 'polluter pays' principle
Transportation
sector Synthetic control; time series Per capita COemissions 2 (transport)
CO2 tax(-)
CO2 tax elasticity of
demand for gasoline is ~3 times larger than price elasticity
Could be other variables closely linked to CO2
emission that is not considered; uncertain external validity Runst & Thonipara, 2020 Sweden; annual country-level data; 1990-2016 CO2 taxation; 1991 Reduce CO2 emission; 'polluter pays' principle Residential
sector Synthetic control and DiD Per capita COemissions 2 (residential)
CO2 emissions(-) Heterogeneous tax rates in
other countries; potential confounding effects of other energy policies Rammer et al., 2017 Austria, Germany, Switzerland, firm-level survey data collected in 2015 Multiple, non-explicit policy instruments: energy taxation, energy regulation, standards and voluntary agreements, subsidies for energy technology, demand incentives for green energy Multiple Manufacturing and service sector Survey; Cross-sectional OLS, tobit, and probit models, semi-parametric matching method
Export
performance Overall, no relevant influence of energy policies on firms' international market position
Potential measurement error in survey data; survey data collected only at one point in time; potential selection Woerter et al., 2017 Austria, Germany, Switzerland, firm-level survey data collected in 2015 Multiple, non-explicit policy instruments: energy taxation, energy regulation, energy subsidies Multiple Manufacturing, service, and construction sector Survey; Heckman
selection model Adoption of green technologies Several policy types effectively stimulate the adoption of green energy technologies and energy management systems.
Potential measurement error in survey data; survey data collected only at one point in time
20
VTI
utlåtande
Author(s), publication year Country; data; time period Environmental policy;
introduction year Main policy objective Industry/sector Main estimation method Main outcome variable/variables Estimated effects of policy on outcome variable (sign of estimated relationship in parentheses) Potential limitations Marques et al., 2019 46 countries, annual country-level data, 1996-2017
Multiple: public policies supporting renewables (PPSR); introduction year varies by policy/country Promote utilization/ generation of renewable energy Wind power, solar photovoltaic, non-hydro renewables Autoregressive distributed lag (ARDL) models using the Driscoll and Kraay estimator with fixed effects Level of renewable energy sources (RES) diffusion Importance of PPSR for renewable energy varies with technology and time horizon
Unclear if country-specific heterogeneity in policies is considered
Rajcaniova et
al., 2013 EU, US, and Brazil; weekly prices of oil, ethanol, and gasoline for 2002-2010 and biodiesel and diesel for 2005-2010
Blender's tax credits (US), tax exemption (EU and Brazil), and mandates (US, EU, and Brazil); introduction year varies by policy/country
Promote biofuel production or consumption
Transportation
sector Cointegration analysis and a Vector error correction model
Prices of ethanol
and biodiesel US blender’s tax credit and Brazils consumer tax exemption have an effect on ethanol price levels in other countries; EU policies is important for world biodiesel price
Potential omitted variable bias
Schmelev &
Speck, 2018 Sweden; timeseries of CO2 emissions, energy/fuel use, imports of palm oil and coffee; 1961-2012
CO2 and energy taxation;
1991 Reduce COemission, 'polluter 2 pays' principle
Multiple Time-series analysis: linear model
CO2 emissions CO2 tax(0) (except for
the case of petrol), other fuel-specific taxes(-)
Neglection of possible sector heterogeneity (only aggregated data)
Widerberg &
Wråke, 2011 Sweden; weekly data; 2004-2008
EU ETS; 2005 Reduce CO2 emission Electricity
generation Autoregressive distributed lag model
CO2 intensity No indications of a link
between EU-ETS and CO2 intensity
Short time series; neglection of possible sector heterogeneity (only aggregated data)
VTI
utlåtande
961
Panel data (fixed or random effects) models
One commonly applied methodological approach to assess environmental policies is panel data
regression models with fixed or random effects. Although standard panel data models often cannot
fully eliminate bias from, e.g., omitted variables or selection, part of the potential endogeneity can be accounted for by using fixed (or random) effects (see, e.g., Angrist and Pischke (2008) for specifics). In a well-cited study by Carley (2009), a panel data model with fixed effects (as well as a model with fixed effects vector decomposition) is used to assess the impact of RPS on renewable energy
generation in the US. The author builds her model based on a directed acyclic graph, in which Carley illustrates the potential causal pathways through which RPS can affect renewable energy generation. Yet, Carley’s regression results give no support for that RPS enhances renewable energy generation, with negative coefficients that are statistically insignificant. Similar results have been found by others, such as Delmas and Montes-Sancho (2011), Hitaj (2003), and Kilinc-Ata (2016). By contrast, Carley et al. (2017) find evidence of a positive relationship between RPS and renewable energy generation in a extensive sample covering 164 countries (more on these studies below).
Kilinc-Ata (2016) also employs a panel data model with fixed effects to study the relationship between renewable energy policies and renewable energy generation in the US, but also in EU. This study considers a multitude of renewable energy policies in addition to RPS and utilizes a longer time period (1990–2008) than Carley (2009). Similar to Carley (2009), Kilinc-Ata finds no evidence on that quotas promote renewable energy (capacity). Instead, it seems that FiT, tenders, and tax incentives are
statistically significantly correlated with renewable energy capacity. This suggests that financial incentives are more important than RPS when it comes to promoting renewable energy. Brännlund et al. (2014) employ panel data models with fixed and random effects to analyze the effectiveness of the Swedish CO2 tax on carbon intensity in production. Brännlund et al. uses
firm-level data from the Swedish manufacturing sector for the period 1990–2004. A drawback is that their data series is relatively short, considering that it only covers one year prior to the tax implementation. On the plus side, the data series covers several years after the tax was implemented. The data series also ends before 2005 when the EU ETS was implemented, minimizing disturbance from the EU ETS on the estimates. Estimating a log-linear Cobb-Douglas-type of function three-ways (OLS, fixed effects, random effects) yields results that suggests two things: (1) the CO2 tax decreases carbon
intensity performance in the majority of manufacturing sectors included; and (2) the carbon intensity performance is statistically more responsive to changes in the CO2 tax compared to changes in fossil
fuel price. The authors show that the Swedish manufacturing industry became 45% less carbon intensive between 1991 and 2004. The conclusion drawn is that it is the CO2 tax that is the main
reason for this development.
A panel data model with fixed effects is used on firm-level data also in a recent study by Fauceglia et al. (2020), but for the Swiss context. The research question they seek to answer is whether CO2 tax
contributes to the mitigation of climate change by reducing energy consumption and CO2 emissions.
The Swiss CO2 tax increased by 400% during the period 2008–2015 and, according to the results of
this study, this led to reductions in energy consumption and CO2 emissions by up to 8% in the industry
and service sector. Running regressions on disaggregated samples by sector, the results show that higher CO2 tax has heterogeneous effects depending on the sector. As pointed out by the authors
regarding the response to higher CO2 tax: “while the industry sector substitutes light oil with natural
gas and systematically cuts back on the consumption of oil, firms in the service sector consume less of both fossil fuels without switching to less carbon-intensive energy sources” (p.1). This emphasize the importance of considering potential variations in policy response across industry/sector when
assessing environmental policies.
The above described studies on CO2 taxation use firm-level data in their empirical strategies. Hajek et
Ireland, and Slovenia, 2005–2015. Estimating a standard linear fixed effects model, the results suggest that CO2 taxation efficiently decreases GHG emissions. However, Hajek et al. declare that the
identification strategy potentially suffers from several sources of endogeneity, such as model misspecification and omitted variables (see Hajek et a. (2019), Table 7).
Two-stage (Heckman selection) modeling
One source of endogeneity causing problems in regression estimation is selection into treatment. A potential solution to this problem is to use two-stage (Heckman selection) modeling (Heckman 1979, Wooldridge 2010). Montoya Gómez and Zimmer (2018) apply panel data first difference and Heckman approaches on manufacturing, energy, and utility companies in 39 countries in OECD and BRICS, 2007–2012, to investigate the impact of renewable energy policies on GHG emissions. The main outcome variable firm CO2 emission is based on survey data over voluntary disclosures, raising
concerns for potential selection. To surpass bias from such selection, the Heckman selection model is used. Considering several renewable energy policies, this study finds that financial incentives increase the use of renewable energy and reduce CO2 emissions. Montoya Gómez and Zimmer also find that
energy auditing increases the use of renewable energy and decreases CO2 emissions.
Motivated by potential self-selection related to policy adoption, Delmas and Montes-Sancho (2011) employ the tobit model, but in a Heckman fashion using a logit model in the first stage. In this study, the impact of RPS and Mandatory green power option (MGPO) on the capacity of renewable energy is assessed.9 To do this, a dataset consisting of information on both the plant-utility level (650 electricity
plants) and the state-level (48 states) for the period 1998–2007 is used. In the first stage, the
probability of adopting a RPS/MGPO is estimated. This is then used in the second stage, in which the relationship between RPS/MGPO and renewable capacity is explored using the tobit model. Without going into further details on the identification strategy employed in this study (for that I refer the reader to Delmas and Montes-Sancho (2011)), the results show that, overall, MGPO is more effective than RPS. Important to take away from the study by Delmas and Montes-Sancho is that, as described by the authors themselves (p.2274): “our findings also indicate the importance of modeling the factors that trigger policy adoption to analyze policy effectiveness. When modeling such factors, the effect of RPS on renewable capacity becomes negative and significant while it was insignificant with the previous methodologies used in the literature. In addition, we find that different types of utility react differently to the policies”.
Jaraite et al. (2014) assess the impacts of the EU ETS and CO2 tax on environmental expenditure (all
costs for environmental expenditure that is not investment) and investment (in air pollution abatement) among non-energy firms in Sweden, 1999–2008. Despite access to an extensive firm-level data set, the authors face a potential problem of selection since environmental expenditure/investment can only be measured if a firm decides to spend/invest. Jaraite et al. therefore use the Heckman selection model as their main specification. The main research question in this study “is whether the introduction of the EU ETS in 2005 has had any effect on Swedish firms’ environmental behavior” (p.157). To answer this question, the authors define their main explanatory variable as the interaction between a dummy equal to 1 for the EU ETS time period (2005–2008) and a dummy a dummy equal to 1 if a firm was covered by this scheme. Using this (along with a number of other covariates) in both a fixed effects model and the Heckman selection model, the resulting coefficients suggests that EU ETS had a significant positive impact on environmental expenditure, but negative or insignificant impact on environmental investment. Similar results are found for the CO2 tax.
9 MGPO “requires electricity suppliers to provide an option for their customers to purchase green power either
Instrumental variable estimation
Another methodological approach to deal with a potential endogeneity issue is to use instrumental
variable estimation. For an instrument to be valid two criteria must be met: (1) the instrument must
have a clear effect on the (endogenous) explanatory variable (X); and (2) the instrument must only influence the dependent variable via X (Angrist & Pischke 2008). Considering this, finding a good instrument is not always (if ever) an easy task. The instrumental variable approach can also be used when empirically analyzing a natural experiment. A natural experiment approximates a ‘real’ experiment in that treatment and control status is randomly assigned. The main difference between a real and a natural experiment is that assignment of treatment is out of the control of the researcher in the latter.
Hitaj (2013) investigates multiple environmental policies impacts on wind power development in the US between 1998 and 2007. The author use two techniques to control for potential endogeneity of state policies: (1) tobit regression on a sample restricted to states that had zero wind power investment before any policy was offered; and (2) instrument state policies with the ratio of Democrats to
Republicans in the state lower and upper houses and in the US House and Senate, the percentage of US House representatives by state voting for Waxman/Markey Bill, and the state marginal damages of
sulfur dioxide pollution.10 Including covariates related to energy prices, state and county Geographic Information Systems (GIS) data, and technological changes, the regression results suggests that the
federal production tax credit, state-level sales tax credit, and production incentives are important for wind power development. The estimated impact of property tax incentives is ambiguous and varies with model specification. Most of the model specifications result in small and statistically insignificant coefficients on RPS. In other words, Hitaj finds no evidence of RPS enhancing wind power
development (similar to the findings by Carley (2009)). By contrast, both physical and procedural access to the electricity grid are important for wind power development. Notably, as mentioned by Hitaj herself, the estimated models in this study may suffer from endogeneity and inefficiency issues because of four main reasons: (1) the number of uncensored observations is small relative to the censored observations, which may lead to inflated standard errors in the tobit model; (2) the issue of censoring remains in the instrumental variable approach; (3) cannot completely separate between supply and demand of wind power (generation and transmission); and (4) small cross-sectional variation for state-level policies.
Li et al. (2014) employ several methodological approaches in their identification strategy, of which one is instrumental variable estimation. The main research question in this study is how gasoline taxes affect gasoline consumption as distinct from tax-inclusive retail gasoline prices. To find the answer to this, Li et al. use both aggregate US state-level data on gasoline consumption, taxes, and prices (annual, 1960–2008) and household-level data on vehicle ownership and driving decisions (from the
National household travel survey, 1995, 2001, and 2009). The aggregated data is used to analyze
gasoline consumption responses to tax and price changes and the household-level data is used to examine vehicle choice (vehicle fuel economy/miles per gallon) and vehicle usage (vehicle miles
traveled). For the aggregated sample, the authors argue that explanatory variable gasoline tax is
exogenous but that the tax-exclusive gasoline price may not be “if state-level demand or supply shocks are correlated with equilibrium prices and consumption”. Tax-exclusive gasoline price is therefore instrumented by using crude oil prices. The regression results indicate that, overall, gasoline consumption is more responsive to changes in the gasoline taxes than in gasoline prices. For the household sample, the results indicate that increasing the gasoline tax may have some positive effect on vehicle fuel economy, but no effect on vehicle miles traveled. Li et al.’s (2014) study is closely
10 H.R. 2454 (111th): American Clean Energy and Security Act of 2009 sponsored by Representatives Waxman
related to the work of Davis and Kilian (2011). Davis and Kilian also address the endogeneity of gasoline prices by instrumenting it with changes in gasoline taxes by state and month. In assessing the impacts of gasoline taxes, Davis and Kilian find that higher taxes reduce gasoline consumption (and ultimately CO2 emissions). The instrumental variable estimates are much larger than the corresponding
OLS estimates, suggesting a downward bias in the latter.
One of the most important climate change policies imposed on the business sector in the UK is the
Climate change levy (CCL). The CCL basically consists of a carbon tax together with a scheme of
voluntary agreements available to plants in selected energy intensive industries. Now, plants in the UK can join the Climate change agreement (CCA), in which a plant adopts a specific target of energy consumption or carbon emission in exchange for discounted tax liability under the CCL. The condition for being eligible for the tax discount is if the plant emitted pollutants subject to environmental
regulation pre-dating the CCL. Martin et al. (2014) exploit this, as they argue, exogenous variation in tax rates in order to estimate the impacts of carbon tax on energy intensity and electricity use. Using a manufacturing plant-level data set covering the period 1993–2004, Martin et al. finds that the carbon tax has negative impacts on energy intensity and electricity use, but no significant impacts on plants’ economic performance.
Difference-in-difference models and propensity score matching
Another type of identification strategy that has gained in popularity in the environmental policy literature is the method of difference-in-difference (DiD) (see, e.g., Carley et al. (2017), Gerster and Lamp (2019), and Lin and Li (2011)). DiD is basically an extension of a panel data model with fixed effects that is useful when the regressor only varies at the aggregate level (Angrist & Pischke 2008), such as a country or industry/sector. The basic premise of the DiD approach is to compare the outcome of a treated group (treatment group) with the outcome of a non-treated group (comparison/control
group) that share the same trends in pre-treatment covariates. If there is no suitable comparison group,
one can use propensity score matching adapted for DiD (Blundell et al. 2004). Propensity scores are based on the conditional probability of treatment, which can be computed using parametric or semiparametric methods. Conditional on the computed propensity score, the distribution of observed covariates will be similar between the treatment and comparison group (Austin 2011, Cameron & Trivedi 2005; see also Angrist and Pischke (2008) and Blundell et al. (2004)).
Carley et al. (2017) employs a DiD framework to analyze whether FiT and RPS promote renewable energy generation growth. The study is motivated by the mixed evidence for the effectiveness of these types of policies – in particular for RPS, but also for FiT outside OECD. The authors therefore aim to estimate the causal effect of these policy instruments on renewable energy generation by analyzing an extensive data set on 164 countries across the world between 1990 and 2010. The identification strategy entails a standard DiD estimator to compare pre- and post-policy trends in renewable energy generation among countries with (the treatment group) and without (the control group) FiT and RPS policies, controlling for other important covariates. To adjust for potential spatial correlations or serial correlation, Driscoll-Kraay standard errors are used.11 The results indicate that both types of policies
are important predictors of renewable energy market growth, in particular national-level policies⸻but they are not the only factors contributing to renewable energy growth. In fact, statistical significance of covariates such as GDP and population growth suggest that countries develop more renewable energy as their economy is expanding. Political variables also seem to be important for renewable energy growth. This in turn suggests that “policy instruments, while important, are not by themselves sufficient to encourage meaningful investment in renewable energy” (p.438).
Another study employing the DiD technique on environmental policy assessment is Stevens (2018). Stevens evaluates the effects of regional and state environmental policies, aimed to reduce SO2 and
CO2, and natural gas prices on utilization of natural-gas combined cycle (NGCC) in the US, 2003–
2014. Stevens finds that, in addition to changes in natural gas prices, environmental policy has contributed to increases in NGCC utilization. However, it is only one of the policies, Clean Air
Institute Rule (CAIR), that have a significant positive effect on NGCC utilization, and the effect is
decreasing with plant age. Nevertheless, according to Stevens’ further analysis, the effect of CAIR on NGCC utilization is nearly double the effect compared to that of decreased natural gas prices, averting almost twice as much CO2 emissions over the cumulative 2008–2014 time period. Moreover, even
though this study does not provide evidence on that regional GHG policy programs affect NGCC utilization, studying a longer time series may reveal different results.
Using country-level data to evaluate environmental policies, Lin and Li (2011) assess the effect of CO2 taxation on CO2 emissions in Denmark, Finland, Norway, the Netherlands, and Sweden. These
five countries are assigned to the treatment group in a DID framework. Motivated by the fact that “European countries have many commonalities in terms of economy, environmental policies and more” (p.5140), 14 other EU members are used as the control group. The regression results give indications of a negative impact of CO2 tax on the growth rate of CO2 emission in Finland. No
statistically significant relationships are found for the other four countries. The heterogeneity in the estimated policy impacts is argued to be because of different tax rates, national tax exemption policies on certain energy intensive industries, and usage of CO2 tax revenues. Notably, one could argue that
the choice of control group in the study by Lin and Li (2011) is not optimal. The characteristics of European countries vary greatly on several levels, and it is unclear whether the included countries have the same pre-treatment trends in all other relevant covariates.
Gerster and Lamp (2019) aim to estimate the causal impact of electricity taxation, or rather an exemption from a renewable energy source levy (the Erneuerbare energien gesetz (EEG) levy), on plant-level electricity consumption, fuel input choices, and competitiveness indicators.12 In doing so,
the authors employ an identification strategy that combines propensity score matching with DiD estimation on annual manufacturing plant-level data from the German Manufacturing Census (2007– 2013). As the authors describe, the naïve way of designing the study would be to use EEG exempt plants as the treatment group and the non-exempt plants as the control group. Although an appealing strategy because of its simplicity, the resulting estimates would likely be biased since the treatment status is based on plant characteristics related to plant size and energy-intensity. The solution applied here is to use propensity score matching to construct a control group of non-exempt plants that closely match the treated plants in terms of pre-treatment covariates (more on Gerster and Lamp’s
identification strategy in Section 4). The results suggest that the EEG exemption led to an increase in electricity consumption (5.1–7.5%) and CO2 emissions (3.1–5.8%) as well as a decrease in own
electricity generation capacity, but overall no statistically significant effect on competitiveness. The main mechanism at work for the increased electricity consumption of exempt plants is fuel switching, i.e., exempt plants switch from gas to electricity and are less likely to engage in own electricity production. Moreover, since the results do not give evidence of that the EEG exemption improved competitiveness, the EEG exemption seems to have been poorly targeted.
Aiming to estimate the causal impacts of EU ETS participation on CO2 emissions, CO2 intensity,
investment behavior, and profitability of firms, Jaraite-Kažukauske and Di Maria (2016) use propensity score matching and DiD. The assessment is performed using a dataset of around 5000
12 The Erneuerbare energien gesetz (EEG) is a renewable energy act that established FiT for private investors in
Germany, aiming to promote private investment in renewable energy. The EEG is financed through a levy on electricity prices. The EEG levy accounts for 30% of the industry electricity price in Germany (Gerster & Lamp 2019).
Lithuanian firms between 2003 and 2010. The propensity scores are measured using data from 2004 (the ‘pre-treatment year’, i.e., the year before the introduction of the EU ETS) and based on a probit model estimation on set of carefully chosen variables. In the analysis, the outcome variables in the pre-treatment year is compared to their counterparts in the subsequent years. The results give no support for the hypothesis that participating in the EU ETS reduced CO2 emissions or affected the profitability
of Lithuanian firms. There are, however, some indications that the CO2 intensity slightly decreased
and investment increased among EU ETS participating firms. Synthetic control approaches
In more recent years, synthetic control modelling has been employed together with, or as an alternative to, the DiD estimator (see, e.g., Huseynov and Palma (2018) and Runst and Thonipara (2020)) to surpass the lack of an ‘ideal’ control group. The synthetic control method is a data-driven approach suitable to use to construct counterfactuals, without potential decision bias of the researcher. It constructs a ‘synthetic’ control group by utilizing a weighted combination of a group to which the treatment group is compared (Abadie et al. 2010; see also Abadie and Gardeazabal (2003)). The synthetic control method also relaxes the parallel trends assumption that underlies the DiD estimator by allowing the effects of unobserved confounders on emission to vary over time (Andersson 2019, citing Abadie et al. (2010)).
Huseynov and Palma (2018) applies the synthetic control approach to investigate the efficiency of the
Low Carbon Fuel Standards (LCFS) program in California, US. The LCFS is a policy approach
designed to reduce CO2 intensity of motor fuels for on-road light-duty vehicles. Since light-duty
vehicles accounts for the majority of transportation emissions in US (70% in 2014), environmental policies such as the LCFS may be an important step in the work against climate change. Huseynov and Palma assess the LCFS program by employing two methodological approaches in addition to the synthetic control, the DiD and Lasso machine learning. The synthetic control approach is used to construct a control group from a weighted combination of all states (the synthetic control group) but California (the treatment group). The DiD approach instead uses an average of all other states as control group. Finally, the Lasso machine learning approach is used to “validate the choice of control variables and to account for potential endogeneity in the policy treatment” (p.8). Huseynov and Palma apply the three approaches on annual (publicly available) state-level data between 1997 and 2004, which all three yield similar results: the introduction of the LCFS has lowered the CO2 emissions in
California by around 10%.
Arguing to be the first study to provide evidence of a significant causal effect of CO2 taxes on
emissions, Andersson (2019) finds that CO2 tax has reduced CO2 emissions from the transport sector
in Sweden by almost 11% over the period 1990–2005.13 Andersson’s paper consists of two parts in
which two different modelling approaches are used. First a synthetic control method is used to estimate the impact of the Swedish CO2 tax and value-added tax (VAT). In the second part a
time-series analysis is used to estimate CO2 tax elasticity, with the purpose of disentangling the effects of
CO2 tax and VAT on CO2 emissions. In the synthetic control model, per capita CO2 emissions from
the transport sector (based on combustion of fuel from road, rail, domestic navigation, and domestic aviation) in Sweden is compared to the same in a so-called ‘Synthetic Sweden’. The synthetic Sweden is a weighted average of 14 other OECD countries that did not implement carbon taxation or similar policies during the treatment period considered. The weighted average is constructed based on four key variables assumed to be closely related to CO2 emissions: GDP per capita, number of motor
vehicles, gasoline consumption per capita, and percentage of urban population. Analyzing data ranging from 1960 to 2005 shows that Sweden had very similar trend in CO2 emissions in the pre-treatment
13 Supplementary materials to Andersson (2019) are available at the article’s page:
period compared to Synthetic Sweden, but up to 11% lower CO2 emissions in the post-treatment
period. The results are fairly robust to several placebo tests. Moreover, the estimated magnitude and sign of the CO2 taxation impact on the Swedish transport sector contrasts previous studies’ findings
(see, e.g., Lin and Li (2011)) and is about 40 times larger than previously simulated by Ministry of Environment and Energy (2009).The time-series analysis in the second part of the paper shows that the CO2 tax elasticity of demand for gasoline is about three times larger than the price elasticity.
Runst and Thonipara (2020) follow Andersson’s (2019) work, but with focus on the Swedish
residential sector. Using European country-level data between 1990 and 2016, the authors apply both synthetic control modeling and DiD to study the impact of CO2 tax on per capita residential CO2
emissions (from space and water heating and electricity use of all residential dwellings). The results give indications of a relatively strong negative impact of CO2 taxation on residential CO2 emissions.
Runst and Thonipara “find that the reduction of residential carbon emissions stemming from the carbon tax augmentation ranges from 200 kg (when compared with other countries with a carbon tax of more than 20 euro) to 800 kg (when compared with countries without a carbon tax) of CO2 per capita per year” (p.1).
Cross-sectional models applied on firm survey data
In two recent studies, Rammer et al. (2017) and Woerter et al. (2017), aim to capture the effect of renewable energy policies on export performance and adoption of green technologies, respectively, by utilizing a cross-sectional firm survey dataset. The survey was conducted in Austria, Germany, and Switzerland in 2015. The survey dataset contains information on energy consumption, the role of energy policy for a firm’s operation, the development and adoption of energy-related (‘green’) technologies, as well as a range of firm characteristics. Rammer et al. (2017) use standard regression model estimations (OLS, tobit, and probit models) as well as semi-parametric matching method. The latter is used for analyzing country-specific policy effects and in which treated firms is matched with firms with similar characteristics (based on a number of variables) within the same country. Woerter et al. (2017) instead utilize a Heckman model to deal with potential selection. Rammer et al. (2017) finds no overall relevant influence of energy policies on export performance. In contrast, Woerter et al. (2017) finds quite strong indications of that many energy policies, in particular subsidies, positively stimulate adoption of green technologies.
Time-series analysis
A common approach to study changes in fuel or energy prices is to use time-series analysis. Time-series analysis is also used for assessing environmental policies (see, e.g., Andersson (2019) and Schmelev and Speck (2018)), some of which the main methodological approach and results are reviewed below.
Rajcaniova et al. (2013) estimate different biofuel policies’ impacts on price leaderships in world biofuel markets. Since biofuel and fossil fuel prices are interdependent, applying a simple linear (OLS) model would produce biased estimates. The authors instead use cointegration analysis, to deal with potential non-stationarity of the data series, and a Vector error correction model on the cointegrated variables (for more on these models, see, e.g., Greene (2008)). To answer their research question, EU, US, and Brazil is compared using a dataset of weekly prices of oil, ethanol, and gasoline for the time period 2002–2010 and biodiesel and diesel for the period 2005–2010. Biofuel policies considered is a blender’s tax credit (US), tax exemptions (EU and Brazil), and mandates (EU, US, and Brazil). The main findings of this study suggest that the US blender’s tax credit and Brazils consumer tax exemption have an effect on ethanol price levels in other countries and that EU policies is important for world biodiesel price.
Schmelev and Speck (2018) use a standard linear model on a time series on Swedish data of CO2