TO M A TE D S YS TE M L EV EL S O FT W A R E T ES TIN G O F N ET W O R K ED E M B ED D ED S YS TE M S 2018 ISBN 9789174854084 ISSN 16519256
Address: P.O. Box 883, SE-721 23 Västerås. Sweden Address: P.O. Box 325, SE-631 05 Eskilstuna. Sweden E-mail: info@mdh.se Web: www.mdh.se
Mälardalen University Press Licentiate Theses No. 275
AUTOMATED SYSTEM LEVEL SOFTWARE
TESTING OF NETWORKED EMBEDDED SYSTEMS
Per Erik Strandberg 2018
School of Innovation, Design and Engineering
Copyright © Per Erik Strandberg, 2018 ISBN 978-91-7485-408-4
ISSN 1651-9256
I went to the woods because I wished to live deliberately, to front only the essential facts of life,
and see if I could not learn what it had to teach,
and not, when I came to die, discover that I had not lived.
– Henry David Thoreau
Abstract
Embedded systems are ubiquitous and play critical roles in management sys-tems for industry and transport. Software failures in these domains may lead to loss of production or even loss of life, so the software in these systems needs to be reliable. Software testing is a standard approach for quality assurance of embedded software, and many software development processes strive for test automation. However, important challenges for successful software test automation are: lack of time for testing, lack of test environment availability, and an excess of test results information that renders decision-making hard.
In this thesis these challenges are tackled in three ways. First, in order to combat lack of time for testing, a method for automated system level re-gression test selection was implemented and evaluated using data from several years of nightly testing in a real world industrial setting. It was shown that automated test selection can be integrated into system level nightly testing and solve problems such as nightly testing not finishing on time. Second, in order to improve the hardware coverage of devices in the test environment and how test cases map to hardware, an algorithm based on the subgraph isomorphism problem was implemented and evaluated using industrial data. This imple-mentation was significantly faster than the previous impleimple-mentation, and the mapping process was done in such a way that hardware coverage increased over iterations. Third, to better understand decision-making in critical steps of the software development process in an industrial setting, two empirical studies were conducted. The results showed how visualizations and a test re-sults database support decision-making. Rere-sults also describe the overall flow of information in software testing: from developers to hardware, and back to developers via the test results database.
Automated system level software testing of networked embedded systems can be difficult to achieve. This thesis addresses several important challenges and provides results that are of interest both to industrial practitioners and re-searchers.
Sammanfattning
Inbyggda system finns överallt och har viktiga roller i styrsystem för industri och transport. Mjukvarufel i dessa domäner kan leda till produktionsbortfall eller dödsfall, så mjukvaran i dessa system måste vara pålitlig. Populära agila mjukvaruutvecklingsprocesser fokuserar på testautomatisering, men att testa mjukvara med hjälp av riktig hårdvara kan vara långsamt.
Två viktiga utmaningar för att framgångsrik testautomatisering är brist på tid, och dålig tillgänglighet till testmiljö. Med automatisering och kontinuerlig integration kommer en ökande mängd information om testresultat som gör det svårt att fatta beslut. När testsviter ändras, och testfall mappas på olika delar av de fysiska testsystemen över tid, så kan det bli svårt att fatta informerade beslut.
För att förbättra testning givet dessa utmaningar så har vi undersökt regressionstestselektion på systemnivå, samt metoder för att få mappningen av testfall på testsystem att variera över tid för att få en ökande hårdvarutäckning. För att bättre förstå beslutsprocesser genomförde vi en studie på Westemo Research and Development AB för att undersöka hur beslutsprocesserna ser ut i kritiska steg i utvecklingsprocessen. Vi genomförde även en intervjustudie hos fem organisationer som jobbar med inbyggda system för att förstå mjukvarutestningens informationsflöde.
Vi fann att automatisk testselektion kan integreras in i processen för nat-tlig testning för att lösa problem som att testningen inte slutar i tid. Vi fann också att automatisk mappning av testfall på testsystem kan göras på ett sådant sätt att hårdvarutäckningen ökar över tid. Vidare så identifierade vi hur visu-aliseringar och en testresultatsdatabas ger beslutsstöd. Slutligen beskriver vi mjukvarutestningens informationsflöde från utvecklare till hårdvara, och till-baka till utvecklare via en testresultatsdatabas.
Populärvetenskaplig
sammanfattning
I moderna industriella automatiseringssystem, som ombord på tåg eller i vat-tenreningsverk, spelar kommunikationsnätverket en kritisk roll. Bortfall av service kan få allvarliga konsekvenser som minskad produktion eller eventuellt dödsfall. Mjukvaran i inbyggda system i nätverk måste vara robust, och mjuk-varutestning är standard som metod för kvalitetskontroll. Denna testning är dyr, repetitiv, kan begränsa tiden till marknad och drabbas ofta av förseningar. Testautomatisering är därför önskvärd.
Westermo Research and Development AB samarbetar i ett pågående forskningsprojekt med Mälardalens Högskola där Per Erik Strandberg undersöker testautomatisering av dessa system. Strandbergs forskning fokuserar på två huvudområden. För det första, hur testar vi på ett smartare sätt givet begränsade resurser: ska vi alltid köra alla testfall? Vilken hårdvara ska vi använda för testerna? För det andra, hur kan vi använda den ökande mängd data om testresultat som kommer från ökad testautomatisering?
Den första delen av Strandbergs forskning är inriktad på förbättrade al-goritmer och implementering av dessa i verktyg. Ett exempel på ett sådant verktyg är Svitbyggaren som väljer de viktigaste testfallen givet ett antal prior-iteringskriterier. Ett andra verktyg väljer hårdvara för testningen. För att kunna visa att dessa verktyg utökar forskningsfronten så gjorde han utvärderingar med industriell data som samlats in under flera år. Däribland detaljer om miljoner av testexekveringar, och även information om hur hårdvara organis-erats i testsystem. Resultaten visar att förbättrade verktyg löser kritiska prob-lem: med Svitbyggaren så avslutas nu testningen i tid och tillkortakommanden i kvalitet hittas tidigare. Vidare så kan allokeringen av hårdvara ändras över tid, något som förbättrar testtäckningen.
Den andra delen av Strandbergs forskning använder kvalitativa metoder där intervjuer med utövare är centrala. Han transkriberade mer än 20 timmar ljud till mer än 130 sidor text som sedan analyserades med metoder med
sprung i forskning om psykologi. I dessa studier visar Strandberg hur testresul-tat nu visualiseras och hur beslut tas med hjälp av en databas med testresultestresul-tat. Han visar även det övergripande informationsflödet i mjukvarutestningspro-cesserna, samt teman, utmaningar och bra tillvägagångssätt. De viktigaste bra tillvägagångssätten är: nära samarbete och kommunikation mellan roller.
Det finns ett gap mellan industri och akademi inom fältet mjukvarutest-ning. Strandbergs resultat och beskrivningar av verktyg kan guida och inspir-era andra industriella utövare. Vad gäller forskning inom visualisering och kommunikation som skulle kunna vara viktig för det fortsatta arbetet så ligger akademin före och mycket forskning har redan gjorts. Men utmaningen att allokera hårdvara är ny för akademin. Det är uppenbart att framtida forskning om mjukvarutestning skulle dra nytta av ett fortsatt samarbete mellan industri och akademi, och Strandberg hoppas spela en roll i överbryggandet av gapet.
Acknowledgments
Writing a licentiate thesis at the age of 40 means that I am old enough to have had a my life influenced by a lot of people. Many are those who have helped me move towards research, many have helped me believe in myself, and in this research project. First of all I would like to thank my family: my mother Gudrun for opening the door to the wonderful world of mathematics; my father Jan for learning me to see the positive things in life and not care so much about the negative; my brother Jonas for helping me have two feet on the ground; my wife Anna for always being there for me; and finally my children Knut and Vera for making me play in the forest, for learning about Minecraft, for teaching me about emotions, and for being the stochastic process that randomly adds chaos into my otherwise gray life.
This work would not have been possible without wonderful colleagues at Westermo, MDH and other places. First I would like to thank Raimo for first proposing industrial doctoral studies all those years ago. Thanks also to Monika and Kristian for pushing me in the right direction. I would like to thank academic supervisors and co-authors: Daniel, Wasif, Eddie, Tom, Elaine and Robert. Finally thanks to awesome managers I have had: Patric, Peter and Petra.
My research in this thesis was funded by Westermo Research and Development AB and the Swedish Knowledge Foundation through grants 20150277 (ITS ESS-H), and 20160139 (TESTMINE). In addition, coauthors have been funded by the Swedish Knowledge Foundation through grants 20130085 (TOCSYC), and 20130258 (Volvo Chair); the Swedish Research Council through grant 621-2014-4925 (EXACT); as well as the European Union’s Horizon 2020 grant 737494 (MegaM@Rt2).
Per Erik Strandberg Västerås, Fall of 2018
List of Publications
Papers included in thesis
12Paper A: P. E. Strandberg, D. Sundmark, W. Afzal, T. J. Ostrand, and E. J. Weyuker. Experience Report: Automated System Level Regression Test Prioritization Using Multiple Factors. In International Symposium on Software Reliability Engineering (ISSRE). IEEE, 2016. Winner of best research paperaward [65].
Paper B: P. E. Strandberg, T. J. Ostrand, E. J. Weyuker, D. Sundmark, and W. Afzal. Automated Test Mapping and Coverage for Network Topologies. In International Symposium on Software Testing and Analysis (ISSTA). ACM, 2018 [64].
Paper C: P. E. Strandberg, W. Afzal and D. Sundmark. Decision Making and Visualizations Based on Test Results. In Empirical Software Engineer-ing and Measurement (ESEM). ACM, 2018 [63].
Paper D: P. E. Strandberg, E. P. Enoiu, W. Afzal, D. Sundmark, and R. Feldt. Information Flow in Software Testing – An Interview Study with Em-bedded Software Engineering Practitioners. In revision.
1A licentiate degree is a Swedish graduate degree halfway between M.Sc and Ph.D. 2The included papers have been reformatted to comply with the thesis layout, appendices
have been moved to the end of the thesis, and some appendices added with respect to the papers as they were published.
Papers not included in thesis
Paper X: P. E. Strandberg, W. Afzal, T. Ostrand, E. Weyuker, and D. Sund-mark. Automated system level regression test prioritization in a nutshell. IEEE Software 2017, 34(4):30-37, 2017 [62].
Paper Y: P. E. Strandberg. Software Test Data Visualization with heatmaps – an Initial Survey. Technical report, Mälardalen Real-Time Research Centre, Mälardalen University, MDH-MRTC-318/2017-1-SE, 2017 [61].
Contents
I Thesis 19
1 Introduction 21
1.1 Personal and Industrial Context . . . 23 1.2 Research Goal and Research Questions . . . 24 1.3 Research Methods . . . 25
2 Related Work 29
2.1 Industrial Software Testing . . . 29 2.2 Communication and Flow of Information . . . 32 2.3 Visualization . . . 33
3 Contributions 35
4 Future Research 39
5 Summary and Conclusions 41
II Included Papers 51
6 Paper A: Experience Report: Automated System Level. . . 53
6.1 Introduction . . . 55
6.2 Related work . . . 56
6.3 Problem Description . . . 57
6.4 The SuiteBuilder Tool . . . 61
6.5 Experimental Evaluation . . . 69
6.6 Discussion . . . 75
6.7 Limitations and Future Research . . . 77
6.8 Conclusions . . . 78
7 Paper B: Automated Test Mapping and Coverage. . . 83
7.1 Introduction . . . 85 7.2 Industrial context . . . 87 7.3 Preliminaries . . . 92 7.4 Related Work . . . 93 7.5 Approach . . . 93 7.6 Experimental Evaluation . . . 105
7.7 Discussion and Conclusions . . . 109
8 Paper C: Decision Making and Visualizations Based on. . . 113
8.1 Introduction . . . 115
8.2 Background and Related Work . . . 116
8.3 Industrial Case Study Design . . . 117
8.4 Results . . . 126
8.5 Discussion . . . 135
8.6 Conclusion . . . 137
9 Paper D: Information Flow in Software Testing. . . 141
9.1 Introduction . . . 143
9.2 Method . . . 145
9.3 Results . . . 149
9.4 Discussion and Related Work . . . 172
9.5 Conclusion . . . 179
III Appendices 185
A Paper C: Interview Questions 187 B Paper C: Questionnaire 189 C Paper C: User Stories 191 D Paper D: Instrument 195 E Paper D: Themes and Sub-themes 199
Part I
Thesis
Chapter 1
Introduction
Embedded systems are becoming ubiquitous. They range from portable sen-sors to communication equipment providing infrastructure, as part of a train or other vehicles, industrial plants or in other applications. As many as 90% of newly produced processors are part of embedded systems [22]. Software failures in communication equipment can lead to isolation of nodes in a vehi-cle or a plant, in turn leading to delays, loss of productivity, or even loss of life in extreme cases. The software in embedded systems needs to be of high quality and software testing is the standard method for detecting shortcomings in quality.
Software testing, or testing, can be defined1 as the act of manually or
au-tomatically inspecting or executing software with or without custom hardware in order to gather information for some purpose: feedback, quality control, finding issues, building trust, or other. An important aspect of testing embed-ded systems is to do testing on real hardware [3, 71]. For some of the testing, emulators and simulators can be suitable, but these should be complemented with physical hardware [53]. This way timing and other non-functional aspects can be verified along with functional correctness. One common approach for testing on real hardware is to build test systems of the embedded devices in network topologies, in order to support testing.
An overwhelming majority of the software testing conducted in industry is manual. Kasurinen et al. found it as high as 90% in a study in Finland in 2010 [33]. A practitioner focused report from 2015 found that only 28% of test cases are automated [58]. If, instead, the tests can run with minimal human in-tervention, considerable gains in test efficiency are possible. Indeed, many
or-1This definition partially overlaps with definitions from both the International Software
Test-ing Qualifications Board (ISTQB) and the ISO/IEC/IEEE 29119-1 standard [30, 67]. Many other definitions exist.
...
Function File Library OS Device Test System Test Env.
Figure 1.1: Abstraction levels: from low level (source code functions) to high (sys-tem) level.
ganizations strive for agile and continuous development processes, where test automation is an important part, and research has been done on how to achieve this [45]. For organizations developing networked embedded systems to be successful in this transition, they would need a number of things in addition to agile processes. First of all, they would need a way to automate testing with a test framework and test cases. Test suites would have to run every now and then. The test framework would have to need to know how to log in, upgrade, and configure the hardware in the test systems. If the organizations develop many different hardware models, they would need several test systems with different sets of hardware. In order to utilize the resources optimally, the test systems might be shared: humans use them by day, and machines run nightly testing when no one is in the office. This way developers and testers could use the test systems for development, fault finding, and manual testing. During the nights the organizations would benefit from potentially massive and broad automated testing. This type of testing, on this high level, could be called au-tomated system level testing in the context of networked embedded systems. This level of abstraction is illustrated in the rightmost parts of Figure 1.1.
Wiklund et al. identified lack of time for testing as an important challenge for test automation [69]. One reason could be that system level testing is slow compared to unit testing, where a function, file or library may be tested (left part of Figure 1.1). A typical test case for networked embedded systems on system level could be a firewall test. This test case would need at least three devices under test (DUTs): a firewall node, an internal node (that is to be protected by the firewall), and an external node (that tries to reach the internal node). Depending on configuration and type of traffic, the outside node should or should not be able to reach the inside node. These test cases need time because they perform several configuration and verification steps, send actual traffic in the network, and the test framework analyzes the traffic sent. Because testing is slow it may not be feasible to run all test cases every night, so the organizations need to decide on which test cases to include in or exclude from their test suites. This problem of regression test selection (RTS, or SL-RTS for System Level RTS) is well studied, but very little previous research has been
done on SL-RTS.
Wiklund et al. also found that low availability of the test environment is an important challenge for test automation [69]. There is thus a need to maximize the value of the testing, given available resources. If a large number of physical test systems are built, and a large number of test cases designed, then one would need a way to assign the hardware resources of the test systems to the test cases, so that as many test cases as possible could run on as many test systems as possible. In this thesis we refer to this process as “mapping” of test cases onto test systems. If there is no automated mapping, then each new test case might trigger a need to build a new test system, which would be expensive and limit the scalability of the testing. Also, in order to maximize the value of the testing, the mapping process should make sure that, over time, each test case utilizes different parts of the hardware in the test systems, such that hardware coverage is increased.
A recent literature study on continuous practices identified that, as the fre-quency of integrations increase, there is an exponential growth of informa-tion [56]. The study also identified a related challenge: lack of awareness and transparency. These organizations would therefore also need a test results database (TRDB) so that engineers, when they come to work in the mornings, can rapidly understand the results of the nightly testing. Log files, trend plots and other information should be readily available. It is therefore important to study and learn from industrial practitioners on how the information flows in their testing processes, and how they make decisions based on visualizations and other support systems enabled by the TRDB.
1.1
Personal and Industrial Context
A large portion of the research in this thesis is qualitative. There is thus a risk for researcher bias where personal background and industrial context could play a role. Here I briefly mention them such that a reader could take this into consideration when reading this thesis.
Before starting as an industrial doctoral student in 2017, I worked for 11 years with software testing, development, and requirements in the rail, nu-clear, web, and communication equipment domains. During the majority of this time I was a consultant, and as such I led a competence network on the topic of software testing for 5 years. In this period of my life, I studied many test and requirements certification syllabi and became a certified tester as well as a certified professional for requirements engineering (ISTQB foundation, ISTQB test manager, ISTQB agile tester, and REQB CPRE Foundation).
I am employed full time at Westermo Research and Development AB (Westermo), where I have worked with test automation and test management. Westermo designs and manufactures robust data communication devices for harsh environments, providing communication infrastructure for control and monitoring systems where consumer grade products are not sufficiently re-silient. These devices and the software in them, WeOS (Westermo Operating System), are tested nightly with the main purpose of finding software regres-sions. In order to test for regressions, a number of test systems build up of DUTs running WeOS have been constructed. Automated test cases have also been implemented, as well as a test framework for running the test cases. I first added code to this framework in 2011, when it was being migrated into what is now its current form. Over time, more and more components have been added to this eco-system for nightly testing, such as the test selection process we de-scribe in Paper A, the test case mapping onto test systems that we dede-scribe in Paper B, and the TRDB that is central to Paper C.
Westermo recently migrated from a development model loosely based on scrum to a feature-driven development model based on kanban, where every feature is developed in isolation from the others in separate code branches, and then merged into a main branch after a risk management process. This increased parallelization of the testing of the branches makes it harder to get resources for nightly testing, and makes the results more sparse, in turn making the test results more complicated to understand.
My background and position at Westermo has given me unique insights in industrial software testing, which may have had an impact on how I have collected and analyzed data.
1.2
Research Goal and Research Questions
In this thesis, we want to describe and improve upon industrial automated sys-tem level software testing of networked embedded syssys-tems. We will focus on three areas.
1.2.1 System-Level Regression Test Selection
Regression test selection is a challenge to many organizations, and much re-search has been published (see 2.1.1 for an overview), but there is a lack of research on system-level regression test selection. Our first research question (RQ) is:
RQ1 What important challenges might an organization have with respect to system level regression test selection in the context of networked embed-ded systems, and how could one implement and evaluate an automated test selection algorithm to address these challenges?
1.2.2 Test Environment Assignment
When test cases for networked embedded systems are to be executed on a physical test system, each test case needs to be mapped onto the available hardware of the test system, and the hardware requirements of the test cases needs to be taken into account. This need leads to the second RQ:
RQ2 How could one improve upon the challenge of test environment assign-ment with respect to automated system level software testing of net-worked embedded systems?
1.2.3 Flow of Information in Software Testing
With increased levels of test automation, there is an increased level of informa-tion being produced. We wish to learn about the informainforma-tion flow in software testing for organizations developing embedded systems, and also learn how a test results database can support making decisions in a variety of scenarios. This leads us to our third RQ:
RQ3 What is the flow of information in software testing, and how does a test results database support decision-making in software development processes?
1.3
Research Methods
In both Paper A and B, we focus on developing algorithms that are evaluated empirically using industrial data. For papers C and D, we have interviewed industrial practitioners and used other data sources in order to describe the state of practice, and to generate theories. In this section, we discuss the methods used in this thesis from the two viewpoints of Methods/Algorithms/Tools and Empirical Studies.
1.3.1 Methods/Algorithms/Tools
Despite being an experience report, the core of Paper A is an algorithm for SL-RTS. This algorithm was developed into a tool that we used for several years at
Westermo, after which we did a quantitative and to some extent also qualitative evaluation. We analyzed challenges highlighted by industrial practitioners (test suites not finishing on time, manual work leading to forgotten tests, and test cases being without concept of priority), as well as aspects seen as important in academia (early fault detection in test suites). This evaluation used industrial data from four years of nightly testing.
In Paper B, we proposed an algorithm for selecting a subset of available hardware given certain requirements – the mapping problem. We created a prototype implementation of it as a tool. We focused on a quantitative evalu-ation with industrial data using 17 test systems and more than 600 test cases for a total of more than ten thousand possible mappings, in order to compare a before/after scenario of the tool.
We designed and implemented a TRDB to store results from nightly testing in 2012. In Paper C we investigated how it is being used to support decision-making at different levels, and in order to do so we obviously needed the tools (the TRDB and the visualizations).
1.3.2 Empirical Studies
Paper A is an experience report, Paper C is a case study, and we call Paper D an interview study. In all of these we did interviews, both informal (Paper A), and very thorough (Papers C and D).
For Papers A and B we used empirical data as part of the quantitative evaluations of the suitability of two tools, whereas the papers C and D had a focus on describing practices and on generating theories.
For conducting interviews, we considered a large number of important guidelines. Kitchenham and Pfleeger published a series of guideline papers [35, 36, 37, 38, 50, 51] that had an influence on, for example, Runeson et al. [54], that in turn has had an influence on for the overall guideline paper that we followed for Paper D: Linåker et al. [40].
The integrity and anonymity of our interviewees was of great importance to us, so for the data collection of Papers C and D we designed a process based on existing ethical guidelines for this [20].
For the data analysis in Papers C and D, we hesitated between grounded theory (for example described by Stol et al. [60]), content analysis (as de-scribed for the field of nursing by Graneheim and Lundman [24]), and the-matic analysis. There is a significant overlap between these methods, and in 2011 Cruzes and Dybå proposed methods for conducting thematic analysis in software engineering [10]. In the end, we followed the recommendations of thematic analysis described for the field of psychology by Braun and Clarke
[7]. We saw this approach as simple and suitable for the type of data we had. We also used scripted reports of raw data as support in the data analysis.
Chapter 2
Related Work
The research fields of software testing, regression test selection, as well as communication and visualization, are all well studied. However, there is a notable gap between academia and industry in these fields – despite mature re-search, an overwhelming majority of the actual testing in the industry is man-ual; test cases are designed based on experience instead of using state of the art methods, and regression test cases are selected with poor methods. Previ-ous work on the role of communication in software engineering and software testing indicate that a requirements specification is of great importance – these are unfortunately typically of poor quality. Despite more than 40 years of re-search on regression test selection there is very little advice on performing it on a system level.
Visualizing software test results rapidly is also an important topic, and several studies on this topic have already been published. In this chapter we also briefly mention work related to the mathematical field of graph theory and the subgraph isomorphism problem – topics related to Paper B.
2.1
Industrial Software Testing
A lot of research has shown that industry seems to be slow to adopt state of the art techniques for software testing. Most testing is done manually, perhaps as much as 90% [33]. Well-defined test design techniques exist, but testers “rely on their own experience more” [29]. The industrial use of issue trackers is sometimes flawed: less than a quarter of organizational units in a study by Kasurinen et al. used issue trackers [33].
On the positive side, companies change over time, and many strive towards using more agile practices, such as shortening feedback loops and adopting
continuous integration [45]. A recent literature study on continuous practices identified that as code integrations become more frequent, the amount of data such as test results will increase exponentially [56]. Therefore it is “critical to collect and represent the information in [a] timely manner to help stakeholders to gain better and easier understanding and interpretation of the results. . . ” There is a need for speeding up continuous integration [59].
The agile movement can coexist with traditional approaches, and they seem to benefit from each other. Notander et al. points out that a “common belief is that agile processes are in conflict with the requirements of safety standards. . . Our conclusion is that this might be the case [sometimes], but not [always]” [43]. Ghanbari came to similar conclusions [23]. A study on com-munication in agile projects suggest that plan-driven approaches are sometimes needed in agile contexts [52].
When it comes to testing of embedded systems, two recent studies high-light that an important aspect is to investigate non-functional qualities such as timing and by testing on real hardware one can achieve this [3, 22].
2.1.1 Regression Test Selection
When organizations move towards nightly testing, and run testing on embed-ded system, they risk ending up with nights that are not long enough – too many test cases and too little time. This is a strong motivator for introducing regression test selection (RTS). A well-cited paper by Yoo and Harman pro-poses three strategies for coping with RTS: Minimization, Selection, and Prior-itization[72]. RTS can be based on many different properties: code coverage [41], expected fault locations [48], topic coverage [27], or historic data such as last execution, fault detection, and coverage data [14, 16, 27, 34]. Mathemat-ical optimization approaches have been used [19, 28, 41], as well as genetic algorithms [68]. Software fault prediction is a related field, where one influen-tial paper was written by Ostrand et al. for traditional software development in large software systems [48]. Elbaum et al. mentions that traditional regression testing techniques that rely on source code instrumentation and availability of a complete test set become too expensive in continuous integration development environments, partly because of the high frequency of code changes [14].
We identified four recent surveys on RTS, none of which is applicable to SL-RTS. The most recent one, from 2016 by Hao et al. mentions that most techniques have been evaluated with programs smaller than 6 kSLOC (SLOC = source lines of code) [25]. This is still very far from common for many embedded systems (where using the Linux kernel alone results in a code base in the order of 10 MSLOC.) Second, Catal and Mishra found that the
inating techniques for RTS are coverage based [9], , and these are thus not applicable to system level software testing due to the instrumentation required. The third survey, by Yoo and Harman, discuss a design-based approach to run what seems to be unit-level test cases: “Assuming that there is traceability be-tween the design and regression test cases, it is possible to perform regression test selection of code-level test cases from the impact analysis of UML design models” [72]. We speculate that this type of traceability is not so common in industrial agile environments. Finally, Engström et al. published a paper in 2010 in which they investigated 28 techniques, where 14 were on statement level, the others were no higher than module level [17].
A conclusion is that there has not been much prior work on SL-RTS, and that most known RTS methods will not work on a system level because its need for access to source code and source code instrumentation. In our research, we have built upon the existing body of knowledge in the field of RTS and shown feasibility of SL-RTS by using a framework of prioritizers that each investigate some priority-giving aspect (such as time since last execution), a heuristic to circumvent the need for source code access, and a priority merging process to come up with a priority for each test case (Paper A).
2.1.2 Test Environment Assignment
The body of knowledge with respect to assigning test environments to test cases for execution seems to be in its infancy. While submitting Paper B, we were made aware of research by Kaindl et al. who investigate the same high level. In their paper they “briefly sketch the technical essence of [their] project” explaining that they plan to use a semantic specification, an ontology, and a taxonomy to assign test environments to a test case [32]. As far as we know, our paper is the only publication that has a working solution for this problem in our domain.
In Paper B, we investigate “the mapping problem,” discuss this problem and how this is related to the subgraph isomorphism problem. The subgraph isomorphism problem is a well studied topic in the field of graph theory, and much of the basic terminology is covered in books such as [70]. There are a number of approaches to solving the subgraph isomorphism problem: satisfi-ability, for example, is covered by both Knuth and Ullman [39, 66]. Another approach is to do a combinatorial search, such the one described by Bonicci et al. [5]. In the test cases and test systems at Westermo, there are frequently cycles. If there is a cycle in a test case, then this must be mapped onto a cycle in a test system. Algorithms for identifying cycles are therefore of importance for improving the mapping, e.g. work by Paton, or Yuster and Zwick [49, 73].
Source
Message
Transmitter Receiver Destination
Signal Signal
(received)
Noise Source
Message (received)
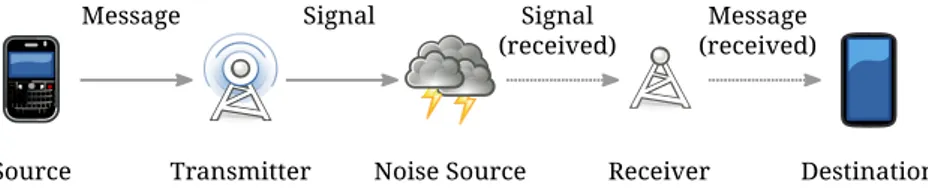
Figure 2.1:The Shannon-Weaver communication model.
2.2
Communication and Flow of Information
In a 60 year old publication, [57], Shannon first described what would later be known as the Shannon-Weaver model of communication, shown in Figure 2.1. This model has later been built upon to represent countless variants. It contains an information source converted into a message that a transmitter converts to a signal, noise is added to the signal from a noise source. The signal and message then reach the destination. Later research on this model add, among other things, medium used, as well as the role of distances.
Information flow has an important overlap with the concept of communi-cation, it can be defined by a distributed system of agents and the relationships between them. Information flow is important when a synergy between humans and software systems is required for a work flow [13].
A theory for distances in software engineering “explains how practices improve the communication within a project by impacting distances between people, activities and artifacts” [4]. As an example, the practice of Cross-Role Collaborationhas an impact on the temporal distance. Olson and Olson found that new technology may make geographical distance smaller, making cultural distances appear to be greater [44]. They also found that modern communica-tion media frequently relies on technical solucommunica-tions, such as a conference phone, and when there are usability problems, the users adapted their behavior instead of fixing the technology – by shouting in the conference phone.
The requirements specification is the most important document for testers during system testing, but this document is often of poor quality [29], and is one of the main sources of technical debt for safety development [23]. Human factors and the quality of the requirements specifications were also mentioned in a qualitative interview study “as essential for development of safety critical systems” [43]. Furthermore, the Annex E of the first part of the ISO/IEC/IEEE 29119 standard acknowledges that testers need to communicate, with vari-ous stakeholders, in a timely manner, and that this communication may be more formal (written based on reports) or oral (for example in agile
ment regimes) [30]. Similarly, the International Software Qualifications Board, ISTQB, released their syllabus for certification of test automation engineers [2] in 2016. It covers topics that frequently occurred in our interviews in Paper D. They recommend that one should: measure benefits of automation (costs are easily seen), visualize results, create and store logs from both the system under test and the test framework, and generate reports after test sessions.
In Papers C and D, we extend the body of knowledge in the field of com-munication and information flow in software engineering with results from a case study conducted at Westermo on how decisions are made based on test re-sults, and with results from an interview study conducted at five organizations taking a holistic approach to the flow of information in software testing.
2.3
Visualization
According to Diehl, there are three important aspects of software visualization: structure, behavior and evolution [12]. An early visualization technique to show structure is from 1958 and generated control-flow diagrams because it “is not practical to expect [everyone] to be intimately familiar with [all code]” [55]. Visualizations may not only show structure but also compare structures. One survey on software visualization, present methods for visualizing static aspects with the focus of source code lines, class metrics, relationships, and architectural metrics [8].
An important publication from 2002 use test results data with a combina-tion of source code, code coverage, unit tests and test results in a sort of ex-tended Integrated Development Environment (IDE) view [31]. A dashboard is a common approach for quality monitoring and control in the industry. These aim at presenting one or more key performance indicator (KPI) over time [11, 21]. Recent studies on visualizing test results show that: there is a need for summaries [42], information may be spread out in several different systems [6], one might need to consider transitions between different views of a test results visualization tool [46], and that visualizations may target man-agers, experts, testers and code maintainers, with the purpose of giving early warnings, suggestions for code improvements, planning support and support for making decisions [61].
In his keynote at the practitioner-oriented conference Beauty in Code 2018 [1], Bach highlighted that stakeholders do not know what to visualize: “What I had to do, is use my skill as a tester, and my interest in visual design, and complexity, and displays, and statistics, to try to come up with something, that they, when they saw it – it would be like someone seeing an iPhone for the first time, they would say ‘I used to like Nokias and now I like Apple phones’.” We
see this as support for findings in Paper D, that visualizations is not prioritized and the individuals skilled in other domains end up being the one preparing visualizations.
With respect to the body of knowledge in the field of visualization of soft-ware test results, we confirm some of the previous work (such as the impor-tance of visualizations, and the need to consider transitions between views); we also provide a long term case study of the implementation and usage of test results visualization and decision making, as well as show the importance of the TRDB.
Chapter 3
Contributions
In this thesis, we have investigated test selection, test environment assignment and the flow of information in software testing. In Paper D, we focused on the overall flow of information in software testing. A central result of this study is the flow diagram in Figure 3.1 and the contributions of this thesis fit well in it. Both test selection and test environment assignment can be seen as processes having an impact on how we do system testing in the test environment. The role of the test results database has, in one way, an importance after the testing (e.g. to aid in reporting), but because it may impact coming test selection and the coming test environment assignment, it also has an importance before the testing activity.
In Paper A, we identified three challenges with nightly regression testing: nightly testing did not finish on time, manual work and omitted tests, and no priority for the test cases. These problems were solved by implementing Suite-Builder, a framework of prioritizers that assign priorities based on multiple factors. The algorithm was evaluated quantitatively using data from four years of nightly testing, as well as qualitatively with interview data. When using the SuiteBuilder, we found that test suites finish on time, and that two thirds of the failing tests are now positioned in the first third of the test suites. The main contribution of this work is the system-level regression test selection, and an implementation that solves these three problems in our industrial context.
When performing testing of embedded systems, it is critical to also involve real hardware, and in Paper B we show a way to map a test case onto a test system using graph theory. As far as we know, there has been no prior evalu-ated solution in in the domain of networked embedded devices. Our approach was to use the graph models of the test systems and test cases, and adapt the subgraph isomorphism problem to our domain. We evaluated the prototype implementation quantitatively with the available test systems and test cases for
Dev. (1) Req. PM TL Desk (2) HW (3) Test (4) Test env. (5) System test
Process/Gate (6) External testing
TRDB
"void"
Figure 3.1:Flow of Information in Software Testing.
more than 10000 different pairs of graphs. The new tool was more than 80 times faster than the old one. Also, by using a TRDB with previous mappings, the algorithm could map in different ways over time. This way the DUT cov-erage grew from a median of 33% for the 10000 pairs, to a median of 100% in just five iterations.
A TRDB plays a central role in the testing of embedded systems, both for its use in regression test selection, and also for the flow of information in software testing. In Paper D, we show that this is not just a phenomenon at Westermo – a test results database is central in advanced automated testing, and in giving support for making decisions. In this paper, we conducted in-terviews1 at five companies developing embedded systems. The qualitative
thematic analysis of the 17 hours of audio and 130 pages of transcriptions re-vealed that TRDB was the 18th most discussed sub-theme (of 86 in total, see
Appendix E). This study also identified six themes of importance to the flow of information in software testing (testing and troubleshooting, communication, processes, technology, artifacts, and organization), seven challenges (details of testing, root cause identification, poor feedback, postpone testing, poor arti-facts and traceability, poor tools and test infrastructure, and distances), as well
1In this thesis, we have included Appendices D and E containing the questionnaire as well
as the themes and sub-themes identified during this study. These appendices were not in the original paper.
as five good approaches for improved information flow (close collaboration between roles, fast feedback, custom test report automation, test result visual-ization, as also tools and frameworks). As far as we know, this is the first study taking a high level approach to the flow of information in software testing.
Paper C is on a similar topic as Paper D, in it we describe how the decision process is carried out at Westermo in daily work, when merging a branch with the main code branch, and at release time. We collected data from interviews, questionnaires, archives, and through participant observations, for a system that has been in use for six years. We were able to describe how visualizations and scripted reports support decision making, the perceived value of these, and important requirements in the form of user stories for continued work on the TRDB and the visualizations. In this thesis, we include Appendix C with the most important user stories (this appendix was not in the original paper). As far as we know, this is the first publication where a long-term evaluation has been done on test results visualization or decision-making based on test results.
Chapter 4
Future Research
As future research, we want to propose a design for, implement, and evaluate any benefits of an improved test results communication, visualization, and ex-ploration solution. It should visualize test results in ways suitable for a range of stakeholders – it should in particular make the lives of software developers easier by showing failure patterns that simplifies decision making processes.
We note that several publications related to heatmaps or test results visual-ization have been published recently, for example: [6, 15, 18, 26, 42, 46, 47] and also Paper Y [61]. A careful reading of the advantages and disadvan-tages of these approaches is probably a well invested time. Paper C and Pa-per D should also provide insights valuable to this work.
Furthermore, the process improvements described in Paper A and Paper B: not always running all test cases, running them in a varying order, and not al-ways running a test case on the same hardware in a test system, may render decision making harder when compared to always running the same tests in the same order on the same hardware. These changes may thus cause addi-tional challenges for test results exploration. These effects could be further investigated.
Another area of research that could be seen as related to visualizing test results as well as making decisions is “flaky tests” – test cases that have an intermittent fail pattern. These are costly to debug and based on how an engi-neer would investigate test results, it might not be obvious that a test is “flaky”. Perhaps visualizations of various types of test data could aid in the debugging of these test cases?
Chapter 5
Summary and Conclusions
In this thesis, we have presented challenges, and their solutions, with conduct-ing testconduct-ing and when understandconduct-ing test results, in the context of automated system level software testing of networked embedded systems. Two exam-ples of challenges are: (i) selecting test cases and (ii) mapping test cases onto test systems. We also investigated the role of the test results database as an enabler for test results visualization, as well as its central role in the flow of information in software testing.
In this thesis, we have found that automated system level software testing of networked embedded systems in some cases brings the same challenges as testing at lower abstraction levels do, e.g. test selection, test results visualiza-tion and for the flow of informavisualiza-tion in software testing. However, this type of testing also brings unique challenges in that test mappings now play an impor-tant role. Similarly, we want to emphasize the role of the test results database as an enabler in this context. We have described and evaluated tools for test selection as well as mapping test cases onto test systems, as well as gathered knowledge from practitioners in an extensive interview study.
The findings from these studies may guide other industrial practitioners when implementing their own tools and processes. This thesis also bring prob-lems to the surface (such as the challenge of allocating hardware for a test case), some of which may be new to academia, thus making future research possible.
As we highlighted in Chapter 2, there is a lot of related work already done, in particular when it comes to regression test selection. However, not much ad-vice has been published for system level regression testing. The field of com-munication, starting with the Shannon-Weaver model, is also tremendously well studied. There are also a number of studies published on test results visu-alizations. However, for the flow of information in software testing, there are,
as far as we can tell, no previous studies. In particular, the flow of information in software testing has never been studied from a holistic perspective: there are many studies in several isolated dimensions, and we made an interview study that aims at tying all the flows together.
All research has limitations, and many of the findings described in this thesis could be enhanced by repeating the studies in additional organizations and domains, or by using more data (more interviewees, more industrial test results, etc.).
Bibliography
[1] J. Bach. Beauty or bugs: Using the blink oracle in testing. https://www.youtube.com/watch?v=5W_VLzNhT-s, March 2018. Keynote at the Beauty in Code Conference, Malmö, Sweden 2018. [2] B. Bakker, G. Bath, A. Born, M. Fewster, J. Haukinen, J. McKay, A. Poll-ner, R. Popescu, and I. Schieferdecker. Certified tester advanced level syllabus test automation engineer. Technical report, International Soft-ware Testing Qualifications Board (ISTQB), 2016.
[3] A. Banerjee, S. Chattopadhyay, and A. Roychoudhury. On testing em-bedded software. Advances in Computers, 101:121–153, 2016.
[4] E. Bjarnason and H. Sharp. The role of distances in requirements com-munication: A case study. Requirements Engineering, 22(1):1–26, 2017. [5] V. Bonnici, R. Giugno, A. Pulvirenti, D. Shasha, and A. Ferro. A sub-graph isomorphism algorithm and its application to biochemical data. BMC bioinformatics, 14(7):S13, 2013.
[6] M. Brandtner, E. Giger, and H. Gall. Supporting continuous integra-tion by mashing-up software quality informaintegra-tion. In Software Evoluintegra-tion Week – IEEE Conference on Software Maintenance, Reengineering and Reverse Engineering (CSMR-WCRE), pages 184–193. IEEE, 2014. [7] V. Braun and V. Clarke. Using thematic analysis in psychology.
Qualita-tive research in psychology, 3(2):77–101, 2006.
[8] P. Caserta and O. Zendra. Visualization of the static aspects of software: A survey. IEEE transactions on visualization and computer graphics, 17(7):913–933, 2011.
[9] C. Catal and D. Mishra. Test case prioritization: A systematic mapping study. Software Quality Journal, 21(3):445–478, 2013.
[10] D. S. Cruzes and T. Dybå. Recommended steps for thematic synthesis in software engineering. In International Symposium on Empirical Software Engineering and Measurement (ESEM), pages 275–284. IEEE, 2011. [11] F. Deissenboeck, E. Juergens, B. Hummel, S. Wagner, B. M. y Parareda,
and M. Pizka. Tool support for continuous quality control. IEEE soft-ware, 25(5):60–67, 2008.
[12] S. Diehl. Past, present, and future of and in software visualization. In Computer Vision, Imaging and Computer Graphics - Theory and Appli-cations (VISIGRAPP), pages 3–11. Springer, 2014.
[13] C. Durugbo, A. Tiwari, and J. R. Alcock. Modelling information flow for organisations: A review of approaches and future challenges. Inter-national Journal of Information Management, 33(3):597–610, 2013. [14] S. Elbaum, G. Rothermel, and J. Penix. Techniques for improving
re-gression testing in continuous integration development environments. In International Symposium on Foundations of Software Engineering (FSE), pages 235–245. ACM, 2014.
[15] E. Engström, M. Mantylä, P. Runeson, and M. Borg. Supporting re-gression test scoping with visual analytics. In International Conference on Software Testing, Verification and Validation (ICST), pages 283–292. IEEE, 2014.
[16] E. Engström, P. Runeson, and A. Ljung. Improving regression testing transparency and efficiency with history-based prioritization–an indus-trial case study. In International Conference on Software Testing, Verifi-cation and Validation (ICST), pages 367–376. IEEE, 2011.
[17] E. Engström, P. Runeson, and M. Skoglund. A systematic review on re-gression test selection techniques. Information and Software Technology, 52(1):14–30, 2010.
[18] R. Feldt, M. Staron, E. Hult, and T. Liljegren. Supporting software deci-sion meetings: Heatmaps for visualising test and code measurements. In Euromicro Conference on Software Engineering and Advanced Applica-tions (SEAA), pages 62–69. IEEE, 2013.
[19] K. F. Fischer. A test case selection method for the validation of software maintenance modifications. In International Conference on Computers, Software & Applications (COMPSAC), pages 421–426, 1977.
[20] Forskningsrådet. Forskningsetiska principer i humanistisk-samhälls-vetenskaplig forskning, 1996.
[21] M.-E. Froese and M. Tory. Lessons learned from designing visualization dashboards. IEEE Computer Graphics and Applications, 36(2):83–89, 2016.
[22] V. Garousi, M. Felderer, Ç. M. Karapıçak, and U. Yılmaz. What we know about testing embedded software. IEEE Software, 35(4):62–69, 2017. [23] H. Ghanbari. Seeking technical debt in critical software development
projects: An exploratory field study. In Hawaii International Conference on System Sciences (HICSS), pages 5407–5416. IEEE, 2016.
[24] U. H. Graneheim and B. Lundman. Qualitative content analysis in nurs-ing research: concepts, procedures and measures to achieve trustworthi-ness. Nurse Education Today, 24(2):105–112, 2004.
[25] D. Hao, L. Zhang, and H. Mei. Test-case prioritization: achievements and challenges. Frontiers of Computer Science, 10(5):769–777, 2016. [26] N. H. Haron and S. M. Syed-Mohamad. Test and defect coverage
ana-lytics model for the assessment of software test adequacy. In Malaysian Software Engineering Conference (MySEC), pages 13–18. IEEE, 2015. [27] H. Hemmati, Z. Fang, and M. V. Mantylä. Prioritizing manual test cases
in traditional and rapid release environments. In International Confer-ence on Software Testing, Verification and Validation (ICST), pages 1–10. IEEE, 2015.
[28] K. Herzig, M. Greiler, J. Czerwonka, and B. Murphy. The art of testing less without sacrificing quality. In International Conference on Software Engineering (ICSE), pages 483–493. IEEE, 2015.
[29] T. Illes-Seifert and B. Paech. On the role of communication, docu-mentation and experience during system testing – an interview study. In PRIMIUM Subconference at the Multikonferenz Wirtschaftsinformatik (MKWI), 2008.
[30] ISO/IEC/IEEE. Software and systems engineering – software testing – part 1: Concepts and definitions. ISO/IEC/IEEE Standard 29119-1:2013, International Organization for Standardization, International Electrotech-nical Commission, Institute of Electrical and Electronics Engineers, 2013.
[31] J. A. Jones, M. J. Harrold, and J. Stasko. Visualization of test informa-tion to assist fault localizainforma-tion. In Internainforma-tional Conference on Software Engineering (ICSE), pages 467–477. ACM, 2002.
[32] H. Kaindl, F. Lukasch, M. Heigl, S. Kavaldjian, C. Luckeneder, and S. Rausch. Verification of cyber-physical automotive systems-of-systems: Test environment assignment. In International Conference on Software Testing, Verification and Validation Workshops (ICSTW). IEEE, 2018.
[33] J. Kasurinen, O. Taipale, and K. Smolander. Software test automation in practice: empirical observations. Advances in Software Engineering, 2010(ID 620836):18 pages, 2010.
[34] J.-M. Kim and A. Porter. A history-based test prioritization technique for regression testing in resource constrained environments. In Inter-national Conference on Software Engineering (ICSE), pages 119–129. ACM, 2002.
[35] B. A. Kitchenham and S. L. Pfleeger. Principles of survey research: part 3: constructing a survey instrument. ACM SIGSOFT Software Engineer-ing Notes, 27(2):20–24, 2002.
[36] B. A. Kitchenham and S. L. Pfleeger. Principles of survey research part 4: Questionnaire evaluation. ACM SIGSOFT Software Engineering Notes, 27(3):20–23, 2002.
[37] B. A. Kitchenham and S. L. Pfleeger. Principles of survey research: part 5: populations and samples. ACM SIGSOFT Software Engineering Notes, 27(5):17–20, 2002.
[38] B. A. Kitchenham and S. L. Pfleeger. Principles of survey research part 6: data analysis. ACM SIGSOFT Software Engineering Notes, 28(2):24–27, 2003.
[39] D. Knuth. Fascicle 6: Satisfiability, volume 19 of the art of computer programming, 2015.
[40] J. Linåker, S. M. Sulaman, R. M. de Mello, M. Höst, and P. Rune-son. Guidelines for conducting surveys in software engineering. Techni-cal Report Department of Computer Science, Lund University, Sweden, 2015.
[41] D. Mondal, H. Hemmati, and S. Durocher. Exploring test suite diversi-fication and code coverage in multi-objective test case selection. In In-ternational Conference on Software Testing, Verification and Validation (ICST), pages 1–10. IEEE, 2015.
[42] A. Nilsson, J. Bosch, and C. Berger. Visualizing testing activities to sup-port continuous integration: A multiple case study. In International Con-ference on Agile Software Development (XP), pages 171–186. Springer, 2014.
[43] J. P. Notander, M. Höst, and P. Runeson. Challenges in flexible safety-critical software development–an industrial qualitative survey. In Inter-national Conference on Product Focused Software Process Improvement (PROFES), pages 283–297. Springer, 2013.
[44] G. M. Olson and J. S. Olson. Distance matters. Human-computer inter-action, 15(2):139–178, 2000.
[45] H. H. Olsson, H. Alahyari, and J. Bosch. Climbing the "stairway to heaven" – a mulitiple-case study exploring barriers in the transition from agile development towards continuous deployment of software. In EU-ROMICRO Conference on Software Engineering and Advanced Applica-tions (SEAA), pages 392–399. IEEE, 2012.
[46] R. Opmanis, P. Kikusts, and M. Opmanis. Visualization of large-scale application testing results. Baltic Journal of Modern Computing, 4(1):34, 2016.
[47] A. Orso, J. Jones, and M. J. Harrold. Visualization of program-execution data for deployed software. In Symposium on Software visualization (SoftVis), pages 67–ff. ACM, 2003.
[48] T. J. Ostrand, E. J. Weyuker, and R. M. Bell. Predicting the location and number of faults in large software systems. IEEE Transactions on Software Engineering, 31(4):340–355, 2005.
[49] K. Paton. An algorithm for finding a fundamental set of cycles of a graph. Communications of the ACM, 12(9):514–518, 1969.
[50] S. L. Pfleeger and B. A. Kitchenham. Principles of survey research: part 1: turning lemons into lemonade. ACM SIGSOFT Software Engineering Notes, 26(6):16–18, 2001.
[51] S. L. Pfleeger and B. A. Kitchenham. Principles of survey research part 2: designing a survey. Software Engineering Notes, 27(1):18–20, 2002. [52] M. Pikkarainen, J. Haikara, O. Salo, P. Abrahamsson, and J. Still. The
impact of agile practices on communication in software development. Empirical Software Engineering, 13(3):303–337, 2008.
[53] P. Rosenkranz, M. Wählisch, E. Baccelli, and L. Ortmann. A distributed test system architecture for open-source iot software. In Workshop on IoT challenges in Mobile and Industrial Systems (IoT-Sys), pages 43–48. ACM, 2015.
[54] P. Runeson, M. Höst, A. Rainer, and B. Regnell. Case study research in software engineering: Guidelines and examples. John Wiley & Sons, 2012.
[55] A. E. Scott. Automatic preparation of flow chart listings. Journal of the ACM (JACM), 5(1):57–66, 1958.
[56] M. Shahin, M. A. Babar, and L. Zhu. Continuous integration, delivery and deployment: A systematic review on approaches, tools, challenges and practices. IEEE Access, 5:3909–3943, 2017.
[57] C. E. Shannon. A mathematical theory of communication. The Bell system Technical Journal, 27, 1948.
[58] H. Sogeti, Capgemini. World quality report 2014-2015. Technical report, 2015.
[59] H. Spieker, A. Gotlieb, D. Marijan, and M. Mossige. Reinforcement learning for automatic test case prioritization and selection in continuous integration. In International Symposium on Software Testing and Analy-sis (ISSTA), 2017.
[60] K.-J. Stol, P. Ralph, and B. Fitzgerald. Grounded theory in software engi-neering research: a critical review and guidelines. In International Con-ference on Software Engineering (ICSE), pages 120–131. ACM, 2016. [61] P. E. Strandberg. Software test data visualization with heatmaps.
Tech-nical Report MDH-MRTC-318/2017-1-SE, April 2017.
[62] P. E. Strandberg, W. Afzal, T. Ostrand, E. Weyuker, and D. Sundmark. Automated system level regression test prioritization in a nutshell. IEEE Software 2017, 34(1):1–10, April 2017.
[63] P. E. Strandberg, W. Afzal, and D. Sundmark. Decision making and visu-alizations based on test results. In International Symposium on Empirical Software Engineering and Measurement (ESEM), 2018.
[64] P. E. Strandberg, T. J. Ostrand, E. J. Weyuker, D. Sundmark, and W. Afzal. Automated test mapping and coverage for network topologies.
In International Symposium on Software Testing and Analysis (ISSTA), pages 73–83. ACM, 2018.
[65] P. E. Strandberg, D. Sundmark, W. Afzal, T. J. Ostrand, and E. J. Weyuker. Experience report: Automated system level regression test pri-oritization using multiple factors. In International Symposium on Soft-ware Reliability Engineering (ISSRE), pages 12–23. IEEE, 2016. [66] J. R. Ullmann. Bit-vector algorithms for binary constraint satisfaction
and subgraph isomorphism. Journal of Experimental Algorithmics (JEA), 15:1–6, 2010.
[67] E. van Veenendaal. Standard glossary of terms used in software testing. Technical Report Version 2.3, International Software Testing Qualifica-tions Board (ISTQB), 2014.
[68] K. R. Walcott, M. L. Soffa, G. M. Kapfhammer, and R. S. Roos. Timeaware test suite prioritization. In International Symposium on Soft-ware Testing and Analysis (ISSTA), pages 1–12. ACM, 2006.
[69] K. Wiklund, S. Eldh, D. Sundmark, and K. Lundqvist. Impediments for software test automation: A systematic literature review. Software Testing, Verification and Reliability, 27(8):e1639, 2017.
[70] R. J. Wilson. Introduction to Graph Theory, 5th Edition. Prentice-Hall, 2010.
[71] W. H. Wolf. Hardware-software co-design of embedded systems. Pro-ceedings of the IEEE, 82(7):967–989, 1994.
[72] S. Yoo and M. Harman. Regression testing minimization, selection and prioritization: a survey. Software Testing, Verification and Reliability, 22(2):67–120, 2012.
[73] R. Yuster and U. Zwick. Finding even cycles even faster. SIAM Journal on Discrete Mathematics, 10(2):209–222, 1997.