A fossil fuel free Europe needs new incentives and a better control to
balance power production and demand
Erik Dahlquist, Fredrik Wallin, Björn Karlsson Mälardalen University, Vasteras, Sweden
Abstract: In EU27 today there is a production of approximately 1000 TWh/ electric power from
nuclear and 350 TWh/y from hydro power. The solar power potential is probably around 200 TWh/y. The wind power production is approximately 100 TWh/y but with a potential of at least 1000 TWh/y. The total biomass resources available are in the range 8500-12000 TWh/y. This gives a total of 10 000 – 15 000 TWh/y, from which at least 4000 TWh/y as electric power. This can be compared to the present gross energy use in EU 27 that was 16 084 TWh 2009, and 3400 TWh/y electric power. We can also see that there is a potential to save approximately 4 200 TWh/y in households, offices, transportation and industry. The energy balance thus should be possible to obtain with only non-fossil energy resources. Another matter is the power in time and by region. The demand does not always match the production locally at each moment and this demands a robust transmission and distribution network. Therefore we need new business models making it attractive for the users to reduce the load when there is a difficulty to deliver.
Key words: Balances, energy, power, EU Introduction:
In Europe there is a political decision to strive for being fossil fuel independent as soon as possible. This is for both global warming as well as economic reasons. Today EU27 is strongly depending on an imported resource, which can be problematic as this becomes scarce in the future.
If we then instead can change over to use renewable energy these problems can be overcome. Aside of replacing the fossil fuels with renewable energy we also need to reduce the “consumption” of energy. As this is normally the most economic action it is also very interesting for the competitiveness of EU27 in the future.
In this paper we discuss both the available renewable energy resources, as well as the potential to reduce the energy utilization, and especially the use of electric power. We also discuss different incentives for reducing the consumption as well as for production of electricity without utilising fossil fuels.
Energy consumption patterns
In EU27 the distribution between different uses of energy is as seen in the table 1 below. The primary energy used to produce this i 16 084 TWh/y according to Eurostat [2010]. As can be seen the single most important use from a quantitative point of view is transportation. This includes both personal transportation and goods. Transportation also is the type of use consuming most fossil fuels. The second largest use is in industry. House hold and service is to a large extent related to heating and cooling of buildings. It is not uncommon that persons with principally the same family situation in neighbouring apartments, with the same amount of people, have differences in consumption with a factor 5-10 times! By reducing energy per household to a level where those using least energy would bring down the total consumption by up to 50 %, if we just look at household electricity and hot water. For heating or cooling purpose, new technologies are needed and significant capital investments.
Table 1. For EU27, 2007. Eurostat figures for final energy “consumption” in TWh/year. TWh/year Industry 3755 Transportation 4388 Households 3310 Agriculture 323 Service etc 1689 Total 13465
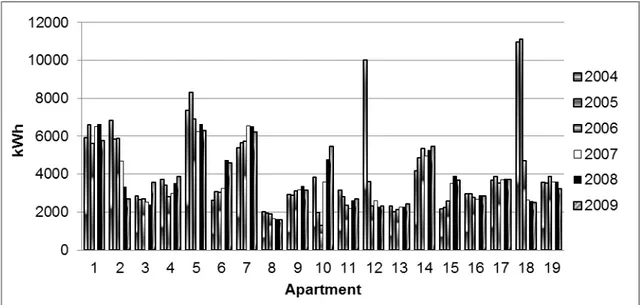
In figure 1 below we see some examples from Swedish households. It is from 19 apartments in two buildings in Vasteras, all with two grown-ups in each apartment. In table 2 we also see the highest and lowest consumption during 2004 – 2009. A questionnaire was sent to the originally 24 apartment owners, although only 19 were answering, and thus are presented in the figure.[ Vassileva et al 2010a,2010b]
Figure 1. Electricity consumption in 19 apartments during 2004 – 2009.
During 2004 – 2005 we see a five fold difference in consumption while it is slightly lower ,
approximately 4 times, during 2006- 2009. From the questionnaires we can see that it is not
that easy to identify exactly what is consuming so much energy. It differes between the high
consumers. One common feature still seems to be that those who can afford it consumes more
than those having a bit lower household incomes. This may sound logical, but it is also
interesting to note that those who are most interested in energy savings are those consuming
most. This also may be logical, but also promising, as here we have the highest potential. As it
is also those having best economic situation, they can afford buying more efficient appliances.
In figure 2 we see the heating for offices as a function of outdoor temperature [Kvarnström et al 2006]. These values are for several thousand offices and commercial buildings at central- southern part of Stockholm. It is interesting to see that the heat demand is higher during week days (red) when there are people and computers giving heat compared to week-ends (black) when neither heat source normallyare present. Logically it should be a lower need during week days when every person will give 100 W of heat and each computer roughly the same. The conclusion is that we ventilate so much that we cool the buildings and this gives an increased heat demand. With a better control of the ventilation the heat demand could be reduced with some 30-40 % according to the figures seen here.
Figure 2. Consumption of heat (kW/kWmax*100) as a function of outdoor temperature in offices in
Stockholm city week days (red) respectively week-ends (black).
In other cases we get too much heat due to heating through windows summer time or cooling through poor insulation or leakages winter time. By improving these functions it would be possible to reduce the energy demand from in the range 150- 250 kWh/m2, year to < 50 kWh/m2,year for heating the buildings.
In figure 3 we can see how the energy is used for different purposes in EU homes. Roughly 60 % at an average is used for heating, and here the potential savings as shown above could be relevant. This means a potential reduction by some 60%*(1-(50/200))= 45 % of the total household energy if we extrapolate from the discussion from Sweden above. This would mean some 3310 *0.45 = 1490 TWh/y. On the other hand we buy more and more electric apparatus, but hopefully they will be more and more efficient.
Out door temp
Figure 3 Break down of household energy for EU-countries 2005 from Bosseboeuf [2009]
One factor of very high importance for electricity consumption is the lightning. By replacing wire lamps and fluorescence lamps with LED-lamps we could save some 100- 150 TWh/y, depending on the time the lights are on. There are no exact figures for this, but as we can see from figure 4 lightning is approximately 10-15 % of all energy use in households, and it is even higher in offices and services. Generally LED lamps will consume 50% of the corresponding fluorescence lamp, and 10% of the wire lamp. As the wire lamps still are 30 % of all lamps, the reduction figures above can be reasonable. Another aspect that is important for us all is the wasting of food. Investigations in the UK indicate some 30% wasting, while some Swedish investigations indicate 10-20%, but probably 20% is more correct. If we can reduce the wasting by better logistics and control of the storage this could probably reduce the energy consumption by some 10%. This would mean some 150-200 TWh/y, as the energy in the food is approximately 1000- 1300 TWh/y + 500- 650 TWh/y for the production, or 1500- 1950 TWh/y altogether.
If heating is the most costly factor in northern Europe, cooling is it in southern Europe. Ecoheatcool [2006] has tried to estimate consumption of cooling in 32 countries and came to 560 TWh/y in the service sector and 810 TWh/y in the residential sector, or 1370 TWh/y totally. This shows that a significant portion of the electricity used in EU27 actually is for cooling the buildings. Here we can see a potential to use co-generation to produce electricity and cooling simultaneously, just like we do with heat and electric power in northern Europe today. This would reduce the peak electric power need when it is very hot, just like we can reduce peak electric power need in northern Europe when it is very cold when we use district heating instead of electric heating systems.
Sometimes it is just of interest to transfer a load from day to night, and concerning e.g. charging electric vehicles or heating buildings, this can be done if we have economic incentives to drive this. Also refrigerators could be shut off for some hours when there is a peak demand for power. We will discuss different incentives later in this paper. Still, we have identified a potential to relocate at least 30 TWh/y out of approximately 150 TWh/y in Sweden, which if we look at the peak power would be even more percentage wise. By relocating demands, complementing electric use by other technologies like absorption heat pumps and district heating with electric power in co-generation, or even pellet burners and similar, we can also reduce the peak power levels due to climatic effects.
Transportation
For transportations the higher price on oil products is giving a significant incentive to reduce consumption, but here also the global warming warnings are making the authorities increasing taxes as well. Another tool is subsidies for “fossil fuel free alternatives” like electric vehicles, although this demands fossil fuel free electricity production as well.
According to ACEA, European Automobile Manufacturer´s Association [2011] 87 % of the cars are private cars.63.8 % are having gasoline-engines, 33.7 % diesel and 2.7 % others. The power has gone up from 60 to 85 kW at an average between 1990 and 2008, but is now slightly lower, 83 kW in 2010. This is the status of today.
In a report Enerdata [2009] present different scenarios for oil consumption and renewables for transportation. For 2007 we have a base consumption of 58.8 g oil/km, 2010 55.6 g oil/km. For plug-in-hybrids this is given to be 27.1 g oil equivalents/km, from which 18.2 as oil, the rest as electricity. For pure electric vehicle the assumption is 12.1 g oil equivalents/km.
The total “road consumption” for EU 27 then would be 292 Million ton oil equivalents (Mtoe) from which cars 167 and light trucks 42. In their base scenario the total consumption would still be 284 Mtoe 2030, but where they believe it could be possible to reduce the total consumption to 237 Mtoe, from which 16 Mtoe from electric and 16 Mtoe from bioenergy + hydrogen.
We believe these figures are far too conservative. Instead there should be only plug-in-hybrids and electrical vehicles by 2030. When the new technology has been accepted it will take over totally, as it will reduce the cost for fuel significantly. As approximately 70% of the travels are shorter than 50 km we can assume 70% electric and 30% fossil fuel of all travels. This would mean 292 * (0.7*12/58.8 + 0.3 *27/58.8) = 82 Mtoe 2030, and the actual fuel then should have biomass origin and not oil. The biomass can be converted to biogas, ethanol, bio-diesel or similar. This means a reduction from approximately 2920 TWh/y to 820 TWh/y for transportations related to personal transport (- 72%). The transportation of goods will be a bit more difficult to reduce as far, but the potential should be at least some 30-40 %, if more transportation is done using rail transports and new plug-in-hybrids also for trucks. In figure 4 we can see the electric truck ELIS produced by ASEA (now ABB) in 1942. This could drive approximately 110 km on one load and the batteries could have a load of 300 Ah in two packs with 20*2 Volt. The batteries were replaced 2010 and with the same dimensions the storage is now 320 Ah! So development is not always going as fast as we believe!
Still, this truck can only drive 30 km/h, which was quite ok in 1942, and especially as it was primarily used to distribute goods like milk in the city of Stockholm. The technology still is used extensively in trucks being used indoor to avoid exhaust gas also today.
Consumption reduction in heavy industry
In table 3 the reduction potential in different industries are seen. These are our own estimates from different studies we have done earlier [Dahlquist et al 2011]. Here the driving force is to increase the profitability, and higher energy prices thus will drive the reduction directly. For both non-ferrous and ferrous industries the major potential for savings is to reduce scrapping. This can be done by better automation and control all the way from casting over formation to use in different applications. If we have a rough surface we need to grind it to smoothen it. The edges often have different properties than the rest, and thus are cut off. By controlling these better we can reduce the scrapping by at least 10-20%. Of course it is not an easy task. If it had been, it would already have been done. But just because it is difficult, it also will give the ones who can control it a strong competitive edge and thus strong incentives should exist.
Table 3. Reduction potential in different heavy industries in EU
TWh/y
Non Ferrous Metal 15
Ferrous metal 250
Cement industry 30
Pulp mills 30-50
Paper mills HC formation 28-45
Lime kilns 7
Total savings potential 310-340
For cement industry we also have strong advantages with better control. This includes the temperature distribution and the heat transfer in rotating respectively down draft reactors. For cement furnaces the task is easier as we don´t need to consider the risk of sintering, which is otherwise a risk for lime. In both cases the risk for ring formation is a problem, and should be avoided. For cement industry we also see a vast potential to use biomass and waste instead of fossil fuels.
For pulp mills there is a significant potential to reduce the primary steam consumption by using the steam more efficiently. By better control and add-ons of new heat exchanger area this can be achieved. More evaporation steps, optimal dosage of chemicals and optimal heat profile in the digester as a function of the wood quality are some actions to fulfil this. In the paper mill we today normally dilute the fibre suspension to some 0.5 % DS. By increasing this to 5% the amount of water to handle would be reduced from 200 m3/tonne fibre to 20 m3/tonne fibre. This will give a significant reduction of energy losses but also reduce the amount of chemicals needed in the processing, and give a reduction of water treatment problems.
All together this would mean reductions in the range 310-340 TWh/y. If we would add other industries like chemical industry, food and electronics, this would increase even bit further, although we haven´t addressed these industries specifically in this paper.
Energy resources and electric power production from renewable energy resources
There are many different renewable energy sources available in Europe. The most important one is biomass, as this give us an opportunity to store the energy in an efficient way. If we make a rough estimate of the available biomass resources from agriculture and forestry we end up at some 8 500 – 12 500 TWh/y for EU 27. This is under the assumption that we have a total production of 10-15 ton
DS/ha,year for agriculture crops and 1.9 - 2.5 ton DS/ha,year for the forestry. These figure are the actual figures for cereals respectively forestry in Sweden and Northern Europe, but should be reasonable also for the rest of EU27. For cereals it includes both the grain and the straw, although figures normally only are given in statistics for the grain. With these assumptions we get a total biomass production of 6900 -10 400 TWh/year from agriculture and 1600 - 2100 TWh/year from forestry. The biomass can be used in many different ways: for electricity, vehicle fuels and for heating and process energy purpose. Also it is a raw material for paper and potentially plastics, chemicals etc. Of course also the most important function is as food and fodder. The conversion of biomass can be by combustion, gasification, fermentation, pyrolysis, torrefaction or digestion, but we will not discuss all these possibilities in this paper.
Aside of the biomass we also have a huge potential for wind power. European Wind Energy
Association (EWEA), launched a new report recently, "EU Energy Policy to 2050"[2011].
Here they claim that wind power could produce 28.5 % of the electricity demand in EU by
2050, and 14 % of the demand by 2020. This is according to EWEA President Arthouros
Zervos referring to the Member States' National Renewable Energy Action Plans.
9.3 gigawatt (GW) of new wind power capacity was installed in the EU during 2010, reaching
a total of 84 GW by the end of 2010, according to figures released by the European Wind
Energy Association (EWEA). While offshore wind power installations grew 51% from 582
MW in 2009 to 883 MW last year, onshore wind power installations (8.4 GW) were down
13.9% compared to 2009 (9.7 GW). Still we have to be aware of the fact that the wind is not
blowing all the time. It can be design winds perhaps 30% of the year in off-shore installations,
while only 10-20 % in inland installations, depending on where the wind power plant is
situated. The 84 GW could give some 150 – 200 TWh/y while the production could be around
1000 TWh/y by 2030 according to the development plans presented by different wind
companies. In Sweden the national goal is 30 TWh/y and 15 GW by 2030, but already today
wind power companies are projecting for 105 TWh/y only in Sweden!
In terms of annual installations, Spain was the largest wind power market in 2010, installing
1,516 MW, compared to Germany’s 1,493 MW. France was the only other country to install
over 1 GW (1,086 MW), followed by the UK (962 MW) and Italy (948 MW). Sweden (604
MW), Romania (437 MW), Poland (382 MW), Portugal (363 MW) and Belgium (350 MW).
All these figure are from Eurostat [2010].
A third major potential energy resource is the direct solar power. In 2010 12 GW Solar PV
capacity was installed (21.7% of total capacity of new production in EU). This is remarkable
as it is significantly more than the wind with 9.3 GW (16.7%), 4,056 MW (7.3%) of coal, 573
MW (1%) of biomass, 405 MW (0.7%) of CSP , 208 (0.4%) of large hydro, 200 MW (0.4%)
of peat, 149 MW (0.3%) of waste, 145 MW (0.3%) of nuclear, 25 MW of small hydro, 25 MW
of geothermal, and zero MW of tidal and wave capacity were installed. Gas installed more
capacity than any other generating technology in 2010 with 28 GW, representing 51% of total
new installed capacity. It should be noted that all these figures are installed capacity for
electric power, and it relates to maximum capacity, and not average values. Still, it shows
where we are heading. In Portugal the wind power contributed to 101 % of all electricity
production November 2009 – February 2010 according to a presentation at WREC in Abu
Dhabi in September 2010. This shows that the renewable energy resources are of high
importance already today, and not only future possible technologies. The installed capacity
long term will depend on both cost for PV cells and how the power vs energy can be handled.
With new business models we could redistribute the load to time when it is sunny and windy,
and thus the benefits with both wind and solar power will be optimal.
Other major resources for electric power production are Hydro power and nuclear power. In
Eurostat [2010] we can see that the capacity of nuclear was 127 GW and large hydro power
plants 121 GW and small scale hydro 5 GW. The total installed capacity of solar power using
PV cells is 25 GW, while concentrating solar power (CSP) has a capacity today of 0.4 GW.
From the figures we can see that already today non-fossil technologies make up 43 % of the production capacity, if we include the nuclear power. If we were using biomass also for electric power production, we could already today be independent of fossil fuels if we could balance the demand and the production capacity in a good way. At least this would be possible if we were using energy in a more efficient way.If we just look at the electric energy production it was 3400 TWh 2007 [Eurostat 2009]. 29.5 % was from nuclear power, 20.1 from natural gas, 18.3 from coal + oil, 10.2 % from hydro, 2.7 from biomass and 2.4 from wind power. This means 44.8 % was from non-fossil resources and 15.3 from true renewable resources.
The organisation Dessertec made a map [2010] over a possible future electric power production and distribution system including EU27, North Africa and the Middle East. Here we see hydro power in Scandinavia, mountain areas in the Pyrenees and Alps, Egypt and Turkey. This is complemented by wind power in all coastal areas from West Africa to Norway. Photovoltaics should be interesting especially in central and Southern Europe, while concentrating solar power in Spain and Northern Africa. Concentrating solar power is suitable where you seldom have clouds, and thus this is suitable in Northern Africa, but not in the rest of Europe. A high voltage electric grid then should be developed to link all the different sources together, to make it possible to match production and consumption over the whole area.
Possibilities to move loads in time
If we just look at the Swedish case the plan is to build 15 000 MW wind power which should produce 30 TWh electricity per year. This will replace 30 TWh nuclear power with approximately 5 000 MW installed capacity. This indicates the problem that the production from the wind is very much less stable. Today we have 27 500 MW installed capacity giving 150-160 TWh/y. If we assume we need a reserve capacity of 10 % it means 3000 – 4500 MW, but with 20% reserve the double. If we instead of building reserve capacity can control the load, the extra cost can be avoided.
Concerning power control we have the “spinning reserve” which is in < 1 second time schedule. We don´t consider that in this paper, but more the 1-12 hour variations. Many of the natural variations are in this time schedule, while deep temperature drops sometimes are significantly longer. If we have district heating with cogeneration, this can produce more electric power when the demand is higher. With heat pumps, and especially air-air heat pumps, we have a situation where the demand will accelerate when the temperature drops. Here complements with pellet burners would be very interesting.
Still, the shorter dips should be able to handle by shifting loads in time. If we just consider the wind power and have a need to balance 20% of the max load for maximum 12 hours, we would need to redirect approximately 3000 MW and 6 TWh/y.
Today we have 16-20 TWh direct electric heating in Sweden in house-holds, offices and similar. We have roughly the same amount as indirect heating by appliances. If we assume that approximately 30 %
of 20 TWh/y could be used for balancing the supply, this would mean approximately 6.5 TWh/y. By shutting off the heat in a modern house would mean a temperature decrease of 0.5-1 oC per hour. In most cases this would be acceptable at least for some hours. If we know about it in advance, that a temperature drop out door is to be accepted, it can even be possible to increase the indoor temperature some degrees upfront. Other possibilities would be to shut off the refrigerator during a few hours, which would also give a temperature drop of perhaps 0.25-0.5 oC per hour.
For the vehicles we consume 100 TWh/y today. We still consume some 1 liter/10 km, but can expect 0.3 l/10 km with the new series hybrid vehicles or even down to 0.2 l/10 km for e.g. Volvo V60. This would mean a decrease in demand to some 20-25 TWh/y. If we assume approximately 50% coming from batteries, this means 10-12 TWh/y. At least half of this should be able to use in the power balance on a local level. This means some 5-6 TWh/y.
If we add these possibilities together we get 11.5- 12.5 TWh/y. This is well above the probable demand of 6 TWh/y as a reserve. If we extrapolate this to a EU-perspective we can see that it should be possible to have in the range of 10 % also there, although here the reserve will be related to cooling instead of heating in Southern Europe. With absorption heat pumps operating together with electric power production we can reach almost the same electric power efficiencies as with co-generation with district heating. This has been described in Udomsri [2011] more in detail.
What can then motivate the users to redirect their consumption? This we will discuss in the next section.
Different type of incentives
There are many different possibilities to reduce energy use in all areas – industry, households and transportations. Some actions demand significant technical development, while others more has a demand for concrete incentives to do the reduction using existing technologies.
Incentives can be both economic like taxes, subsidies and different regulatory actions, as well as creating an awareness of the need for reducing consumption from a societal and environmental perspective.
It can be interesting to see what the impact of different actions have been historically [Stigson, 2009]. After the nuclear power referendum 1980 in Sweden the politicians were talking a lot about a transfer to renewable energy in different forms. Still, no economic incentives were implemented, and nothing really happened. So in 1992 an agreement was made between a majority of the political parties to introduce a carbon tax for fossil carbon. It was 1.6 c€/kWh, and within 15 years the use of biomass increased from approximately 55 TWh/y to 132 TWh/y in 2010. Also the technical development has been strong as a function of economic incentives. There has been a subsidy for wind power by reduced taxes, which has made this technology expanding a lot, and as we mentioned earlier new wind power production capacity around 105 TWh/y is projected today in Sweden. With the right incentives, and this normally means economic incentives, new production can be realised.
Concerning saving energy the incentives are different. Here Sweden had a very good example where industries could reduce tax if they made investments to save energy. The higher price as such also gives positive results, although the industrialists normally complain a lot about how negative high electricity price is on economic competitiveness. Actually there are huge potentials for energy saving in industry and all other sectors as described earlier, if just the economic incentive is there. Differentiated price depending on the actual production capacity will most probably be more common in the future when we have much more solar and wind power. This also will follow the expansion of the electric grid as well as automation to fulfil the load shedding and similar to follow the actual price continuously.
New business models needed to give incentives for reducing load when production capacity is limited.
Today we are used to consume electricity, heat, cooling or fuels for transportation with no limitations. This is at least the case in Northern Europe. With 45 % of the electric power coming from nuclear power and another 45 % from hydro power, there has been a surplus of energy except when the out-door temperature is very low, or some nuclear plants closed.
In the future on the other hand Sweden and Germany are both planning to close down most of the nuclear power, and when wind power, solar power and thermal power using biomass is to take over but only produce when it is windy or light. We also will see other type of use like electric vehicles. This will cause both problems and opportunities.
We have a lot of biomass that could be used. Still, cogeneration is the most interesting. Today this means primarily simultaneous production of heat and power. In the future we can foresee also also a combination of absorption heat pump in combination with cooling. The potential for this has been described in e.g. Udomsri [2011].
The new business models could be to have a variable price with respect to the power production capacity as well as the load. If the price really reflects the instantaneous production cost, we would create true incentives. On the other hand we also would need an automatic system that can control the load in a robust way. This would be to shut off load, but also control that e.g. refrigerators are turned on again so that food is not destroyed. It should be possible for the customer to select how far he or she can be prepared to go when it comes to shut of e.g. the heating system or hot water production, if electricity is used for this. The level of the price differentiations will have to be tested in real implementations. In Sala-Heby strongly varying electric power price was varied between 27 SEK/kW, Month during evenings and week-ends but 87 SEK/kW during working days 7-19. This has given a significant reduction of power during working days by 20-25 %. The problem so far has been that there is a strong peak between 19 and 20 in the evening. This is less positive. Still, by a better price model the shut on loads could be better distributed.
Discussion and conclusions
If we now try to summarize we can first see that today´s primary energy use was 16 084 TWh/y 2009 and the actual consumption 13465 TWh/y. At the same time we concluded that we have available biomass resources in the range of 8 500 – 12 500 TWh/y for EU 27. Wind power is already today producing some 100 TWh/y but with a potential for at least 1000 TWh/y, and for solar power we could have a potential produce several hundred TWh/y within some 20 years. Hydro power is today 10.2 % of the total 3400 TWh/, that is 350 TWh/y while nuclear is 29.5% or 1000 TWh/y. If we accept nuclear power as a non-fossil resource the available non-fossil energy resources would be (8500- 12500)bio + (100-1000)wind + (5- 200)solar + 350hydro + 1000 nuclear = 9 955 – 15 050 TWh/y.
If we then summarize the potential savings these will add up as follows: buildings (1490) + lightning (100-150) + reduced food waste (150-200) + transportations (2100) + heavy industry (310-340) = 4150 – 4280 TWh/y. If we reduce this from the present 16 084, we end up at 11 800 – 11 900 TWh/y gross energy needed. This is somewhere in the middle of the potential production span from non-fossil sources and shows that the feasibility to become energy independent for EU 27 is quite significant. Of course we also have to look for environmentally good solutions for the biomass production as well as for the installations of new power plants of all kinds.
If we then also include the power aspect we can see that the available resources do not always match in time locally with the demand, although the energy balance over the year looks possible to reach. Still, with a robust high voltage transmission network over EU27 and neighbouring areas, it should be a
possibility to reduce the mismatch to some extent. If we then also add new business models giving relevant incentives to shift the demand from times when there is a difficulty to generate power to time when there is a surplus, we should really be able to create a robust power system built on only non-fossil energy sources. From the example in Sweden we can extrapolate that at least 10 % of the load should be possible to redirect even in the time perspective more than 12 hours.
Some peak loads also could be avoided on the grid by installing complementary technology like absorption heat pumps for cooling and district heating for heating in combination with electric power production in co-generation plants.
Acknowledgements
We would like to give our regards to Swedish Energy Agency who have been giving financial support. We also want to thank Mimer, Mälaranergi, Kommunfastighet, Eskilstuna energy and environment, Logica, Sustainable Innovations and ABB for participation in the different projects discussed in the paper.
References:
ACEA, European Automobile Manufacturer´s Association
http://www.acea.be/index.php/collection/statistics, 2011
Bosseboeuf D. (editor): Energy efficiency trends and policies in the household & tertiary
sectors in the EU27, November 2009, ODYSSE project report.
http://www.odyssee-indicators.org/publications/publications.php
Dahlquist E., Vassileva I, Wallin F., Thorin E., Yan J.: Optimization of the energy system to
achieve a national balance without fossil fuels. : International Journal of Green Energy –
Accepted for publication Manuscript ID IJGE-2010-0020.R1.19-Feb-2011
DESERTEC,
http://www.desertec.org/en/concept/brochures/
, 2010.
Ecoheatcool. European cold market – final report, Work package 2, Euro heat& power, 2006.
Enerdata: The impact of lower oil consumption in Europe on world oil prices. February 2, 2009.www.enerdata.fr , www.transportenvironment.org/Publications/prep_hand_out/lid:531
Eurostat (2010): Statistical pocketbook 2010, EU commission:
http://ec.europa.eu/energy/publications/statistics/statistics_en.htm . 2010.
Kvarnström J.,Dotzauer E, Dahlquist E.: Production and distribution planning of district
heating. Varmeforsk report no 990, Dec 2006. In Swedish.
Schlomann B. (editor): Energy efficiency trends of IT appliances in housholds EU27 , ODYSSEE – MURE project, Frauenhofer institute, Karlsruhe, September 2009.
Udomsri Seksan: Combined electricity production and thermally driven cooling from municipal solid waste. Doctorial (PhD) thesis in energy technology, KTH, Sweden, 2011.

![Figure 3 Break down of household energy for EU-countries 2005 from Bosseboeuf [2009]](https://thumb-eu.123doks.com/thumbv2/5dokorg/4691507.123062/4.898.114.770.102.435/figure-break-household-energy-eu-countries-bosseboeuf.webp)

