410
|
wileyonlinelibrary.com/journal/jcpe J Clin Periodontol. 2021;48:410–430. S Y S T E M A T I C R E V I E WMedium- and long-term clinical benefits of periodontal
regenerative/reconstructive procedures in intrabony defects:
Systematic review and network meta-analysis of randomized
controlled clinical studies
Andreas Stavropoulos
1,2,3| Kristina Bertl
2,4| Loukia M. Spineli
5| Anton Sculean
6|
Pierpaolo Cortellini
7| Maurizio Tonetti
8,91Division of Regenerative Dentistry and
Periodontology, University Clinics of Dental Medicine (CUMD), University of Geneva, Geneva, Switzerland
2Department of Periodontology, Faculty
of Odontology, University of Malmö, Sweden
3Division of Conservative Dentistry
and Periodontology, University Clinic of Dentistry, Medical University of Vienna, Vienna, Austria
4Division of Oral Surgery, University
Clinic of Dentistry, Medical University of Vienna, Austria
5Midwifery Research and Education Unit,
Hannover Medical School, Hannover, Germany
6Department of Periodontology, School
of Dental Medicine, University of Bern, Switzerland
7Accademia Toscana di Ricerca
Odontostomatologia (ATRO), Florence, Italy
8European Research Group on
Periodontology (ERGOPERIO), Genova, Italy
9Department of Oral and Maxillofacial
Implantology, Shanghai Key Laboratory of Stomatology, National Clinical Research Centre of Stomatology, Shanghai 9thPeople Hospital, School of Medicine Shanghai, Jiao Tong University, Shanghai, China
Correspondence
Andreas Stavropoulos, Professor & Director, Division of Regenerative Dentistry and Periodontology,
Abstract
Background: Systematic reviews have established the short-term improvements of
periodontal regenerative/reconstructive procedures compared to conventional surgi-cal treatment in intrabony defects. However, a hierarchy of periodontal regenerative/ reconstructive procedures regarding the medium- to long-term results of treatment does not exist.
Aim: To systematically assess the literature to answer the focused question “In
peri-odontitis patients with intrabony defects, what are the medium- and long-term ben-efits of periodontal regenerative/reconstructive procedures compared with open flap debridement (OFD), in terms of clinical and/or radiographic outcome parameters and tooth retention?”.
Material & Methods: Randomized controlled clinical trials (RCTs), reporting on clinical
and/or radiographic outcome parameters of periodontal regenerative/reconstructive procedures ≥3 years post-operatively, were systematically assessed. Clinical [residual probing pocket depth (PD) and clinical attachment level (CAL) gain, tooth loss] and radiographic [residual defect depth (RDD), bone gain (RBL)] outcome parameters were assessed. Descriptive statistics were calculated, and Bayesian random-effects net-work meta-analyses (NMA) were performed where possible.
Results: Thirty RCTs, presenting data 3 to 20 years after treatment with grafting,
GTR, EMD, as monotherapies, combinations thereof, and/or adjunctive use of blood-derived growth factor constructs or with OFD only, were included. NMA based on 21 RCTs showed that OFD was clearly the least efficacious treatment; regenerative/re-constructive treatments resulted in significantly shallower residual PD in 4 out 8 com-parisons [range of mean differences (MD): −2.37 to −0.60 mm] and larger CAL gain in 6 out 8 comparisons (range of MD: 1.26 to 2.66 mm), and combination approaches ap-peared as the most efficacious. Tooth loss after regenerative/reconstructive treatment
This is an open access article under the terms of the Creative Commons Attribution-NonCommercial-NoDerivs License, which permits use and distribution in any medium, provided the original work is properly cited, the use is non-commercial and no modifications or adaptations are made.
1 | INTRODUCTION
Non-surgical and conventional surgical periodontal therapy – in-cluding various types of access flaps and/or resective techniques – usually results in healthy periodontal tissues, with reduced prob-ing pocket depths (PD) and gain in clinical attachment level (CAL) compared with pretreatment levels, for most patients and sites. Observations in animal and human histological studies (Caton & Zander, 1979; Caton et al., 1980; Wilson et al., 2008) have shown that healing after conventional periodontal therapy is predomi-nantly characterized by repair, that is, a long epithelial attach-ment is formed along the major portion of the previously exposed and instrumented root surface, while in some instances limited amounts of periodontal regeneration may be observed at the api-cal aspects of the defects. In this context, periodontal regenera-tion implies that CAL gain is achieved through new cementum (NC) with functionally oriented inserting collagen fibres formed on the previously exposed/affected portion of the root, paralleled with alveolar bone (AB) formation and the establishment of a periodon-tal ligament (PDL) of physiologic width and composition; reforma-tion of only a part of the periodontium (e.g. NC and PDL) is coined reconstruction.
Residual (deep) PD do, however, persist following non-surgi-cal and/or conventional surginon-surgi-cal periodontal therapy, especially in sites/teeth harbouring deep intrabony defects and/or deep furca-tion involvements; resective surgical techniques can successfully eliminate deep defects, but are associated with undesirable sub-stantial loss of attachment and soft tissue recession (Badersten et al., 1990; Claffey et al., 1990; Kaldahl et al., 1996). Various treat-ment protocols have been used during the years, aiming to enhance clinical treatment outcomes and to avoid the above-mentioned shortcomings, but also with the intention to enhance periodontal regeneration. Despite the variability in the results observed after periodontal regenerative/reconstructive procedures, the clini-cal and/or histologiclini-cal outcomes obtained after such approaches have been in general significantly better compared to conven-tional surgical approaches (for review see: Kao et al., 2015; Sculean et al., 2015). In this context, considering the fact that the clinical
conditions obtained after conventional periodontal therapy, includ-ing surgery, can be preserved for decades – provided the patient is maintaining adequate oral hygiene standards (Axelsson et al., 2004; Matuliene et al., 2010) – it is relevant that the improved clin-ical outcomes obtained after regenerative/reconstructive treat-ment can also be maintained long term. Several publications report on the outcomes of various regenerative/reconstructive periodon-tal procedures several years post-operatively; however, a hierar-chical assessment of the outcome of periodontal regenerative/ reconstructive therapy on the medium (3–5 years) and long term (>5 years) is currently missing in the literature.
University Clinics of Dental Medicine (CUMD), University of Geneva, Geneva, Switzerland.
Email: andreas.stavropoulos@unige.ch
was less frequent (0.4%) compared to OFD (2.8%), but the evidence was sparse. There were only sparse radiographic data not allowing any relevant comparisons.
Conclusion: Periodontal regenerative/reconstructive therapy in intrabony defects
re-sults, in general, in shallower residual PD and larger CAL gain compared with OFD, translating in high rates of tooth survival, on a medium (3–5 years) to long-term basis (5–20 years). Combination approaches appear, in general, more efficacious compared to monotherapy in terms of shallower residual PD and larger CAL gain. A clear hierar-chy could, however, not be established due to limited evidence.
K E Y W O R D S
bone grafts, bone substitutes, EMD, enamel matrix proteins, GTR, long-term, periodontal regeneration, systematic review
Clinical relevance
Scientific rationale for the study: To systematically assess the literature on medium- to long-term outcomes of peri-odontal regenerative/reconstructive procedures in intra-bony defects and to provide a hierarchy of the procedures regarding various clinical and radiographic outcome pa-rameters, by estimating their relative effectiveness on the basis of all possible comparisons among the procedures. Principal findings: Periodontal regenerative/reconstructive therapy in intrabony defects results in better clinical (i.e. shallower residual probing depth and larger clinical attach-ment level gain) compared with OFD on a medium- to long-term basis. Combination approaches (i.e. GTR + grafting, EMD + grafting) appeared, in general, as more effective compared to monotherapy but the evidence was overall weak, and thus, a clear hierarchy could not be established. Tooth loss after regenerative/reconstructive treatment was rare.
Practical implications: Periodontal regenerative/recon-structive therapy, especially combination approaches, is recommended for the treatment of intrabony defects, after critical assessment of the cost–benefit of treatment in the context of the overall treatment plan.
Thus, the aim of the current review was to a) systematically as-sess the literature to answer the focused question: “In periodon-titis patients with deep intrabony defects, what is the medium- to long-term outcome of periodontal regenerative/reconstructive procedures compared with open flap debridement (OFD) in terms of clinical and/or radiographic outcome parameters and tooth reten-tion?” and b) to identify a hierarchy among the tested periodontal regenerative/reconstructive procedures regarding various clinical and radiographic outcome parameters.
2 | MATERIALS AND METHODS
2.1 | Information on the protocol, type of studies,
participants
The present systematic review was performed according to the cri-teria of the Preferred Reporting Items for Systematic Reviews and Meta-analyses (PRISMA; Appendix S1) (Liberati et al., 2009; Moher et al., 2009). For details on the search process, data collection and extraction, and on the analysis, see Appendix S2.
During literature search for original studies, the following in-clusion criteria were applied: (a) English or German language; (b) randomized controlled clinical trials (RCTs) on regenerative/recon-structive periodontal treatment; (c) ≥10 patients; (d) average fol-low-up ≥36 months, but with minimum folfol-low-up ≥24 months; (f) reporting clearly or possible to calculate number of treated teeth/ defects and clinical and/or radiographic treatment effect size; and (g) full text available. Studies were excluded if not meeting all inclu-sion criteria; or reporting on treatment of furcation defects, end-odontic-periodontal lesions, or peri-implant defects.
2.2 | Outcome measures
From the included RCTs, the following data (if available) were ex-tracted and/or calculated: residual PD; CAL gain; PD reduction; gin-gival recession (REC) increase; residual radiographic defect depth (RDD); RDD reduction; radiographic bone level (RBL) gain; the sample size; the standard deviations of measures; and the observation period.
2.3 | Search methods for identification of studies
Electronic search included MEDLINE (PubMed), EMBASE (Ovid) and CENTRAL (Ovid) (last search 17 April 2020; no date restriction used) and was complemented with manual search.
2.4 | Data collection and extraction
Two authors (KB, AS) independently checked title, abstract and fi-nally full text on the pre-defined eligibility criteria. Abstracts with
unclear methodology were included in full-text assessment to avoid exclusion of potentially relevant articles. One author (KB) repeated the literature search. In case of ambiguity, consensus through dis-cussion was achieved.
2.5 | Assessment of risk of bias (RoB) of
included studies
Two authors (AS, KB) independently evaluated RoB of the included studies applying the Cochrane Collaboration‘s Tool for assessing RoB (Higgins et al., 2011). For details, see Appendix S3.
2.6 | Data synthesis
For details, see Appendix S2. Briefly, 3 primary outcome parameters (residual PD, CAL gain and tooth retention) and two secondary out-come parameters (residual RDD, RBL gain) were defined. Outout-come parameters were often calculated, for example residual PD by sub-tracting PD reduction from baseline PD, CAL gain by subsub-tracting CAL after treatment from baseline CAL, standard deviation from standard error of the mean, etc. Studies were arranged, mainly for reasons of clarity, in those reporting on medium- (3–5 years) and long-term (> 5 years) outcomes.
Bayesian random-effects pairwise meta-analyses were initially conducted to account for the between-study variance in the treat-ment effects across at least 2 studies that compared the same in-terventions (DerSimonian & Laird, 1986). The relative treatment effects of the compared interventions were estimated using the un-standardized mean difference (MD) assuming dissimilar population standard deviations (Borenstein et al., 2009).
To infer on the relative effectiveness of various interventions, a random-effects network meta-analysis (NMA) using Bayesian ap-proaches was applied assuming the same between-study variance for all comparisons and considering OFD as the reference treatment. For each intervention, the relative and cumulative ranking probabilities were estimated and illustrated using rankograms and surface under the cumulative ranking (SUCRA) plots, respectively (Salanti et al., 2011). In addition, using the SUCRA values, the interventions were ranked from the most effective (the largest SUCRA) to the least ef-fective (the smallest SUCRA). Possible inconsistency was assessed lo-cally with the node-splitting approach and globally with the unrelated mean effects model together with the posterior deviance and the de-viance information criterion (DIC). Further, possible sources of het-erogeneity and/or inconsistency were investigated using hierarchical meta-regression analysis for observation period (3–5 years versus >5 years), the year of publication, small-study size, and RoB, and the variance of study-specific intervention effects. Possible small-study effects were also explored using the comparison-adjusted funnel plot after ordering the interventions according to their SUCRA value.
The STATA routines were used to create the network plots, ran-kograms, SUCRA plots and the comparison-specific funnel plots
(Chaimani et al., 2013). All NMA models, as developed by Dias et al. (2013), were performed using the R package R2WinBUGS (Sturtz et al., 2005).
3 | RESULTS
3.1 | Study selection
The flow chart of the literature search is presented in Appendix S4. Out of 10461 identified studies, 110 full texts were reviewed; finally, 30 publications from moderate (3–5 years; 19 studies) and long-term (> 5 years; 11 studies) RCTs were included. For list of excluded stud-ies, and reason for exclusion, see Appendix S5.
3.2 | ROB assessment
Among the included studies, only one publication was assessed as of low RoB, while 9 and 20 publications were of high and unclear RoB, respectively. For details, see Appendix S6.
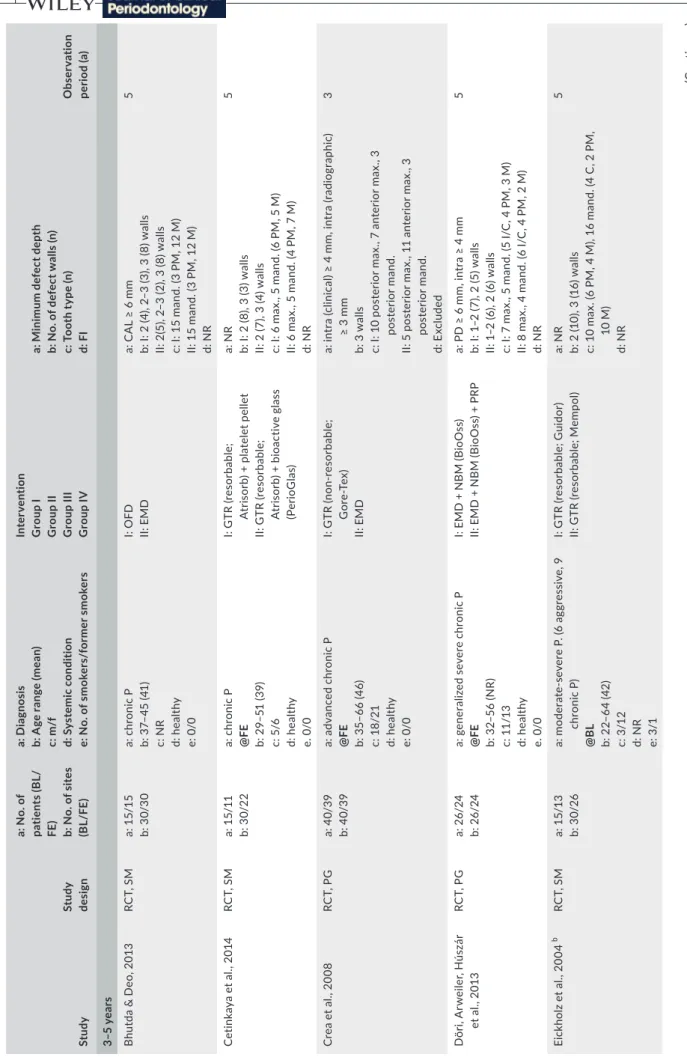
3.3 | Study characteristics
Table 1 presents the characteristics of all identified publications. Six main regenerative/reconstructive approaches were included the fol-lowing: (a) grafting, (b) guided tissue regeneration (GTR), (c) enamel matrix derivatives (EMD), (d) GTR + grafting, (e) EMD + grafting and (f) various combinations, including those using different types of blood-derived growth factor constructs (BC). GTR and EMD, as monotherapies, were the treatments most often used (i.e. 14 and 9 different groups each, respectively); mostly resorbable membranes were used for GTR (19 groups vs. 5 groups with non-resorbable membranes). Further, alloplasts and xenografts (11 groups and 8 groups, respectively) were the most often used grafting materials. BC was used in 5 groups combined with GTR, EMD, and/or bone grafts.
In general, publications reported on treated tooth type and number of bone walls, and a minimum defect depth was most often required for inclusion; however, information on exact de-fect depth and presence or absence of furcation involvement in the treated teeth was often not explicitly reported. Twenty-five publications reporting on 546 and 74 teeth treated with a regen-erative/reconstructive approach or OFD, respectively, provided information on tooth loss. Nine publications reported 10 and 4 teeth extracted, treated regeneratively or with OFD, respec-tively. Periodontitis was reported as the reason for tooth loss for 2 teeth treated regeneratively and for 2 teeth treated with OFD; for 5 teeth treated regeneratively the reason for extraction was not periodontitis, while for the remaining 5 teeth, no specific rea-son was reported (Appendix S7). Considering only the teeth that were definitely lost due to periodontitis, the rate of tooth loss was
0.4% and 2.8% for the teeth treated regeneratively or with OFD, respectively, while all reason tooth loss was 1.9% and 5.4%, re-spectively. Noteworthy, the majority of losses were reported in publications reporting on >5 years from treatment.
3.4 | Synthesis of results
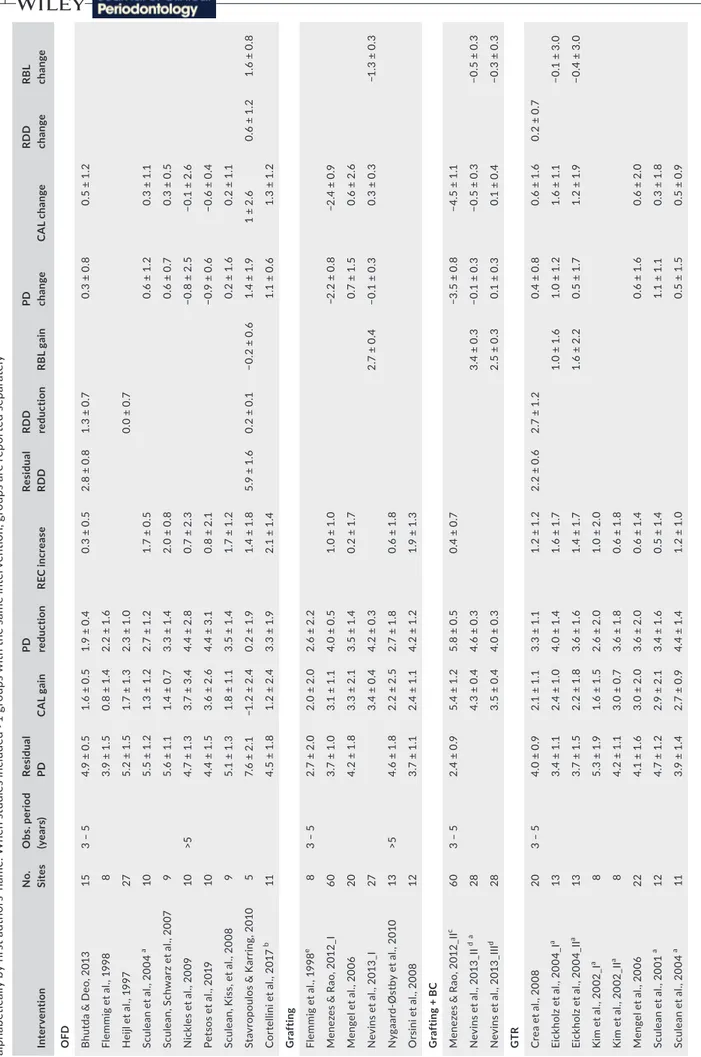
Detailed clinical and radiographic data of the 30 identified studies, arranged per intervention, are presented in Table 2. Out of the 30 publications, 6 were not included in the NMA because they were comparing similar type of treatment (GTR vs. GTR with different type of membranes: Kim et al., 2002; Eickholz et al., 2004; Pretzl et al., 2008; Pretzl et al., 2009; GTR + grafting vs. GTR + grafting with different type of membranes: Górski et al., 2020; EMD + graft-ing with different type of grafts: Döri, Arweiler, Szántó, et al., 2013) and 3 because the same population was reported once more at a later time point (GTR vs. EMD: Sculean et al., 2001; EMD vs. GTR vs. EMD+GTR vs. OFD: Sculean et al., 2004; GTR vs. OFD: Nickles et al., 2009), that is, only the latest time point was used in the NMA. In studies with >2 arms, comparing similar type of treatments (e.g. GTR vs. GTR vs. OFD), only one of the arms was included (see Table 2); specifically, the group with the more modest outcome was included. The publications/groups included in the NMA, provided evidence on residual PD and CAL gain from 573 and 628 regeneratively treated sites, and from 94 sites treated with OFD.
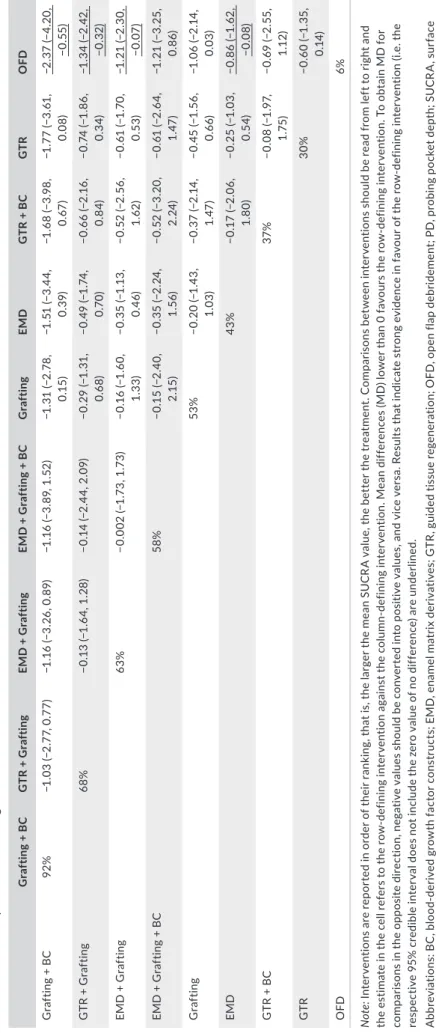
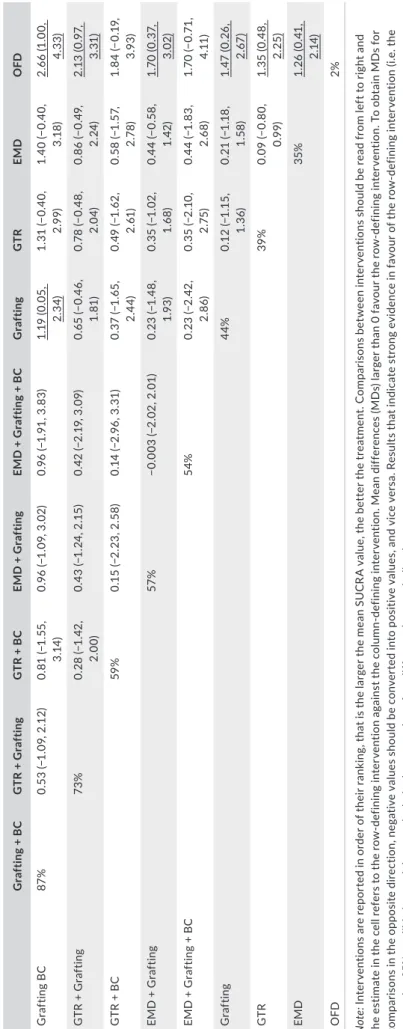
The results of the pairwise meta-analyses for both clinical out-comes, when feasible, are presented in Appendix S8. Figure 1a and b shows forest plots of the various studies included in the NMA ar-ranged per comparison of interventions and ordered by year of pub-lication, for residual PD and CAL gain. Figure 2a and 2b shows the networks for both primary outcomes; overall, both networks show the same network geometry, appearing relatively poorly connected, with direct comparisons among the various interventions often in-cluding only 1 to 2 trials. Only about 33% of the comparisons among the various interventions were direct comparisons and GTR, EMD and OFD being the most connected nodes. The NMA results for re-sidual PD and CAL gain are summarized in league Tables 3a and 3b, respectively. The majority of interventions, except for GTR + BC and EMD + grafting + BC, seemed to be significantly superior to OFD in terms of shallower residual PD (MD range: −2.37 to −0.60 mm) and larger CAL gain (MD range: 1.26 to 2.66 mm). Comparatively, among the regenerative/reconstructive interventions, combination proce-dures seemed to give the largest effect in terms of both residual PD and CAL gain; however, the differences were not statistically signifi-cant. Results on 95% predictive intervals for comparisons with OFD can be found in Appendix S9. The ranking probabilities (Figure 3a and b) and SUCRA values (Figure 4a and b) indicate that combination approaches are comparatively better than monotherapies whereas OFD is the inferior treatment regarding both primary outcomes; however, the hierarchy of the various procedures is characterized by great uncertainty regarding both outcomes, due to the fact that their ranking probabilities appear dispersed below 50%.
TA B LE 1 C ha ra ct er is tic s o f t he i nc lu de d s tu di es a rr an ge d t o t ho se r ep or tin g o n m ed iu m -t er m ( 3– 5 ye ar s) a nd l on g-te rm ( > 5 y ea rs ) o ut co m es . St udy St udy de sig n a: N o. o f pa tie nt s ( B L/ FE ) b: N o. o f s ite s (B L/F E) a: D ia gn os is b: A ge r an ge ( m ea n) c: m /f d: S ys te m ic c on di tio n e: N o. o f s m ok er s/ fo rm er s m ok er s Int er ve nt io n G ro up I G ro up II G ro up III G rou p IV a: Minim um d ef ec t d ep th b: N o. o f d ef ec t w al ls ( n) c: T oo th t yp e ( n) d: F I O bs er va tio n pe rio d ( a) 3– 5 yea rs B hu td a & D eo , 2 01 3 RC T, S M a: 15 /15 b: 30 /30 a: c hr on ic P b: 3 7– 45 ( 41 ) c: N R d: h ea lth y e: 0/ 0 I: O FD II: E MD a: C A L ≥ 6 m m b: I : 2 ( 4) , 2 –3 ( 3) , 3 ( 8) w al ls II: 2 (5 ), 2 –3 ( 2) , 3 ( 8) w al ls c: I : 1 5 m an d. ( 3 P M , 1 2 M ) II: 1 5 m an d. ( 3 P M , 1 2 M ) d: N R 5 C et in ka ya e t a l., 2 01 4 RC T, S M a: 1 5/ 11 b: 3 0/ 22 a: c hr on ic P @ FE b: 2 9– 51 ( 39 ) c: 5 /6 d: h ea lth y e. 0/ 0 I: G TR ( re so rb ab le ; A tr is or b) + p la te le t p el le t II: G TR ( re so rb ab le ; A tr is or b) + b io ac tiv e g la ss (P er io G las ) a: N R b: I : 2 ( 8) , 3 ( 3) w al ls II: 2 ( 7) , 3 ( 4) w al ls c: I : 6 m ax ., 5 m an d. ( 6 P M , 5 M ) II: 6 m ax ., 5 m an d. ( 4 P M , 7 M ) d: N R 5 C re a e t a l., 2 00 8 RC T, P G a: 4 0/ 39 b: 4 0/ 39 a: a dv an ce d c hr on ic P @ FE b: 3 5– 66 ( 46 ) c: 1 8/ 21 d: h ea lth y e: 0/ 0 I: G TR ( no n-re so rb ab le ; G or e-Te x) II: E MD a: i nt ra ( cl in ic al ) ≥ 4 m m , i nt ra ( ra di og ra ph ic ) ≥ 3 m m b: 3 w al ls c: I : 1 0 p os te rio r m ax ., 7 a nt er io r m ax ., 3 po st eri or m and. II: 5 p os te rio r m ax ., 1 1 a nt er io r m ax ., 3 po st eri or m and. d: E xc lu de d 3 D ör i, A rw ei le r, H ús zá r et a l., 2 01 3 RC T, P G a: 2 6/ 24 b: 2 6/ 24 a: g en er al ize d s ev er e c hr on ic P @ FE b: 3 2– 56 ( N R) c: 11 /1 3 d: h ea lth y e. 0/ 0 I: E M D + N B M ( B io O ss ) II: E M D + N B M ( B io O ss ) + P RP a: P D ≥ 6 m m , i nt ra ≥ 4 m m b: I : 1 –2 ( 7) , 2 ( 5) w al ls II: 1 –2 ( 6) , 2 ( 6) w al ls c: I : 7 m ax ., 5 m an d. ( 5 I/ C , 4 P M , 3 M ) II: 8 m ax ., 4 m an d. ( 6 I/ C , 4 P M , 2 M ) d: N R 5 Ei ck ho lz e t a l., 2 00 4 b RC T, S M a: 1 5/1 3 b: 3 0/ 26 a: m od er at e-se ve re P . ( 6 a gg re ss iv e, 9 ch ro ni c P ) @B L b: 2 2– 64 ( 42 ) c: 3 /1 2 d: N R e: 3 /1 I: G TR ( re so rb ab le ; G ui do r) II: G TR ( re so rb ab le ; M em po l) a: N R b: 2 ( 10 ), 3 ( 16 ) w al ls c: 1 0 m ax . ( 6 P M , 4 M ), 1 6 m an d. ( 4 C , 2 P M , 10 M ) d: N R 5 (Co nti nue s)
St udy St udy de sig n a: N o. o f pa tie nt s ( B L/ FE ) b: N o. o f s ite s (B L/F E) a: D ia gn os is b: A ge r an ge ( m ea n) c: m /f d: S ys te m ic c on di tio n e: N o. o f s m ok er s/ fo rm er s m ok er s Int er ve nt io n G ro up I G ro up II G ro up III G rou p IV a: Minim um d ef ec t d ep th b: N o. o f d ef ec t w al ls ( n) c: T oo th t yp e ( n) d: F I O bs er va tio n pe rio d ( a) Fl em m ig e t a l., 1 99 8 RC T, S M a: 14 /8 b: 2 8/1 6 a: N R @ FE b: N R ( 47 ) c: 4 /4 d: N R e: 1 /0 I: O FD II: a ut ol ys ed , a nt ig en -e xt ra ct ed , al lo ge ni c b on e + ne om yc in su lp ha te + b ac itr ac in a: C A L ≥ 6 m m b: I : 1 ( 1) , 2 ( 2) , 3 ( 5) w al ls II: 1 ( 3) , 2 ( 1) , 3 ( 4) w al ls c: N R d: N R 3 G or sk i e t a l., 2 02 0 RC T, SM a: 1 5/ 14 b: 3 0/ 27 a: A gP @B L b: 2 2– 49 ( 38 ) c: 5/1 0 d: h ea lth y e: N R I: G TR ( re so rb ab le ; B io G id e) + N B M ( B io O ss ) II: G TR ( re so rb ab le ; B io G id e) + N B M ( B io O ss ) a: P D ≥ 6 m m , i nt ra ≥ 3 m m b: I : 1 ( 2) , 2 ( 4) , 3 ( 9) w al ls II: 1 ( 3) , 2 ( 4) , 3 ( 8) w al ls c: I : 5 m ax ., 1 0 m an d. ( 4 I/ C , 4 P M , 7 M ) II: 7 m ax ., 8 m an d. ( 5 I/ C , 3 P M , 7 M ) d: e xc lu de d 4 H ei jl e t a l., 1 99 7 RC T, S M a: 3 3/ 26 b: 6 8/5 4 a: N R @B L b: 3 3– 68 ( 48 ) c: 7/ 26 d: r eg ul ar m ed ic at io n i nt ak e ( 11 ) e: 1 6/1 3 I: O FD II: E MD a: P D ≥ 6 m m , i nt ra ≥ 4 m m , w id th ≥ 2 m m b: I : 1 ( 11 ), 2 ( 23 ) w al ls II: 1 ( 17 ), 2 ( 17 ) w al ls c: N R d: N R 3 H of fm an n e t a l., 2 01 5 RC T, P G a: 7 3/3 0 b: 7 3/3 0 a: s ev er e P @ FE b: N R ( 47 ) c: 1 3/17 d: h ea lth y e: 4 /1 I: E M D II: E M D + b ip ha si c c al ci um ph os pha te (B on eC er amic ) a: i nt ra ≥ 4 m m , w id th ≥ 2 m m b: I : 1 ( 2) , 1 –2 ( 6) , 2 ( 2) , c irc um fe re nt ia l ( 5) II: 1 ( 2) , 1 –2 ( 5) , 2 ( 3) , c irc um fe re nt ia l ( 5) c: N R d: e xc lu de d 3 K im e t a l., 2 00 2 b RC T, S M a: 1 2/8 b: 2 4/1 6 a: a dv an ce d c hr on ic P @ FE b: 3 2– 62 ( 46 ) c: 3 /9 ( @ B L) d: d ia be te s ( 2) e: 3 /0 I: G TR ( no n-re so rb ab le ; G or e-Te x) II: G TR ( re so rb ab le , p ol yg la ct in ; V icr yl ) a: N R b: N R c: I : 3 m ax ., 5 m an d. ( 1 C , 4 P M , 3 M ) II: 2 m ax ., 6 m an d. ( 1 I , 2 C , 3 P M , 2 M ) d: N R 5 M en eze s & R ao , 2 01 2 RC T, S M a: 60 /60 b: 12 0/ 12 0 a: c hr on ic P b: N R ( 38 ) c: 30 /30 d: h ea lth y e: 0/ 0 I: H A ( Pe rio bo ne G ) + s al in e II: H A ( Pe rio bo ne G ) + P RP a: P D ≥ 6 m m , i nt ra ≥ 3 m m b: I : 2 –3 ( 10 ), 3 ( 50 ) w al ls II: 2 –3 ( 13 ), 3 ( 47 ) w al ls c: I : 3 2 m ax . M , 2 8 m an d. M II: 3 2 m ax . M , 2 8 m an d. M d: F I n ot c on ne ct ed t o t he i nt er pr ox im al d ef ec t 4 Ta bl e 1 ( C on tin ue d) (Co nti nue s)
St udy St udy de sig n a: N o. o f pa tie nt s ( B L/ FE ) b: N o. o f s ite s (B L/F E) a: D ia gn os is b: A ge r an ge ( m ea n) c: m /f d: S ys te m ic c on di tio n e: N o. o f s m ok er s/ fo rm er s m ok er s Int er ve nt io n G ro up I G ro up II G ro up III G rou p IV a: Minim um d ef ec t d ep th b: N o. o f d ef ec t w al ls ( n) c: T oo th t yp e ( n) d: F I O bs er va tio n pe rio d ( a) M en ge l e t a l., 2 00 6 (R )C T, P G a: 16 /16 b: 42 /42 a: g en er al ize d a gg re ss iv e P b: 3 2– 62 ( 45 ) c: 5 /11 d: h ea lth y e: 0/ 0 I: G TR ( re so rb ab le ; R es ol ut ) II: b io ac tiv e g la ss ( Pe rio G la s) a: P D ≥ 7 m m , i nt ra ≥ 4 m m b: 1 –3 w al ls c: 9 I/ C , 9 P M , 2 4 M d: e xc lu de d 5 N ev in s e t a l., 2 01 3 RC T, P G a: 1 80/ 83 b: 1 80/ 83 a: N R b: 2 5– 75 ( N R) c: N R d: N R e: N R I: ß -T C P + bu ff er II: ß -T C P + rh PD G F-B B ( 0. 3 m g/ m l) III : ß -T C P + rh PD G F-B B ( 1. 0 m g/ m l) a: P D ≥ 7 m m , i nt ra ≥ 4 m m b: 1 –3 w al ls c: N R d: N R 3 O gi ha ra & T ar no w , 20 14 RC T, P G a: 6 9/ 67 b: 6 9/ 67 a: c hr on ic P @B L b: N R ( 53 –5 6) c: 14 /5 5 d: h ea lth y e: 0/ 0 I: E M D II: E M D + F D B A + m in oc yc lin e III : E M D + D FD B A + m in oc yc lin e a: C A L ≥ 6 m m b: N R c: I : 1 2 m ax ., 1 1 m an d. ( 1 I , 1 C , 1 P M , 2 0 M ) II: 1 0 m ax ., 1 3 m an d. ( 1 I , 1 C , 1 P M , 2 0 M ) III : 1 1 m ax ., 1 2 m an d. ( 2 P M , 2 1 M ) d: N R 3 Pi et ru sk a e t a l., 2 01 2 RC T, P G a: 24 /24 b: 24 /24 a: a dv an ce d c hr on ic P b: 3 4– 62 ( N R) c: 1 0/ 14 d: h ea lth y e: 0/ 0 I: E M D II: E M D + b ip ha si c c al ci um ph os pha te (B on eC er amic ) a: P D ≥ 6 m m , i nt ra ≥ 4 m m b: I : 1 –2 ( 1) , 2 ( 8) , 3 ( 3) w al ls II: 1 –2 ( 1) , 2 ( 9) , 3 ( 2) w al ls c: I : 5 m ax ., 7 m an d. ( 5 I/ C , 5 P M , 2 M ) II: 6 m ax ., 6 m an d. ( 6 I/ C , 4 P M , 2 M ) d: N R 4 Sc ul ea n e t a l., 2 00 1 b (R )C T, S M a: 1 6/1 2 b: 32 /2 4 a: N R @ FE b: 3 7– 55 ( 45 ) c: 6 /6 d: h ea lth y e: N R I: G TR ( re so rb ab le ; R es ol ut ) II: E MD a: P D ≥ 6 m m b: I : 1 ( 1) , 2 ( 8) , 3 ( 3) w al ls II: 1 ( 1) , 2 ( 9) , 3 ( 2) w al ls c: N R d: N R 4 Sc ul ea n e t a l., 2 00 4 b RC T, P G a: 5 6/ 42 b: 5 6/ 42 a: N R @ FE b: N R ( 47 ) c: N R d: h ea lth y e: N R I: O FD II: E MD III : G TR ( re so rb ab le ; R es ol ut ) IV : E M D + G TR ( re so rb ab le ; Re so lu t) a: P D ≥ 6 m m , i nt ra ≥ 3 m m b: I : 1 –2 ( 3) , 2 ( 5) , 3 ( 2) w al ls II: 1 –2 ( 3) , 2 ( 7) , 3 ( 1) w al ls III : 1 –2 ( 3) , 2 ( 6) , 3 ( 2) w al ls IV : 1 –2 ( 2) , 2 ( 7) , 3 ( 1) w al ls c: N R d: N R 5 Ta bl e 1 ( C on tin ue d) (Co nti nue s)
St udy St udy de sig n a: N o. o f pa tie nt s ( B L/ FE ) b: N o. o f s ite s (B L/F E) a: D ia gn os is b: A ge r an ge ( m ea n) c: m /f d: S ys te m ic c on di tio n e: N o. o f s m ok er s/ fo rm er s m ok er s Int er ve nt io n G ro up I G ro up II G ro up III G rou p IV a: Minim um d ef ec t d ep th b: N o. o f d ef ec t w al ls ( n) c: T oo th t yp e ( n) d: F I O bs er va tio n pe rio d ( a) Sc ul ea n, P ie tr us ka , et a l., 2 00 7 RC T, P G a: 3 0/ 25 b: 3 0/ 25 a: a dv an ce d c hr on ic P @ FE b: 3 8– 55 ( 46 ) c: 1 1/ 14 d: h ea lth y e: N R I: E M D II: E M D + b io ac tiv e g la ss (E m do ga in G el T S® ) a: P D ≥ 6 m m , i nt ra ≥ 3 m m b: I : 1 –2 ( 7) , 2 ( 5) , 3 ( 1) w al ls II: 1 –2 ( 6) , 2 ( 5) , 3 ( 1) w al ls c: N R d: N R 4 Sc ul ea n, S ch w ar z, et a l., 2 00 7 RC T, P G a: 2 8/ 19 b: 2 8/ 19 a: a dv an ce d c hr on ic P @B L b: N R ( 45 ) c: 9/ 10 d: h ea lth y e: 0/ 0 I: O FD II: G TR ( re so rb ab le ; B io G id e) + N B M ( B io O ss ) a: P D ≥ 6 m m , i nt ra ≥ 3 m m b: I : 1 –2 ( 1) , 2 ( 7) , 3 ( 1) w al ls II: 1 –2 ( 2) , 2 ( 7) , 3 ( 1) w al ls c: N R d: N R 5 >5 y ea rs C or te lli ni e t a l., 2 01 7 RC T, P G a: 4 5/4 1 b: 4 5/4 1 a: N R @B E b: 2 5– 61 ( 43 ) c: 2 1/ 24 d: h ea lth y e: 6 I: O FG II: G TR III: G TR t a: N R b: 1 –3 w al ls c: 3 6 m ax ., 9 m an d. , ( 17 I , 1 3 C , 7 P M , 8 M ) d: e xc lu de d 20 D ör i, A rw ei le r, S zá nt ó, et a l., 2 01 3 b RC T, P G a: 24 /2 2 b: 24 /2 2 a: g en er al ize d a dv an ce d c hr on ic P @ FE b: 3 4– 67 ( N R) c: 7/ 15 d: h ea lth y e: 2 /0 I: E M D + N B M ( B io O ss ) II: E M D + ß -T C P ( C er as or b) a: P D ≥ 6 m m , i nt ra ≥ 4 m m b: I : 1 –2 ( 1) , 2 ( 8) , 3 ( 2) w al ls II: 1 –2 ( 1) , 2 ( 7) , 3 ( 3) w al ls c: I : 5 m ax ., 6 m an d. ( 5 I/ C , 4 P M , 2 M ) II: 4 m ax ., 7 m an d. ( 5 I/ C , 5 P M , 1 M ) d: N R 10 N ic kl es e t a l., 2 00 9 a (R )C T, S M , (P G ) a: 10 /10 b: 20 /20 a: s ev er e c hr on ic P b: 4 1– 73 ( N R) c: N R d: N R e: 2 /4 I: O FD II: G TR ( re so rb ab le ; G ui do r) a: P D ≥ 5 m m b: 2 , 3 w al ls c: 6 m ax . ( 2 I/ C , 4 P M ), 1 4 m an d. ( 2 I/ C , 4 P M , 8 M ) d: N R 10 N yg aa rd -Ø st by e t a l., 20 10 RC T, P G a: 4 0/ 26 b: 4 0/ 26 a: c hr on ic P @B L b: 4 2– 67 ( 53 ) c: 20 /20 d: h ea lth y e: 0/ 0 I: a ut og en ou s b on e II: G TR ( re so rb ab le ; A tr is or b) + a ut og en ou s b on e a: P D ≥ 6 m m , i nt ra > 4 m m b: N R c: I : 8 m ax . ( 7 I/ C , 1 P M ), 5 m an d. ( 4 I/ C , 1 P M ) II: 1 0 m ax ( 5 I/ C , 5 P M ), 3 m an d I/ C d: e xc lu de d 10 Ta bl e 1 ( C on tin ue d) (Co nti nue s)
St udy St udy de sig n a: N o. o f pa tie nt s ( B L/ FE ) b: N o. o f s ite s (B L/F E) a: D ia gn os is b: A ge r an ge ( m ea n) c: m /f d: S ys te m ic c on di tio n e: N o. o f s m ok er s/ fo rm er s m ok er s Int er ve nt io n G ro up I G ro up II G ro up III G rou p IV a: Minim um d ef ec t d ep th b: N o. o f d ef ec t w al ls ( n) c: T oo th t yp e ( n) d: F I O bs er va tio n pe rio d ( a) O rs in i e t a l., 2 00 8 RC T, S M a: 12 /12 b: 24 /24 a: N R b: 2 9– 62 ( 42 ) c: 7/ 5 d: h ea lth y e: 0/ 0 I: G TR ( re so rb ab le ; B io G id e) + a ut og en ou s b on e II: a ut og en ou s b on e + ca lc iu m sul pha te (S ur gip la st er ) a: N R b: 2 , 3 w al ls c: N R d: N R 6 Pe ts os e t a l., 2 01 9 a R) C T, S M , (P G ) a: 10 /10 b: 20 /20 a: s ev er e c hr on ic P b: 4 1– 73 ( N R) c: N R d: N R e: 2 /4 I: O FD II: G TR ( re so rb ab le ; G ui do r) a: P D ≥ 5 m m b: 2 , 3 w al ls c: 6 m ax . ( 2 I/ C , 4 P M ), 1 4 m an d. ( 2 I/ C , 4 P M , 8 M ) d: N R 20 (follo w -u p o f Nick le s et a l., 20 09) Pr et zl e t a l., 2 00 8 b RC T, S M a: 1 2/8 b: 2 4/1 6 a: a dv an ce d P @B L b: 3 2– 62 ( 46 ) c: 3 /9 d: 2 D M e: 3 /0 I: G TR ( no n-re so rb ab le ; G or e-Te x) II: G TR ( re so rb ab le ; V ic ry l) a: N R b: N R c: I : 3 m ax . ( 1 C , 2 P M ), 5 m an d. ( 3 P M , 2 M ) II: 3 m ax . ( 1 C , 2 P M ), 5 m an d. ( 3 P M , 2 M ) d: N R 10 (follo w -u p o f K im e t a l., 20 02 ) Pr et zl e t a l., 2 00 9 b RC T, S M a: 1 5/ 9 b: 3 0/1 8 a: m od er at e-se ve re P ( 6 a gg re ss iv e, 9 ch ro ni c P ) @B L b: 2 2– 64 ( 42 ) c: 3 /1 2 d: N R e: 3 /1 I: G TR ( re so rb ab le ; G ui do r) II: G TR ( re so rb ab le ; M em po l) a: N R b: 2 , 3 w al ls c: 6 m ax . ( 2 P M , 4 M ), 1 4 m an d. ( 4 I/ C , 4 P M , 6 M ) d: N R 10 (follo w -u p o f Eick ho lz et a l., 20 04) Sc ul ea n e t a l., 2 00 6 (R )C T, S M a: 1 6/1 0 b: 32 /2 0 a: N R @ FE b: 3 8– 55 ( 46 ) c: 4 /6 d: h ea lth y e: N R I: G TR ( re so rb ab le ; R es ol ut ) II: E MD a: P D ≥ 6 m m b: I : 1 ( 1) , 2 ( 8) , 3 ( 1) w al ls II: 1 ( 1) , 2 ( 7) , 3 ( 2) w al ls c: N R d: N R 8 (follo w -u p o f Sc ul ea n et a l., 20 01) Sc ul ea n, K is s, e t a l., 20 08 RC T, P G a: 5 6/3 8 b: 5 6/3 8 a: N R @ FE b: N R ( 52 ) c: N R d: h ea lth y e: N R I: O FD II: E MD III : G TR ( re so rb ab le ; R es ol ut ) IV : E M D + G TR ( re so rb ab le ; Re so lu t) a: P D ≥ 6 m m , i nt ra ≥ 3 m m b: I : 1 –2 ( 2) , 2 ( 5) , 3 ( 2) w al ls II: 1 –2 ( 3) , 2 ( 6) , 3 ( 1) w al ls III : 1 –2 (3 ), 2 ( 6) , 3 ( 1) w al ls IV : 1 –2 ( 2) , 2 ( 7) , 3 ( 1) w al ls c: N R d: N R 10 ( fo llo w -u p of Scul ea n et a l., 20 04) Ta bl e 1 ( C on tin ue d) (Co nti nue s)
The network for residual RDD included only singleton studies whereas the network for RBL gain comprised from disconnected pieces of evidence (Appendix S10); hence, NMA was not feasible. Based on only few pairwise comparisons, regenerative/reconstruc-tive treatment appeared more effecregenerative/reconstruc-tive compared with OFD in terms of shallower residual RDD and larger RBL gain (MD ranges: −4.74 to −1.20 mm and 3.79 to 3.88 mm, respectively).
The results regarding possible local and global inconsistency for both primary outcomes, and the assessment for possible effect mod-ification due to publication year, small-study size, observation period (3–5 years versus >5 years) or RoB are presented inAppendix S11. Shortly, there seems to be no evidence of statistical inconsistency in both networks. Τhe year of publication appeared to have a neg-ligible effect, whereas investigation of small-study size, observation period, and RoB indicated a slight, statistically insignificant, effect exaggerating the results of OFD regarding residual PD and CAL gain. Overall, sensitivity analyses indicate robustness of the results (Appendix S11).
4 | DISCUSSION
The results of the present systematic review and NMA showed that, periodontal regenerative/reconstructive therapy in intrabony de-fects results, in general, in significantly better clinical outcomes com-pared with OFD on a medium- to long-term basis (i.e. from at least 3 to up to 20 years). In particular, the NMA showed that intrabony de-fects treated with a regenerative/reconstructive approach presented significantly shallower residual PD [range of MD: −2.37 to −0.60 mm] and larger CAL gain (MD: 1.26 to 2.66 mm) compared with what was achieved with OFD. Importantly, residual PD after most of regenera-tive/reconstructive modalities was at a level considered maintainable (i.e. with low risk of progression) by supportive treatment; indeed, in 33 out of 35 groups (94%), representing various regenerative/recon-structive approaches in the studies included in the NMA, average re-sidual PD was <5 mm, while this was the case in only 3 out of 8 (33%) OFD groups (Table 2). Deep pockets after periodontal therapy are indeed associated with an increased risk for disease progression and tooth loss; specifically, a dose-dependent association between deep residual PD and periodontitis progression, together with a multifold higher risk for tooth loss, has been reported compared to teeth with residual PD of ≤3 mm (Matuliene et al., 2008). Herein, out of 25 pub-lications reporting on tooth loss, only 9 reported ≥1 tooth lost; 0.4% and 2.8% of the teeth treated with a regenerative/reconstructive approach or with OFD, respectively, were lost due to periodontitis. Since there were only few studies directly comparing regenerative treatment with OFD and reporting on tooth loss, no assumptions on the superiority of regenerative/reconstructive therapy over OFD should be made regarding tooth retention; nevertheless, it appears that the impact of the above-mentioned medium- to long-term clini-cal improvements achieved with regenerative/reconstructive treat-ment can be translated in decreased tooth mortality, a major goal of periodontal treatment. St udy St udy de sig n a: N o. o f pa tie nt s ( B L/ FE ) b: N o. o f s ite s (B L/F E) a: D ia gn os is b: A ge r an ge ( m ea n) c: m /f d: S ys te m ic c on di tio n e: N o. o f s m ok er s/ fo rm er s m ok er s Int er ve nt io n G ro up I G ro up II G ro up III G rou p IV a: Minim um d ef ec t d ep th b: N o. o f d ef ec t w al ls ( n) c: T oo th t yp e ( n) d: F I O bs er va tio n pe rio d ( a) St av ro po ul os & K ar rin g, 2 01 0 RC T, P G a: 6 0/ 38 b: 6 0/ 38 a: a dv an ce d P @B L b: 2 6– 62 ( N R) c: 2 7/ 33 d: N R e: N R I: O FD II: G TR ( re so rb ab le ; R es ol ut ) III : G TR ( re so rb ab le ; Re so lu t) + N B M (B io O ss ) + s al in e IV : G TR ( re so rb ab le ; Re so lu t) + N BM (B io O ss ) + g en ta mic in s ul pha te a: P D ≥ 7 m m , i nt ra ≥ 4 m m b: 1 , 2 w al ls c: N R d: e xc lu de d 6 A bb re vi at io ns : ( R) C T, a cc or di ng t o a ut ho rs r an do m ize d, b ut r an do m iz at io n p ro ce ss n ot d ef in ed ; B L, b as el in e; C , c an in e; C A L, c lin ic al a tt ac hm en t l ev el ; C S, c as e s er ie s; C T, c on tr ol le d t ria l; D FD B A , de m in er al ize d f re eze -d rie d b on e a llo gr af t; E M D , e na m el m at rix d er iv at iv es ; f , f em al e; F D B A , f re eze -d rie d b on e a llo gr af t; F E, f in al e va lu at io n; F I, f ur ca tio n i nv ol ve m en t; G TR , g ui de d t is su e r eg en er at io n; H A , h yd ro xy la pa tit e; I , i nc is or ; i nt ra , i nt ra bo ny d ef ec t d ep th ; m , m al e; M , m ol ar ; m an d. , m an di bu la r t ee th ; m ax ., m ax ill ar y t ee th ; N B M , n at ur al b on e m in er al ; N R , n ot r ep or te d; O FD , o pe n f la p d eb rid em en t; P, p er io do nt iti s; P D , p ro bi ng p oc ke t d ep th ; P G , p ar al le l g ro up; P M , p re m ol ar ; P RP , p la te le t-ric h p la sm a; R C T, r an do m ize d c on tr ol le d t ria l; r hP D G F, r ec om bi na nt h um an p la te le t-de riv ed g ro w th f ac to r; R S, re tr os pe ct iv e s tu dy ; S M , s pl it m ou th ; ß -T C P, ß -t ric al ci um p ho sp ha te ; w id th , i nt ra bo ny d ef ec t w id th . aH er ei n, d at a o f t he s pl it m ou th g ro up a re r ep or te d; bSt ud ie s n ot c on tr ib ut in g w ith d at a i n t he n et w or k m et a-an al ys es . Ta bl e 1 ( C on tin ue d)
TA B LE 2 M ea n ± st an da rd d ev ia tio n ( in m m ) o f c lin ic al a nd r ad io gr ap hi c p ar am et er s o f i nd iv id ua l s tu di es , a rr an ge d p er i nt er ve nt io n. S tu di es w ith in e ac h i nt er ve nt io n a re a rr an ge d al ph ab et ic al ly b y f irs t a ut ho rs ’ n am e. W he n s tu di es i nc lu de d > 1 g ro up s w ith t he s am e i nt er ve nt io n, g ro up s a re r ep or te d s ep ar at el y In te rv en tio n N o. Si te s O bs . p er io d (ye ar s) Re si du al PD C A L g ain PD red uc tion RE C in cre as e Re si du al RD D RD D red uc tion RB L g ain PD chang e C A L c ha ng e RD D ch ang e RB L ch ang e O FD B hu td a & D eo , 2 01 3 15 3 – 5 4. 9 ± 0. 5 1. 6 ± 0. 5 1. 9 ± 0. 4 0. 3 ± 0. 5 2. 8 ± 0. 8 1. 3 ± 0. 7 0. 3 ± 0. 8 0. 5 ± 1. 2 Fl em m ig e t a l., 1 99 8 8 3. 9 ± 1. 5 0. 8 ± 1. 4 2. 2 ± 1. 6 H ei jl e t a l., 1 99 7 27 5. 2 ± 1. 5 1. 7 ± 1. 3 2. 3 ± 1. 0 0. 0 ± 0. 7 Sc ul ea n e t a l., 2 00 4 a 10 5. 5 ± 1. 2 1. 3 ± 1. 2 2. 7 ± 1. 2 1. 7 ± 0. 5 0. 6 ± 1. 2 0. 3 ± 1. 1 Sc ul ea n, S ch w ar z e t a l., 2 00 7 9 5. 6 ± 1. 1 1. 4 ± 0. 7 3. 3 ± 1. 4 2. 0 ± 0. 8 0. 6 ± 0. 7 0. 3 ± 0. 5 N ic kl es e t a l., 2 00 9 10 >5 4. 7 ± 1. 3 3. 7 ± 3. 4 4. 4 ± 2. 8 0. 7 ± 2. 3 −0 .8 ± 2 .5 −0 .1 ± 2 .6 Pe ts os e t a l., 2 01 9 10 4. 4 ± 1. 5 3. 6 ± 2. 6 4. 4 ± 3. 1 0. 8 ± 2. 1 −0 .9 ± 0 .6 −0 .6 ± 0 .4 Sc ul ea n, K is s, e t a l., 2 00 8 9 5. 1 ± 1. 3 1. 8 ± 1. 1 3. 5 ± 1. 4 1. 7 ± 1. 2 0. 2 ± 1. 6 0. 2 ± 1. 1 St av ro po ul os & K ar rin g, 2 01 0 5 7. 6 ± 2. 1 −1 .2 ± 2 .4 0. 2 ± 1. 9 1. 4 ± 1. 8 5. 9 ± 1. 6 0. 2 ± 0. 1 −0 .2 ± 0 .6 1. 4 ± 1. 9 1 ± 2. 6 0. 6 ± 1. 2 1. 6 ± 0. 8 C or te lli ni e t a l., 2 01 7 b 11 4. 5 ± 1. 8 1. 2 ± 2. 4 3. 3 ± 1. 9 2. 1 ± 1. 4 1. 1 ± 0. 6 1. 3 ± 1. 2 G raf tin g Fl em m ig e t a l., 1 99 8 e 8 3 – 5 2. 7 ± 2. 0 2. 0 ± 2. 0 2. 6 ± 2. 2 M en ez es & R ao , 2 01 2_ I 60 3. 7 ± 1. 0 3. 1 ± 1. 1 4. 0 ± 0. 5 1. 0 ± 1. 0 −2 .2 ± 0 .8 −2 .4 ± 0 .9 M en ge l e t a l., 2 00 6 20 4. 2 ± 1. 8 3. 3 ± 2. 1 3. 5 ± 1. 4 0. 2 ± 1. 7 0. 7 ± 1. 5 0. 6 ± 2. 6 N ev in s e t a l., 2 01 3_ I 27 3. 4 ± 0. 4 4. 2 ± 0. 3 2. 7 ± 0. 4 −0 .1 ± 0 .3 0. 3 ± 0. 3 −1 .3 ± 0 .3 N yg aa rd -Ø st by e t a l., 2 01 0 13 >5 4. 6 ± 1. 8 2. 2 ± 2. 5 2. 7 ± 1. 8 0. 6 ± 1. 8 O rs in i e t a l., 2 00 8 12 3. 7 ± 1. 1 2. 4 ± 1. 1 4. 2 ± 1. 2 1. 9 ± 1. 3 G ra ft in g + B C M en ez es & R ao , 2 01 2_ II c 60 3 – 5 2. 4 ± 0. 9 5. 4 ± 1. 2 5. 8 ± 0. 5 0. 4 ± 0. 7 −3 .5 ± 0 .8 −4 .5 ± 1 .1 N ev in s e t a l., 2 01 3_ II d a 28 4. 3 ± 0. 4 4. 6 ± 0. 3 3. 4 ± 0. 3 −0 .1 ± 0 .3 −0 .5 ± 0 .3 −0 .5 ± 0 .3 N ev in s e t a l., 2 01 3_ III d 28 3. 5 ± 0. 4 4. 0 ± 0. 3 2. 5 ± 0. 3 0. 1 ± 0. 3 0. 1 ± 0. 4 −0 .3 ± 0 .3 G TR C re a e t a l., 2 00 8 20 3 – 5 4. 0 ± 0. 9 2. 1 ± 1. 1 3. 3 ± 1. 1 1. 2 ± 1. 2 2. 2 ± 0. 6 2. 7 ± 1. 2 0. 4 ± 0. 8 0. 6 ± 1. 6 0. 2 ± 0. 7 Ei ck ho lz e t a l., 2 00 4_ I a 13 3. 4 ± 1. 1 2. 4 ± 1. 0 4. 0 ± 1. 4 1. 6 ± 1. 7 1. 0 ± 1. 6 1. 0 ± 1. 2 1. 6 ± 1. 1 −0 .1 ± 3 .0 Ei ck ho lz e t a l., 2 00 4_ II a 13 3. 7 ± 1. 5 2. 2 ± 1. 8 3. 6 ± 1. 6 1. 4 ± 1. 7 1. 6 ± 2. 2 0. 5 ± 1. 7 1. 2 ± 1. 9 −0 .4 ± 3 .0 K im e t a l., 2 00 2_ I a 8 5. 3 ± 1. 9 1. 6 ± 1. 5 2. 6 ± 2. 0 1. 0 ± 2. 0 K im e t a l., 2 00 2_ II a 8 4. 2 ± 1. 1 3. 0 ± 0. 7 3. 6 ± 1. 8 0. 6 ± 1. 8 M en ge l e t a l., 2 00 6 22 4. 1 ± 1. 6 3. 0 ± 2. 0 3. 6 ± 2. 0 0. 6 ± 1. 4 0. 6 ± 1. 6 0. 6 ± 2. 0 Sc ul ea n e t a l., 2 00 1 a 12 4. 7 ± 1. 2 2. 9 ± 2. 1 3. 4 ± 1. 6 0. 5 ± 1. 4 1. 1 ± 1. 1 0. 3 ± 1. 8 Sc ul ea n e t a l., 2 00 4 a 11 3. 9 ± 1. 4 2. 7 ± 0. 9 4. 4 ± 1. 4 1. 2 ± 1. 0 0. 5 ± 1. 5 0. 5 ± 0. 9 (Co nti nue s)
In te rv en tio n N o. Si te s O bs . p er io d (ye ar s) Re si du al PD C A L g ain PD red uc tion RE C in cre as e Re si du al RD D RD D red uc tion RB L g ain PD chang e C A L c ha ng e RD D ch ang e RB L ch ang e N ic kl es e t a l., 2 00 9 10 >5 4. 5 ± 1. 4 2. 9 ± 2. 2 4. 2 ± 2. 5 1. 3 ± 1. 8 −0 .2 ± 2 .0 0. 4 ± 1. 2 Pe ts os e t a l., 2 01 9 10 4. 9 ± 1. 8 3. 8 ± 2. 7 4. 8 ± 3. 4 1. 0 ± 2. 1 0. 5 ± 0. 4 0. 30 ± 0 .2 Pr et zl e t a l., 2 00 8_ I a 8 5. 2 ± 1. 9 1. 5 ± 1. 2 2. 4 ± 1. 6 0. 7 ± 1. 8 −2 .3 ± 1 .6 1. 7 ± 1. 3 Pr et zl e t a l., 2 00 8_ II a 8 3. 6 ± 1. 0 3. 5 ± 2. 5 4. 2 ± 2. 5 0. 7 ± 1. 7 −0 .2 ± 1 .8 −0 .2 ± 2 .0 Pr et zl e t a l., 2 00 9_ I a 9 4. 6 ± 2. 5 2. 4 ± 1. 7 3. 2 ± 1. 3 0. 7 ± 2. 3 3. 5 ± 1. 6 2. 2 ± 2. 0 1. 7 ± 1. 5 2. 0 ± 2. 6 1. 6 ± 2. 5 −0 .1 ± 1 .8 −0 .2 ± 1 .6 Pr et zl e t a l., 2 00 9_ II a 9 4. 3 ± 1. 9 2. 4 ± 1. 8 3. 2 ± 2. 3 0. 7 ± 1. 8 3. 7 ± 3. 0 1. 7 ± 2. 8 1. 2 ± 2. 5 1. 2 ± 2. 1 1. 4 ± 1. 5 0. 0 ± 2. 5 0. 5 ± 2. 6 Sc ul ea n e t a l., 2 00 6 10 4. 5 ± 0. 8 2. 9 ± 1. 3 3. 7 ± 0. 9 0. 8 ± 1. 5 0. 9 ± 0. 7 0. 1 ± 1. 1 Sc ul ea n, K is s, e t a l., 2 00 8 10 5. 0 ± 1. 0 2. 8 ± 1. 2 3. 4 ± 1. 5 0. 6 ± 1. 4 0. 8 ± 1. 2 0. 4 ± 1. 2 St av ro po ul os & K ar rin g, 2 01 0 12 5. 8 ± 1. 9 2. 4 ± 2. 1 3. 0 ± 1. 8 0. 6 ± 2. 0 1. 7 ± 1. 8 4. 2 ± 2. 0 3. 6 ± 2. 4 1. 0 ± 1. 7 0. 6 ± 2. 1 −0 .7 ± 2 .1 −0 .4 ± 2 .3 C or te lli ni e t a l., 2 01 7_ I ab 13 2. 9 ± 0. 9 5. 2 ± 2. 6 5. 2 ± 2. 6 0. 1 ± 1. 2 0. 9 ± 0. 9 0. 1 ± 1. 0 C or te lli ni e t a l., 2 01 7_ II b 12 3. 6 ± 1. 0 3. 6 ± 2. 3 4. 6 ± 2. 3 1 ± 1. 0 1. 0 ± 0. 8 0. 5 ± 0. 5 G TR + B C C et in ka ya e t a l., 2 01 4 c 11 4. 7 ± 0. 8 2. 4 ± 0. 9 2. 9 ± 0. 9 0. 5 ± 1. 2 3. 5 ± 2. 1 EM D B hu td a & D eo , 2 01 3 15 3 – 5 3. 4 ± 0. 6 3. 2 ± 0. 9 3. 8 ± 1. 1 0. 7 ± 0. 0 1. 6 ± 0. 7 3. 2 ± 0. 6 0. 3 ± 0. 8 0. 8 ± 1. 1 C re a e t a l., 2 00 8 19 3. 5 ± 0. 8 2. 5 ± 1. 2 3. 2 ± 1. 3 0. 6 ± 1. 2 2. 0 ± 0. 7 2. 7 ± 1. 0 0. 3 ± 0. 8 0. 4 ± 0. 8 −0 .4 ± 0 .8 H ei jl e t a l., 1 99 7 27 4. 6 ± 1. 0 2. 2 ± 1. 1 3. 1 ± 1. 0 2. 6 ± 1. 7 H of fm an n e t a l., 2 01 5 15 3. 3 ± 1. 9 3. 8 ± 2. 2 3. 9 ± 2. 3 0. 1 ± 2. 9 −0 .4 ± 1 .8 −1 .8 ± 2 .7 O gi ha ra & T ar no w , 2 01 4 23 3. 6 ± 0. 5 3. 0 ± 1. 3 3. 1 ± 0. 7 −0 .1 ± 0 .8 3. 3 ± 1. 3 0. 2 ± 0. 5 0. 0 ± 0. 9 0. 0 ± 0. 8 Pi et ru sk a e t a l., 2 01 2 12 4. 4 ± 0. 8 3. 2 ± 1. 3 4. 4 ± 0. 9 1. 2 ± 0. 9 0. 3 ± 0. 7 0. 3 ± 1. 1 Sc ul ea n e t a l., 2 00 1 a 12 4. 7 ± 1. 2 3. 0 ± 1. 9 3. 4 ± 1. 6 0. 4 ± 1. 0 0. 9 ± 1. 2 0. 4 ± 1. 7 Sc ul ea n e t a l., 2 00 4 a 11 3. 9 ± 1. 5 2. 9 ± 1. 6 4. 3 ± 1. 7 1. 3 ± 0. 7 0. 3 ± 1. 5 0. 5 ± 1. 4 Sc ul ea n, P ie tr us ka , e t a l., 2 00 7 13 4. 4 ± 0. 6 3. 4 ± 1. 4 4. 2 ± 0. 8 0. 9 ± 1. 1 0. 5 ± 0. 6 0. 3 ± 1. 0 Sc ul ea n e t a l., 2 00 6 10 4. 7 ± 1. 2 2. 8 ± 1. 4 3. 4 ± 1. 0 0. 6 ± 1. 0 0. 7 ± 1. 1 0. 4 ± 1. 5 Sc ul ea n, K is s, e t a l., 2 00 8 10 4. 8 ± 1. 1 2. 9 ± 1. 4 3. 6 ± 1. 7 0. 7 ± 1. 2 0. 5 ± 1. 2 0. 5 ± 1. 4 G TR + G ra ft in g C et in ka ya e t a l., 2 01 4 11 3 – 5 4. 1 ± 0. 6 2. 6 ± 1. 1 3. 5 ± 0. 9 0. 8 ± 0. 8 3. 0 ± 2. 2 G or sk i e t a l., 2 02 0_ I 14 3. 6 ± 1. 3 4. 8 ± 1. 7 3. 9 ± 1. 2 0. 7 ± 0. 7 0. 6 ± 0. 5 5. 1 ± 1. 3 5. 1 ± 1. 3 0. 3 ± 1. 3 −0 .0 7 ± 1. 3 0. 06 ± 0 .3 0. 01 ± 0 .3 G or sk i e t a l., 2 02 0_ II 13 3. 8 ± .1 .0 4. 0 ± 1. 7 3. 3 ± 1. 7 0. 6 ± 0. 9 0. 7 ± 0. 4 4. 3 ± .1 .6 4. 4 ± 1. 6 0. 1 ± 1. 6 0. 6 ± 0. 9 0. 1 ± 0. 4 −0 .0 7 ± 0. 5 Sc ul ea n, S ch w ar z, e t a l., 2 00 7 10 4. 3 ± 0. 8 3. 7 ± 1. 1 4. 8 ± 1. 6 1. 1 ± 1. 2 0. 6 ± 0. 7 0. 3 ± 0. 6 Ta bl e 2 ( C on tin ue d) (Co nti nue s)
In te rv en tio n N o. Si te s O bs . p er io d (ye ar s) Re si du al PD C A L g ain PD red uc tion RE C in cre as e Re si du al RD D RD D red uc tion RB L g ain PD chang e C A L c ha ng e RD D ch ang e RB L ch ang e N yg aa rd -Ø st by e t a l., 2 01 0 13 >5 3. 4 ± 1. 1 3. 8 ± 1. 8 4. 2 ± 1. 8 0. 7 ± 1. 1 O rs in i e t a l., 2 00 8 12 4. 4 ± 1. 1 2. 5 ± 1. 2 3. 3 ± 1. 6 0. 7 ± 1. 2 St av ro po ul os & K ar rin g, 20 10 _III a 8 4. 9 ± 1. 3 2. 3 ± 2. 1 3. 6 ± 1. 2 1. 3 ± 1. 6 1. 2 ± 2. 2 3. 8 ± 2. 1 3. 7 ± 2. 4 0. 3 ± 1. 2 0. 2 ± 2. 3 −1 .4 ± 1 .8 −0 .9 ± 2 .1 St av ro po ul os & K ar rin g, 20 10 _I V ¢ 7 4. 6 ± 1. 2 4. 1 ± 1. 6 4. 7 ± 1. 2 0. 6 ± 1. 4 1. 7 ± 2. 4 3. 9 ± 2. 5 4. 4 ± 2. 4 0. 4 ± 1. 1 0. 0 ± 1. 7 −0 .4 ± 2 .4 −0 .2 ± 2 .3 EM D + G ra ft in g D ör i, A rw ei le r, H ús zá r, e t a l., 20 13 _I 12 3 – 5 3. 8 ± 1. 3 4. 3 ± 1. 6 5. 0 ± 1. 8 0. 7 ± 1. 3 0. 5 ± 1. 2 −0 .3 ± 1 .4 H of fm an n e t a l., 2 01 5 15 3. 3 ± 1. 3 4. 1 ± 3. 6 3. 9 ± 2. 0 −0 .2 ± 2 .3 −0 .5 ± 1 .7 −2 .0 ± 2 .8 O gi ha ra & T ar no w , 2 01 4_ II e 21 2. 1 ± 0. 4 4. 2 ± 1. 1 4. 4 ± 0. 9 0. 3 ± 0. 8 4. 2 ± 2. 4 −0 .1 ± 0 .4 0. 0 ± 0. 7 0. 0 ± 0. 9 O gi ha ra & T ar no w , 2 01 4_ III a e 23 2. 7 ± 0. 5 3. 6 ± 1. 2 3. 7 ± 0. 7 0. 1 ± 0. 8 4. 3 ± 2. 3 0. 0 ± 0. 5 −0 .1 ± 0 .6 0. 0 ± 0. 9 Pi et ru sk a e t a l., 2 01 2 12 4. 7 ± 0. 8 3. 2 ± 1. 7 4. 1 ± 1. 3 0. 9 ± 1. 1 0. 4 ± 0. 9 0. 2 ± 1. 7 Sc ul ea n, P ie tr us ka , e t a l., 2 00 7 12 4. 5 ± 1. 0 3. 4 ± 1. 4 4. 1 ± 1. 0 0. 7 ± 0. 9 0. 4 ± 1. 0 0. 2 ± 1. 1 D ör i, A rw ei le r, S zá nt ó, e t a l., 20 13 _I a 11 >5 4. 1 ± 0. 9 3. 1 ± 1. 3 3. 9 ± 1. 1 0. 8 ± 0. 8 0. 6 ± 0. 9 0. 5 ± 1. 0 D ör i, A rw ei le r, S zá nt ó, e t a l., 20 13 _I I a 11 4. 1 ± 0. 9 3. 0 ± 1. 5 4. 0 ± 1. 2 1. 0 ± 0. 7 0. 8 ± 0. 8 0. 7 ± 1. 3 EM D + G TR Sc ul ea n e t a l., 2 00 4 a 10 3–5 4. 4 ± 1. 0 4. 0 ± 1. 0 2. 6 ± 0. 7 1. 5 ± 0. 7 0. 4 ± 0. 9 0. 4 ± 0. 9 Sc ul ea n, K is s, e t a l., 2 00 8 9 >5 5. 1 ± 1. 2 3. 5 ± 1. 4 2. 9 ± 1. 2 0. 6 ± 1. 1 1. 0 ± 1. 3 0. 4 ± 1. 2 EM D + G ra ft in g + B C D ör i, A rw ei le r, H ús zá r, e t a l., 20 13 _I I c 12 3 – 5 3. 8 ± 1. 1 4. 3 ± 1. 6 4. 9 ± 1. 5 0. 6 ± 1. 4 0. 6 ± 1. 1 −0 .4 ± 1 .5 N ote : C ha ng es r eg ar d c om pa ris on s w ith 1 y ea r d at a. A bb re vi at io ns : B C , b lo od -d er iv ed g ro w th f ac to r c on st ru ct s; C A L, c lin ic al a tt ac hm en t l ev el ; C I, c on fid en ce i nt er va l; E M D , e na m el m at rix d er iv at iv es ; G TR , g ui de d t is su e r eg en er at io n; O bs ., o bs er va tio n; O FD , o pe n f la p d eb rid em en t; P D , p ro bi ng p oc ke t d ep th ; R B L, r ad io gr ap hi c b on e l ev el ; R D D , r ad io gr ap hi c d ef ec t d ep th ; R EC , g in gi va l r ec es si on . aSt ud ie s/ gr ou ps n ot c on tr ib ut in g w ith d at a i n t he n et w or k m et a-an al ys es . bD at a r ec al cu la te d t o e xc lu de p at ie nt s t ha t w er e r e-op er at ed d ur in g t he o bs er va tio n t im e. cBlo od c on st ru ct a s a dj un ct ; dRe co m bi na nt g ro w th f ac to r a s a dj un ct ; eLo ca l a nt ib io tic a s a dj un ct . Ta bl e 2 ( C on tin ue d)
Several of the studies reported that some of the CAL gain achieved post-operatively was lost during the years; in general, the extent of CAL loss was relatively limited and regarded only a fraction of the treated teeth. Partial loss of the CAL gain obtained 1 year after GTR treatment has been previously associated with smoking, poor oral hygiene and lack of compliance with a supportive peri-odontal programme (Cortellini et al., 1994, 1996; Weigel et al., 1995; Cortellini & Tonetti, 2004). In perspective, disease recurrence and tooth loss following periodontal therapy are, in general, not solely associated with the treatment approach, but are also related to pa-tient compliance, including supportive periodontal therapy and/or general dental care (Löe et al., 1978; Axelsson et al., 2004; Matuliene et al., 2010); the majority of studies herein report that the patients
received long-term maintenance at specialist public/private centres, and thus, generalizability of the results may not be applicable to all clinical settings.
NMA allows for assumptions on the relative effectiveness of various treatments, even in the absence of direct comparisons. According to the NMA, combination approaches (e.g. GTR + graft-ing, EMD + grafting) appeared more efficacious comparing to monotherapies, that is, combination approaches presented with relatively shallower residual PD and larger CAL gain. Indeed, the only groups—out of the various regenerative/reconstructive ap-proaches herein—with average residual PD ≥5 mm, represented a monotherapy (i.e. GTR); in contrast, in none of the 13 groups representing various combination approaches was that the case
F I G U R E 2 a and b. Networks for residual PD and CAL gain. Only about 33% of the comparisons among the various interventions were
direct comparisons
F I G U R E 1 a and b. Forest plots of the various studies included in the NMA arranged per comparison of interventions and order by year of
TA B LE 3 A L ea gu e t ab le f or r es id ua l P D . M ea n d iff er en ce s ( in m m ) w ith 9 5% c re di bl e i nt er va ls ( re ad a s r ow v er su s c ol um n) a m on g i nt er ve nt io ns , o rd er ed f ro m b es t t o w or st a cc or di ng t o t he m ea n S U C R A v al ue s p rov id ed i n t he d ia go na l G ra ft in g + B C G TR + G ra ft in g EM D + G ra ft in g EM D + G ra ft in g + B C G raf tin g EM D G TR + B C G TR O FD G ra ft in g + B C 92 % −1 .0 3 ( −2 .7 7, 0 .7 7) −1 .1 6 ( −3 .2 6, 0 .8 9) −1 .1 6 ( −3 .8 9, 1 .5 2) −1 .3 1 ( −2 .78 , 0.1 5) −1 .5 1 ( −3 .4 4, 0. 39) −1 .6 8 ( −3 .9 8, 0. 67 ) −1 .7 7 ( −3 .6 1, 0.0 8) −2 .3 7 ( −4 .2 0, −0 .55 ) G TR + G ra ft in g 68% −0 .1 3 ( −1 .6 4, 1 .2 8) −0 .1 4 ( −2 .4 4, 2 .0 9) −0 .2 9 ( −1 .3 1, 0. 68) −0 .4 9 ( −1 .7 4, 0.7 0) −0 .6 6 ( −2 .1 6, 0. 84) −0 .7 4 ( −1 .8 6, 0. 34) −1 .3 4 ( −2 .4 2, −0 .32 ) EM D + G ra ft in g 63% −0 .0 02 ( −1 .7 3, 1 .7 3) −0 .1 6 ( −1 .6 0, 1. 33) −0 .3 5 ( −1 .1 3, 0. 46) −0 .5 2 ( −2 .5 6, 1. 62 ) −0 .6 1 ( −1 .7 0, 0. 53) −1 .2 1 ( −2 .3 0, −0.0 7) EM D + G ra ft in g + B C 58% −0 .1 5 ( −2 .4 0, 2.1 5) −0 .3 5 ( −2 .2 4, 1. 56) −0 .5 2 ( −3 .2 0, 2. 24 ) −0 .6 1 ( −2 .6 4, 1. 47 ) −1 .2 1 ( −3 .2 5, 0. 86) G raf tin g 53% −0 .2 0 ( −1 .4 3, 1. 03) −0 .3 7 ( −2 .1 4, 1. 47 ) −0 .4 5 ( −1 .5 6, 0. 66 ) −1 .0 6 ( −2 .1 4, 0.0 3) EM D 43% −0 .1 7 ( −2 .0 6, 1. 80 ) −0 .2 5 ( −1 .0 3, 0. 54) −0 .8 6 ( −1 .6 2, −0.0 8) G TR + B C 37 % −0 .0 8 ( −1 .9 7, 1. 75 ) −0 .6 9 ( −2 .5 5, 1.1 2) G TR 30% −0 .6 0 ( −1 .3 5, 0. 14 ) O FD 6% N ote : I nt er ve nt io ns a re r ep or te d i n o rd er o f t he ir r an ki ng , t ha t i s, t he l ar ge r t he m ea n S U C R A v al ue , t he b et te r t he t re at m en t. C om pa ris on s b et w ee n i nt er ve nt io ns s ho ul d b e r ea d f ro m l ef t t o r ig ht a nd th e e st im at e i n t he c el l r ef er s t o t he r ow -d ef in in g i nt er ve nt io n a ga in st t he c ol um n-de fin in g i nt er ve nt io n. M ea n d iff er en ce s ( M D ) l ow er t ha n 0 f av ou rs t he r ow -d ef in in g i nt er ve nt io n. T o o bt ai n M D f or co m pa ris on s i n t he o pp os ite d ire ct io n, n eg at iv e v al ue s s ho ul d b e c on ve rt ed i nt o p os iti ve v al ue s, a nd v ic e v er sa . R es ul ts t ha t i nd ic at e s tr on g e vi de nc e i n f av ou r o f t he r ow -d ef in in g i nt er ve nt io n ( i.e . t he re sp ec tiv e 9 5% c re di bl e i nt er va l d oe s n ot i nc lu de t he ze ro v al ue o f n o d iff er en ce ) a re u nd er lin ed . A bb re vi at io ns : B C , b lo od -d er iv ed g ro w th f ac to r c on st ru ct s; E M D , e na m el m at rix d er iv at iv es ; G TR , g ui de d t is su e r eg en er at io n; O FD , o pe n f la p d eb rid em en t; P D , p ro bi ng p oc ke t d ep th ; S U C R A , s ur fa ce un de r t he c um ul at iv e r an ki ng .
TA B LE 3 B L ea gu e t ab le f or C A L g ai n. M ea n d iff er en ce s i n m m w ith 9 5% c re di bl e i nt er va ls ( re ad a s r ow v er su s c ol um n) a m on g i nt er ve nt io ns , o rd er ed f ro m b es t t o w or st a cc or di ng t o t he m ea n S U C R A v al ue s p rov id ed i n t he d ia go na l G ra ft in g + B C G TR + G ra ft in g G TR + B C EM D + G ra ft in g EM D + G ra ft in g + B C G raf tin g G TR EM D O FD G ra ft in g B C 87 % 0. 53 ( −1 .0 9, 2 .1 2) 0. 81 ( −1 .5 5, 3. 14 ) 0. 96 ( −1 .0 9, 3 .0 2) 0. 96 ( −1 .9 1, 3 .8 3) 1. 19 ( 0. 05 , 2. 34) 1. 31 ( −0 .4 0, 2.9 9) 1. 40 ( −0 .4 0, 3.1 8) 2. 66 ( 1. 00 , 4. 33) G TR + G ra ft in g 73 % 0. 28 ( −1 .4 2, 2. 00) 0. 43 ( −1 .2 4, 2 .1 5) 0. 42 ( −2 .1 9, 3 .0 9) 0. 65 ( −0 .4 6, 1. 81 ) 0. 78 ( −0 .4 8, 2. 04) 0. 86 ( −0 .4 9, 2. 24 ) 2. 13 ( 0. 97 , 3. 31 ) G TR + B C 59 % 0. 15 ( −2 .2 3, 2 .5 8) 0. 14 ( −2 .9 6, 3 .3 1) 0. 37 ( −1 .6 5, 2. 44) 0. 49 ( −1 .6 2, 2. 61 ) 0. 58 ( −1 .5 7, 2.7 8) 1. 84 ( −0 .1 9, 3.9 3) EM D + G ra ft in g 57 % −0 .0 03 ( −2 .0 2, 2 .0 1) 0. 23 ( −1 .4 8, 1.9 3) 0. 35 ( −1 .0 2, 1. 68) 0. 44 ( −0 .5 8, 1. 42 ) 1. 70 ( 0. 37 , 3. 02) EM D + G ra ft in g + B C 54 % 0. 23 ( −2 .4 2, 2. 86) 0. 35 ( −2 .1 0, 2. 75 ) 0. 44 ( −1 .8 3, 2. 68) 1. 70 ( −0 .7 1, 4. 11 ) G raf tin g 44 % 0. 12 ( −1 .1 5, 1. 36) 0. 21 ( −1 .1 8, 1. 58) 1. 47 ( 0. 26 , 2. 67 ) G TR 39 % 0. 09 ( −0 .8 0, 0.9 9) 1. 35 ( 0. 48 , 2. 25 ) EM D 35% 1. 26 ( 0. 41 , 2. 14 ) O FD 2% N ote : I nt er ve nt io ns a re r ep or te d i n o rd er o f t he ir r an ki ng , t ha t i s t he l ar ge r t he m ea n S U C R A v al ue , t he b et te r t he t re at m en t. C om pa ris on s b et w ee n i nt er ve nt io ns s ho ul d b e r ea d f ro m l ef t t o r ig ht a nd th e e st im at e i n t he c el l r ef er s t o t he r ow -d ef in in g i nt er ve nt io n a ga in st t he c ol um n-de fin in g i nt er ve nt io n. M ea n d iff er en ce s ( M D s) l ar ge r t ha n 0 f av ou r t he r ow -d ef in in g i nt er ve nt io n. T o o bt ai n M D s f or co m pa ris on s i n t he o pp os ite d ire ct io n, n eg at iv e v al ue s s ho ul d b e c on ve rt ed i nt o p os iti ve v al ue s, a nd v ic e v er sa . R es ul ts t ha t i nd ic at e s tr on g e vi de nc e i n f av ou r o f t he r ow -d ef in in g i nt er ve nt io n ( i.e . t he re sp ec tiv e 9 5% c re di bl e i nt er va l d oe s n ot i nc lu de t he ze ro v al ue o f n o d iff er en ce ) a re u nd er lin ed . A bb re vi at io ns : B C , b lo od -d er iv ed g ro w th f ac to r c on st ru ct s; C A L, c lin ic al a tt ac hm en t l ev el ; E M D , e na m el m at rix d er iv at iv es ; G TR , g ui de d t is su e r eg en er at io n; O FD , o pe n f la p d eb rid em en t; C A L, c lin ic al at ta ch m en t l ev el ; S U C R A , s ur fa ce u nd er t he c um ul at iv e r an ki ng .
(Table 2). Comparatively, grafting + BC appeared to be the most ef-fective treatment; however, this finding should be interpreted with much caution, since it is based on only two groups contributing with data [i.e. hydroxyapatite + platelet-rich plasma (PRP)—(Menezes & Rao, 2012); ß-tricalcium phosphate (ß-TCP) in combination with recombinant human platelet-derived growth factor (rhPDGF-B)— (Nevins et al., 2013)]. In context, a recent systematic review with meta-analysis revealed that grafting with adjunct use of PRP pro-vided an additional, yet small, benefit over grafting alone 6 to 12 months after treatment of intrabony defects, while only half of the included studies showed a positive effect of PRP (Hou et al., 2016). Similarly, only slightly larger CAL gain (0.3 mm) than that achieved with only use of ß-TCP has been reported in a meta-anal-ysis of the very few available short-term studies involving ß-TCP/ rhPDGF-B (Khoshkam et al., 2015). Further, proof-of-principle human histological studies (Ridgway et al., 2008) have not been convincing that periodontal regeneration can indeed be achieved
with ß-TCP/rhPDGF-B at a magnitude over than the limited extent achieved with sole ß-TCP implantation (Stavropoulos, Windisch, et al., 2011; Stavropoulos et al., 2010).
The finding that combination approaches yield better results are corroborated by results in preclinical in vivo and human his-tological studies, collectively presented in systematic reviews (Stavropoulos & Wikesjö, 2012; Ivanovic et al., 2014; Sculean et al., 2015). Specifically, combination of GTR or EMD with grafting results, in general, in larger amounts of periodontal regenera-tion and more predictable outcomes comparing to monothera-pies alone, whereas sole implantation of bone grafts/substitutes in periodontal defects does not predictably lead in substantial amounts of periodontal regeneration and a portion of the bone graft/substitute particles often remains encapsulated within gin-gival connective tissue. In this context, preclinical in vivo studies on periodontal wound healing/regeneration, conducted in the 1980 s-1990 s-2000 s, have clearly demonstrated that periodontal
F I G U R E 4 a and b. SUCRA plots illustrating the cumulative ranking probability of the various interventions for residual PD and CAL.
Interventions are arranged from the best intervention (upper left corner) to the worst (lower right corner)
F I G U R E 3 Rankograms illustrating the relative ranking probability of the various interventions for residual PD and CAL gain.