Preprint
This is the submitted version of a paper published in Nature Genetics.
Citation for the original published paper (version of record): Ärnlöv, J. (2014)
Defining the role of common variation in the genomic and biological architecture of adult human height.
Nature Genetics, 46(11): 1173-1186 http://dx.doi.org/10.1038/ng.3097
Access to the published version may require subscription. N.B. When citing this work, cite the original published paper.
Permanent link to this version:
Defining the role of common variation in the genomic and
biological architecture of adult human height
A full list of authors and affiliations appears at the end of the article.
Abstract
Using genome-wide data from 253,288 individuals, we identified 697 variants at genome-wide significance that together explain one-fifth of heritability for adult height. By testing different numbers of variants in independent studies, we show that the most strongly associated ~2,000, ~3,700 and ~9,500 SNPs explained ~21%, ~24% and ~29% of phenotypic variance. Furthermore, all common variants together captured the majority (60%) of heritability. The 697 variants clustered in 423 loci enriched for genes, pathways, and tissue-types known to be involved in growth and together implicated genes and pathways not highlighted in earlier efforts, such as signaling by fibroblast growth factors, WNT/beta-catenin, and chondroitin sulfate-related genes. We identified several genes and pathways not previously connected with human skeletal growth, including mTOR, osteoglycin and binding of hyaluronic acid. Our results indicate a genetic architecture for human height that is characterized by a very large but finite number (thousands) of causal variants.
Height is a classical polygenic trait that has provided general insights into the genetic architecture of common human traits and diseases, and into the prospects and challenges of different methods used to identify genetic risk factors. Studies consistently estimate that the additive genetic contribution to normal variation in adult height (“narrow sense heritability”) is approximately 80% 1–3. Previous analysis of genome-wide association studies (GWAS) of adult height showed that common variants together account for 50% of this heritable contribution to height variation4,5. The most recent GWAS of adult height identified 180 loci, which together highlighted many genes relevant to human skeletal growth that had not been implicated in previous studies6. Common variants in these loci, however, only accounted for 10% of the phenotypic variation (~12% of heritability). Here, we report results from a GWAS meta-analysis of adult height in 253,288 individuals of European ancestry. We show that additive contributions of fewer than 10,000 SNPs (at P<5×10⁻³) can account for 36% of the heritability of adult height. Variants reaching genome-wide
significance (P<5×10⁻⁸) in this larger study (697 SNPs) clustered in loci, were substantially enriched for regulatory variants, and implicated multiple known and previously unknown genes and pathways relevant to growth. More broadly, our results provide evidence that increasing GWAS sample sizes to the order of 100,000s, now plausible for many common
Users may view, print, copy, and download text and data-mine the content in such documents, for the purposes of academic research, subject always to the full Conditions of use:http://www.nature.com/authors/editorial_policies/license.html#terms
Correspondence to: Peter M Visscher; Joel N Hirschhorn; Timothy M Frayling.
HHS Public Access
Author manuscript
Nat Genet. Author manuscript; available in PMC 2015 May 01. Published in final edited form as:
Nat Genet. 2014 November ; 46(11): 1173–1186. doi:10.1038/ng.3097.
Author Manuscript
Author Manuscript
Author Manuscript
traits, will likely continue to identify the variants and loci that close the “missing heritability” gap, whilst improving knowledge of the biology of those traits.
Results
The overall analysis strategy is illustrated in Supplementary Figure 1. We first performed a GWAS meta-analysis of adult height using summary statistics from 79 studies consisting of 253,288 individuals of European ancestry (Online Methods). We identified 697 SNPs that reached genome-wide significance (P<5×10⁻⁸) using an approximate conditional and joint multiple-SNP (COJO) analysis7 in GCTA8 (Online Methods) which takes linkage
disequilibrium (LD) between SNPs into account (Supplementary Table 1; Supplementary Figs. 2–3). The 697 SNPs clustered in 423 loci, with a locus defined as one or multiple jointly associated SNPs located within ±1Mb of each other. Most of these 697 SNPs are uncorrelated although those in close physical proximity (e.g. < 1Mb) may be in partial LD (see Supplementary Table 1 for LD between adjacent pairs of the 697 SNPs). The clustering of signals was non-random (empirical enrichment of 1.4 fold, P<1×10⁻⁴) with 90, 26 and 31 loci containing 2, 3 and ≥4 signals respectively, (Supplementary Note and Supplementary Tables 1 and 2). We observed strong evidence of clustering of association signals within loci across a range of locus sizes, from 100kb to 1.25Mb, but the clustering was almost entirely driven by variants within 250kb of index SNPs (Supplementary Note and Supplementary Table 2). As shown in Figure 1 and Supplementary Figure 4, in some loci, multiple signals cluster tightly around a single gene, whereas in other cases, the clustering of associated variants is likely due to multiple different height-related genes being in close proximity. Of the 697 SNPs, 403 were represented on the Metabochip array9. Using data from 80,067 individuals genotyped on the Metabochip array from 37 independent studies, we observed very strong evidence of concordance of effect sizes between the Metabochip and GWAS samples (P = 1.9×10−160); and >99% of variants were directionally consistent between Metabochip and GWAS (Online Methods, Supplementary Note, and Supplementary Table 3).
We observed a large genome-wide ‘inflation’ factor of the test statistic for association even after we corrected each study’s test statistics by its individual inflation factor (single λGC = 1.94). At least two phenomena could have contributed to this observation. First, as described previously10, highly polygenic models of inheritance are expected to increase the genomic inflation factor to levels comparable to what we observe. Second, height is particularly susceptible to confounding by population ancestry (stratification), which can also lead to inflation of the test statistics. We addressed these possibilities by comparing our results with those obtained using more stringent corrections for stratification (linear mixed models), and with results obtained in subsets of studies in which a purely family-based analysis was feasible, and by performing a within-family prediction analysis which partitioned the variance in the genetic predictor into the contributions of true associations and population stratification.
Our linear mixed model (LMM) analyses, performed in a subset of 15 individual studies comprising 59,380 individuals, provided strong evidence that the inflated statistics were
Author Manuscript
Author Manuscript
Author Manuscript
driven predominantly by the highly polygenic nature of the trait. This approach utilizes a genomic relationship matrix (GRM) calculated through genome-wide SNP data to correct for distant relatedness between all pairs of individuals within a study. This resulted in a single λGC of 1.20. This value was entirely consistent with the single λGC of 1.20 obtained from the standard GWAS analysis of the same individuals and a single λGC of 1.94 obtained from the full 253,288 individuals (Supplementary Table 4). Because this approach may be overly conservative for a strongly genetic and highly polygenic trait, each study additionally repeated the analyses for each chromosome using a GRM generated from the remaining 21 chromosomes, or in the case of the largest study (WGHS) repeating the analysis for all odd numbered chromosomes using a GRM generated from the even numbered chromosomes and vice versa. The single λGC inflation factor for this analysis, 1.23, was also entirely consistent with the standard GWAS results (Online Methods, Supplementary Note, and Supplementary Table 4).
Our family based analyses also provided strong evidence that the inflated statistics are driven predominantly by the highly polygenic nature of height. We assessed whether variants that reached genome-wide significance after single GC correction replicated in family-based analyses of up to 25,849 samples (effective sample size 14,963, using methods that are immune to stratification (Online Methods, Supplementary Note, and Supplementary Tables 5 and 6). We identified genome-wide significant associations from a meta-analysis that excluded the family-based samples, and tested these associations for replication in the family-based samples; a lower rate of replication than expected could be due to inflation of effect sizes in the discovery sample from the “winner’s curse” and/or stratification. Of 416 genome-wide significant SNPs representing multiple signals selected after exclusion of family-based studies, 371 SNPs had a consistent direction of effect (compared with 208 expected by chance, and 400 expected in the absence of any inflation of estimated effect sizes), and 142 replicated with P<0.05 (compared with 21 expected by chance, and 210 expected in the absence of effect size inflation; Supplementary Table 5). These analyses (particularly the directional consistency) shows that most of the loci represent true
associations, but also shows that there is a modest inflation in the effect size estimates, due to stratification and/or the winner’s curse. To distinguish between these possibilities, we repeated this analysis, substituting for the family-based samples a random set of studies with similar total effective sample size. The number of replicating loci was only slightly lower in the family-based cohorts than in the random samples (Supplementary Table 5, 12–17 fewer replications attributable to stratification at different P-value thresholds). This indicates that most of the modest inflation in effect estimates is due to the winner’s curse, that a small amount of inflation is due to residual stratification, and that few (upper limit ~15–25; Supplementary Note and Supplementary Table 5) if any of the loci that reach genome-wide significance after single GC correction are likely to be complete false positives due to stratification (that is, no real association whatsoever with height).
Variance explained by SNPs at different significance levels
Having established that single GC correction is sufficient to identify SNPs that are likely to be truly associated with height, we next performed a series of analyses using GWAS data from five independent validation studies to quantify the fraction of phenotypic variance
Author Manuscript
Author Manuscript
Author Manuscript
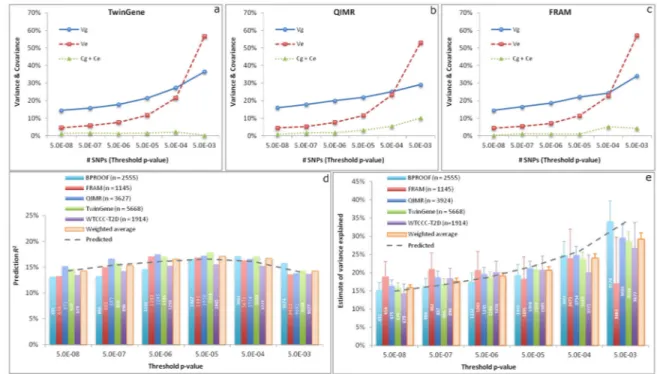
explained by SNPs selected from the GCTA-COJO analyses7 of the meta-analysis data, which excluded data from the validation studies, at a range of statistical thresholds, and to quantify the accuracy of predicting height using these selected SNPs (Online Methods). We first developed a new method that uses within-family prediction to partition the variance of the SNP-based predictor into components due to real SNP effects, errors in estimating SNP effects, and population stratification (Online Methods), and applied the method to data on full-sib pairs from three of the five validation studies (Online Methods). Consistently across the three studies, all the partitioned variance components increased as a less stringent significance level was used for SNP selection in the discovery sample and the error variance increased more dramatically than the genetic variance when more SNPs selected at a less significance level were included in the predictor (Fig. 2a–c). We demonstrated the partitioning of variance due to population stratification by the within-family prediction analyses with and without adjusting for principal components (PCs) (Supplementary Fig. 5). The results again confirmed that the impact of population stratification on the top associated SNPs was minor and demonstrated that the variation in the predictor due to true SNP effect, estimation error and population stratification was quantifiable. We next inferred, using these partitioned variance components from the within-family prediction analysis, how well different selected sets of SNPs would predict height in independent samples. We showed that the observed prediction accuracy (squared correlation between phenotype and predictor,
R2) in five different population-based cohorts was highly consistent with the values inferred from the within-family based analyses, with prediction accuracy peaking at ~17% using the ~1,900 SNPs reaching P<5×10⁻⁵ (Fig. 2d). Finally we estimated variance explained by the selected SNPs in population-based studies using the GCTA-GREML method4,8 (Fig. 2e). The results showed that ~670 SNPs at P<5×10⁻⁸ and ~9,500 SNPs at P<5×10⁻³ captured ~16% and ~29% of phenotypic variance respectively (Table 1), which was also consistent with the estimates inferred from the within-family prediction analysis. As shown in equation [19], prediction R2 is not equal to the variance explained but a function of the variance of true SNP effects and the error variance in estimating SNP effects, in the absence of population structure. This is demonstrated in Figure 2, where at thresholds below genome-wide significance, variance explained is higher than the prediction accuracy, because the latter is deflated both by imprecise estimates of effect sizes (estimation errors) and by inclusion of SNPs that are not associated with height. The estimate of variance explained by all the HapMap3 (ref. 11) SNPs without SNP selection was ~50% (Table 1), consistent with previous estimates4,5. Thus, a group of ~9,500 SNPs (representing <1% of common SNPs) selected at P<5×10⁻³, explained ~29% of phenotypic variance. Since ~50% of phenotypic variance is explained by all common SNPs, the selected set of SNPs, despite being limited to <1% of common SNPs, accounts for the majority of variance attributable to all common SNPs (29/50 ~ 60%). This set of ~9,500 SNPs strongly clustered with the newly established height loci: 1,704 (19%) variants were located within 250kb of one of the 697 genome-wide associated SNPs, suggesting that a substantial fraction of “missing heritability” is within already identified loci. This clustering of additional variants within identified loci was confirmed in a parallel analysis based on two left-out studies where we observed that SNPs in closer physical proximity with the top associated SNPs explained disproportionally more variance (Online Methods and Supplementary Fig. 6).
Author Manuscript
Author Manuscript
Author Manuscript
Larger GWAS identifies new biologically relevant genes and pathways
Having shown that ~1% of variants can account for the majority of heritability attributable to common variation, we next considered whether the expanded set of height-associated variants could be used to identify the genomic features and biological pathways of most relevance to normal variation in adult height. To test whether our GWAS could implicate new biology, we used established and novel approaches to test whether the height-associated loci were enriched for functionally relevant variants, genes, pathways, and tissues.
As with the 180 variants identified in our previous analysis, the 697 variants were non-randomly distributed with respect to functional and putatively functional regions of the genome (Online Methods). We observed that height associated variants were enriched for non-synonymous SNPs (nsSNPs) (empirical enrichment of 1.2 fold, P=0.02), cis-regulatory effects in blood (empirical enrichment of 1.5 fold, P=0.03), a curated list of genes that underlie monogenic syndromes of abnormal skeletal growth12 (empirical enrichment 1.4 fold, P=0.013), associations with apparently unrelated complex traits in the NHGRI GWAS catalog (empirical enrichment 2.6 fold, P<1×10⁻⁴) and functional chromatin annotations in multiple tissues and cell types (empirical enrichment 1.8 fold, P<1×10⁻³) (Supplementary Note and Supplementary Tables 7–11).
The greater resolution of height associated variants provided by increased sample size, combined with improved gene prioritization and gene set enrichment approaches, identified multiple new tissues, gene sets and specific genes that are highly likely to be involved in the biology of skeletal growth. Specifically, using a variety of established and novel pathway methods, we identified ~3 times as many enriched pathways and prioritized ~5 times as many genes (including genes newly prioritized in previously identified loci) compared to results derived from identical pathway methods to the previous GWAS of 133,000 individuals (Table 2).
We first focused on existing pathway and gene prioritization methods: (1) MAGENTA13, a method designed to identify gene sets enriched in GWAS data, and (2) GRAIL14, which uses published literature to highlight connections between likely relevant genes within GWAS loci. As expected, the GRAIL and MAGENTA analyses confirmed several previously identified gene sets and pathways clearly relevant to skeletal growth, but in the larger sample they also provided evidence for additional known and novel genes, gene sets and protein complexes not identified in our previous smaller study (for example, FGF signaling, WNT signaling, osteoglycin, and other genes related to bone or cartilage development) (Supplementary Tables 12–13 and Supplementary Fig. 7).
To obtain more detailed insight into height biology, we applied DEPICT, a novel data-driven integrative method that uses gene sets reconstituted based on large scale expression data to prioritize genes and gene sets, and also to identify tissues enriched in highly expressed genes from associated loci (Pers et al. in preparation; Online Methods and Supplementary Note). The DEPICT analysis highlighted 2,330 reconstituted gene sets (after pruning for high levels of redundancy). These gene sets both confirmed and extended the MAGENTA and GRAIL findings, and identified novel pathways not identified in our previous height GWAS (for example regulation of beta-catenin, biology related to
Author Manuscript
Author Manuscript
Author Manuscript
glycosaminoglycans such as chondroitin sulfate and hyaluronic acid, and mTOR signaling) (Supplementary Table 14). Gene sets identified based on 327 strictly novel height variants (>1Mb from the 180 known variants loci) highly resembled gene sets highlighted by the already known 180 loci (Spearman’s rank correlation coefficient between gene set enrichment Z-scores r=0.91, P=2×10⁻¹⁶). Thus, the variants discovered through increased sample size continued to highlight specific and relevant growth-associated gene sets, while the combined analysis of both old and new loci provided the additional power needed to identify new gene sets (Table 3 and Supplementary Table 14).
The DEPICT analysis also prioritized tissues and individual genes. We found that genes within associated height loci were enriched for expression in tissues related to chondrocytes (cartilage, joint capsule, synovial membrane, and joints; P<5.5×10⁻⁹, FDR<0.001), and other musculoskeletal, cardiovascular, and endocrine tissue-types (FDR<0.05) (Fig. 3; Supplementary Fig. 8; Supplementary Table 15). We also showed that a subset of the 697 height associated SNPs that represented lead cis-eQTLs in blood defined 75 genes that were collectively enriched for expression in cartilage (P=0.008) (Supplementary Note and Supplementary Table 8).
We used DEPICT to prioritize 649 genes (at FDR<0.05) within height-associated loci (Table 3 and Supplementary Table 16). Of these 649 genes, 202 genes (31%) were either
significant in the GRAIL analysis (Supplementary Tables 13 and 16) and/or overlapped with a list of abnormal skeletal growth syndromes that we assembled from the OMIM database12 (n=40; Supplementary Tables 9 and 16). Many other newly prioritized genes had additional supporting evidence (Supplementary Table 16), including specific expression in the growth plate12, and/or connections to relevant pathways (for example: GLI2 and LAMA5 [hedgehog signaling]; FRS2 [FGF signaling]; AXIN2, NFATC1, CTNNB1, FBXW11, WNT4, WNT5A and VANGL2 [WNT/beta-catenin signaling]; SMAD3 and MTOR [TGF-beta and/or mTOR signaling]; WWP2/miR140, IBSP, SHOX2 and SP3 [required in mice for proper bone and cartilage formation]; CHYS1, DSE and PCOLCE2 [glycosaminoglycan/collagen
metabolism]; SCARA3, COPZ2, TBX18, CRISPLD1 and SLIT3 [differential expression in growth plate and predicted to be in highly relevant pathways]).
DEPICT also prioritizes genes that are new candidates for playing a role in skeletal growth. The genes newly and strongly implicated in this study included not only genes with obvious relationships to skeletal biology, such as SOX5 and collagen genes, but also genes that have no clear published connection to skeletal growth, and likely represent as yet unknown biology (Table 3 and Supplementary Table 16). DEPICT strongly prioritized genes that do not have published annotations related to growth-related pathways but are predicted to be in gene sets that are both enriched in the associated loci and clearly connected to growth. These include genes newly predicted to be in pathways related to cartilage or bone development (FAM101A, CRISPLD1 and the noncoding RNA LINC00476), collagen or extracellular matrix (GLT8D2, CCDC3, and ZCCHC24), histone demethylation (ATAD2B and TSTD2) and other genes predicted to have skeletal phenotypes but not currently annotated as belonging to relevant pathways (ARSJ, PSKH1, COPZ2, ADAMTS17 and the microRNA cluster MIR17HG). Of note, mutations in both ADAMTS17 and MIR17HG have been identified as causes of syndromic short stature in humans15,16.
Author Manuscript
Author Manuscript
Author Manuscript
As suggested by the prioritization of ADAMTS17 and MIR17HG, it is possible that some of the newly highlighted genes may also underlie new syndromes of abnormal skeletal growth. As a further proof of principle, the second entry on our list of prioritized genes (Table 3 and Supplementary Table 16), CHSY1, was not a known monogenic gene in the OMIM
database12 when we assembled our list, but mutations in this gene have since been shown to cause a syndrome including brachydactyly and short stature17,18. Thus, the novel DEPICT method, applied to the larger GWAS data set, not only identified similar biology to GRAIL and MAGENTA but also implicated a large number of additional genes, gene sets and pathways that that are likely important in skeletal biology and human growth.
Discussion
By performing a large GWAS study on adult height, a highly heritable polygenic trait, we have provided answers to several current questions of relevance to the genetic study of polygenic diseases and traits. First, we showed that by conducting larger GWAS, we can identify SNPs that explain a substantial proportion of the heritability attributable to common variants. As hypothesized by Yang et al. (2010), the heritability directly accounted for by variants identified by GWAS and inferred by whole-genome estimation approaches are converging with increasing sample size. The variance explained by genome-wide significant SNPs has increased from 3–5% with discovery samples of ~25,000 (ref. 19) to 10% with a discovery sample size of ~130,000 (ref. 6) to 16% with a discovery sample size of 250,000 (this study), and the variance explained from all captured common SNPs is ~50%4,5. The variance explained by genome-wide significant SNPs on a chromosome is also proportional to its length, consistent with the conclusion made by Yang et al.5 using all SNPs
(Supplementary Fig. 9). Our new results show that ~21%, ~24% and ~29% of phenotypic variance in independent validation samples is captured by the best ~2,000, ~3,700 and ~9,500 SNPs respectively selected in the discovery samples (Table 1), and that the correlation between actual and predicted height in independent samples from the same population has increased to 0.41 (maximum prediction R2 = 0.412 = 0.17, Fig. 2d). The results are consistent with a genetic architecture for human height that is characterized by a very large but finite number (thousands) of causal variants, located throughout the genome but clustered in both a biological and genomic manner. Such a genetic architecture may be described as pseudo-infinitesimal, and may characterize many other polygenic traits and diseases. There is also strong evidence of multiple alleles at the same locus segregating in the population and for associated loci to overlap with Mendelian forms, suggesting a large but finite genomic mutational target for height, and effect sizes ranging from minute (<1mm; ~0.01 SDs) to gigantic (>300mm; >3 SDs, in the case of monogenic mutations). It has been argued that the biological information emerging from GWA studies will become less relevant as sample sizes increase, because as thousands of associated variants are discovered, the range of implicated genes and pathways will lose specificity and cover essentially the entire genome20. If this were the case, then increasing sample sizes would not help to prioritize follow up studies aimed at identifying and understanding new biology, and the associated loci would blanket the entire genome. Our study provides strong evidence to the contrary: the identification of many 100’s and even 1000’s of associated variants can continue to provide biologically relevant information. In other words, the variants identified
Author Manuscript
Author Manuscript
Author Manuscript
in larger sample sizes both display a stronger enrichment of pathways clearly relevant to skeletal growth and prioritize many additional new and relevant genes. Furthermore, the associated variants are often non-randomly and tightly clustered (typically separated by <250 kb), resulting in the frequent presence of multiple associated variants in a locus. The observations that genes and especially pathways are now beginning to be implicated by multiple variants suggests that the larger set of results retain biological specificity but that at some point, a new set of associated variants will largely highlight the same genes, pathways and biological mechanisms as have already been seen. This endpoint (which we have not clearly reached for height) could be considered analogous to reaching “saturation” in model organism mutagenesis screens, where new alleles typically map to previously identified genes21.
We have identified a large number of gene sets and pathways that are enriched for
associations with height. Although the number of gene sets and pathways is large, many are overlapping and likely represent multiple annotations of a much smaller set of core
biological mechanisms. We also highlight individual genes within associated loci as being relevant to skeletal growth, including candidates for contributing to syndromes of abnormal skeletal growth; for example, we strongly implicated CHSY1, recently identified as an underlying cause of a monogenic syndrome with short stature and brachydactyly17,18. The lists of prioritized genes and pathways should therefore provide a rich trove of data for future studies of skeletal growth; to facilitate such studies, we have made our results (including genome-wide association results and complete list of highlighted genes and pathways) publicly available. Based on the results of large genetic studies of height, we anticipate that increasing the number of associated loci for other traits and diseases could yield similarly rich lists that would generate new biological hypotheses and motivate future research into the basis of human biology and disease.
URLs
The Genetic Investigation of Anthropometric Traits (GIANT) Consortium, http:// www.broadinstitute.org/collaboration/giant/index.php/GIANT_consortium; The Mouse Genetics Initiative, www.informatics.jax.org
ONLINE METHODS
Genome-wide association study meta-analysis
We combined height summary association statistics from 79 genome-wide association (GWA) studies in a meta-analysis of 253,288 individuals using the same methods and studies as previously described6 and additional studies as described in Supplementary Tables 17–19. A total of 2,550,858 autosomal SNPs were meta-analyzed using inverse-variance fixed effects method using METAL22.
GCTA-COJO: conditional and joint multiple SNPs analysis
We used GCTA-COJO analysis7,8 to select the top associated SNPs. This method uses the summary statistics from the meta-analysis and LD correlations between SNPs estimated from a reference sample to perform a conditional association analysis7. The method starts
Author Manuscript
Author Manuscript
Author Manuscript
with an initial model of the SNP that shows the strongest evidence of association across the whole genome. It then implements the association analysis conditioning on the selected SNP(s) to search for the top SNPs one-by-one iteratively via a stepwise model selection procedure until no SNP has a conditional P-value that passes the significance level. Finally, all the selected SNPs are fitted jointly in the model for effect size estimation. We used 6,654 unrelated individuals from the ARIC cohort as the reference sample for LD estimation. There were ~3.0M SNPs included in the original meta-analysis. We included in this analysis only the SNPs (~2.48M) on HapMap2 and with sample size > 50,000. We used the genome-wide significance level P<5×10⁻⁸ (as reported in Supplementary Table 1).
Metabochip replication
We combined height summary association statistics from 37 independent studies genotyped using Illumina’s Metabochip array9 in a meta-analysis of 80,067 individuals of European ancestry (Supplementary Tables 20–22). Each study tested association between each genotyped SNP and the same QC procedures, height transformations, adjustment, and inheritance model as described for the GWA analysis. Genomic control correction was applied to results for each study prior to meta-analysis, using a set of 4,427 SNPs associated with QT interval to control study-specific inflation factors. We used the inverse-variance fixed effects meta-analysis method.
Validation – linear mixed model (LMM) based association analysis
Each of 15 studies (59,380 individuals) used genome-wide SNP information to calculate a genomic relationship matrix (GRM) for all pairs of individuals and used this to correct association statistics for cryptic relatedness and population stratification. Each study used a linear mixed model as implemented in the software EMMAX23. Meta-analysis was performed as described for the standard GWAS and using a single GC correction. Each study additionally repeated the analyses for each chromosome using a GRM generated from the remaining 21 chromosomes, or in the case of the largest study (WGHS) repeating the analysis for all odd numbered chromosomes using a GRM generated from the even numbered chromosomes and vice versa. Each study then combined association results from the 22 or 2 parts of the genome into one set of data and we repeated the single GC meta-analysis.
Validation – within family (transmission) association analyses
A pure transmission based analysis was performed in seven cohorts for SNPs representing 416 signals of association (Supplementary Note), selected after repeating meta-analysis excluding these studies, with single GC correction. Filtering of low imputation quality SNPs in the studies was followed by inverse variance method of meta-analysis of the family based results. Because of the presence of related individuals, family based studies have lower power at a given sample size. For each study, we calculated the effective sample size (the size of a sample of unrelated individuals that would have the equivalent power; see
Supplementary Note and Winkler et al. 24). Estimation of winner’s curse in our data set was performed by repeating the meta-analysis excluding either the family-based studies or excluding random sets of studies from GIANT matched by effective sample size to the
Author Manuscript
Author Manuscript
Author Manuscript
family based studies. Independent genome-wide significant loci were selected from each meta-analysis. Power for replication in the excluded samples was estimated at different P-value thresholds and the deficit in replications (number of replications expected minus number observed) was calculated. The contribution of the winner’s curse to the deficit in replications was estimated as the average deficit across the three sets of random non-family-based cohorts. By subtracting this from the deficit observed for the family-non-family-based cohorts, we estimated the lack of replication that could be attributed to stratification (either inflation of effect size for true associations, or false positive associations).
Variance and heritability explained
We used GCTA-COJO analysis (Online Methods) to select the top associated SNPs at a range of stringent significance levels (5×10⁻³, 5×10⁻⁴, 5×10⁻⁵, …, 5×10⁻⁸) for estimation and prediction analyses. We then quantified the variance explained by those selected SNPs using a three-stage analysis, i.e. within-family prediction, GCTA-GREML analysis and population based prediction, in five validation studies (B-PROOF, FRAM, QIMR, TwinGene and WTCCC-T2D). To avoid sample overlap, we repeated the main GWAS meta-analysis and the multiple-SNP analysis five times, each time excluding one of the five validation studies. This approach ensured complete independence between data used to discover SNPs, and data used to estimate how much variance in height these SNPs explained and how well they predicted height. For the within-family prediction analyses, we selected 1,622, 2,758 and 1,597 pairs of full sibs from the QIMR, TwinGene and FRAM cohorts, respectively, with one sib pair per family. For the whole-genome estimation and prediction analyses, we used GCTA-GRM8 to estimate the genetic relatedness between individuals and selected unrelated individuals with pairwise genetic relatedness <0.025 in each of the five studies, i.e. B-PROOF (n = 2,555), FRAM (n = 1,145), QIMR (n = 3,627), TwinGene (n = 5,668) and WTCCC-T2D (n = 1,914).
Within-family prediction analysis
We used the SNPs selected from GCTA-COJO analysis to create a genetic predictor (also called “genetic profile score”) for each of all the full sibs using PLINK25. We then adjusted the genetic predictor by the first 20 principal components (PCs) generated from the principal component analysis (PCA)26. By comparing the predictors within and between families, we partitioned the variance in the predictor analysis into components due to real SNP effects (Vg), errors in estimating SNP effects (Ve), and population structure (Cg + Ce), as described in the Online Methods below.
We calculated the weighted average of each of the four (co)variance components over the three cohorts by their sample size, i.e. Σi (Vg(i) ni)/Σi (ni) with the subscript i indicating the
cohort and n being the sample size. From the results of these partitioning analyses within families we can infer what the prediction R2 (Equation 19 in Online Methods below) and what the proportion of variance explained by SNPs (i.e. Vg/VP with VP being the phenotypic variance) would be in a sample of unrelated individuals when using the same set of SNPs. We then tested these inferred values in unrelated samples.
Author Manuscript
Author Manuscript
Author Manuscript
GCTA-GREML analysis
We performed the GREML analysis4 in GCTA8 to estimate the variance explained by the selected SNPs (h2g) in each of the five validation studies. This method fits the effects of a set of SNPs simultaneously in a model as random effects and estimates the genetic variance captured by all the fitted SNPs without testing the significance of association of any single SNPs. We combined the estimates of h2
g from the five studies by the inverse-variance approach, i.e. Σi (h2g(i)/SE2i)/Σi (1/SE2i).
Population-based prediction analysis
We created a genetic predictor using the selected SNPs for the unrelated individuals in each of the five validation studies. We then calculated the squared correlation (R2) between phenotype and predictor in each validation study, and calculated the weighted average of the prediction R2 by the sample size across the five studies, i.e. Σi (R2i ni)/Σi (ni).
Theory and method to partition the variance in a genetic predictor
Under the assumption of an additive genetic model, the phenotype of a quantitative trait can be written as
[1]
where y is the trait phenotype, g is the total genetic effect of all SNPs, x is an indicator variable for SNP genotypes, b is the SNP effect, and ε is the residual.
From this model, the additive genetic variance is
[2]
with the first component being the expected value of additive genetic variance under linkage equilibrium (LE) and second component being the deviation from the expected value could be caused by linkage disequilibrium (LD), population structure or selection27.
Considering a pair of full siblings in a family, the additive genetic covariance between the sibs is
[3]
For full sibs,
cov(x1i, x2i ) = ½var(xi ),
Author Manuscript
Author Manuscript
Author Manuscript
cov(x1i, x2j) = ½cov(xi, xj) for SNPs that are in LD, and
for SNPs that are not in LD (as shown by both empirical and simulation results).
Let | (SNPs are in LD), and
| (SNPs are not in LD but correlated due to population structure) Therefore, the genetic variance is
[4]
The genetic covariance between a pair of full-sibs is
[5]
If we take a set of SNPs with their effects estimated from GCTA-COJO analysis (Online Methods), and create a predictor using these SNPs in an independent validation sample, we can write the predictor as
[6]
where b̂ is the estimate of b with b̂ =b + e with e being the error in estimating b. If we assume b and e are independent and denote and
, the variance of the predictor is
[7]
The covariance between the predictors of a pair of full-sibs is
[8]
The covariance between the true phenotype and the predictor of a same individual is
Author Manuscript
Author Manuscript
Author Manuscript
[9]
The covariance between the true phenotype of one sib and the predictor of the other sib is
[10]
If we define Δĝ = ĝ1 − ĝ2 and Δy = y1 − y2,
[11]
[12] We therefore can calculate these four parameters as
[13]
[14]
[15]
[16]
where Vg can be interpreted as the variance explained by real SNP effects, Cg is the covariance between predictors attributed to the real effects of SNPs that are not in LD but correlated due to population stratification, Ve is the accumulated variance due to the errors in estimating SNP effects, and Ce is the covariance between predictors attributed to errors in estimating the effects of SNPs that are correlated due to population stratification.
To assess the prediction accuracy, we usually perform a regression analysis of the real phenotype against the predictor, i.e.
[17] so that the regression slope is actually
[18] with the regression R2 being
Author Manuscript
Author Manuscript
Author Manuscript
[19]
In the absence of population structure,
[20]
Variance explained by SNPs in proximity to the top associated SNPs
We performed analyses to quantify the variance explained by SNPs in close physical proximity to the top associated SNPs in 9,500 unrelated individuals (pairwise genetic relatedness < 0.025) from a combined dataset of the QIMR and TwinGene cohorts. As in previous analyses, to avoid sample overlap between discovery and validation studies, we repeated the discovery meta-analysis excluding the QIMR and TwinGene cohorts, and identified 643 genome-wide significant SNPs from the GCTA-COJO analysis of the summary statistics using ARIC data for LD estimation. We used GCTA-GREML analysis4,8 to quantify the phenotypic variance explained by all the common SNPs (MAF > 0.01) within 100Kb, 500Kb or 1Mb of the 643 genome-wide significant SNPs. We show in
Supplementary Figure 6a that there are 104K, 423K and 745K SNPs within 100Kb, 500Kb and 1Mb of the top associated SNPs, which explain 20.8% (s.e. = 1.3%), 25.7% (s.e. = 1.8%) and 29.5% (s.e. = 2.2%) of phenotypic variance, respectively. We then applied a regression-based approach28 to adjust for LD between SNPs. The estimates of variance explained after LD-adjustment were slightly higher than those without adjustment, and the ratio of between the estimates with and without LD-adjustment was consistently ~1.05 regardless of the window size (Supplementary Fig. 6a). However, the difference is small. We then sought to investigate whether or not there is an enrichment of additional association signals at the top associated loci. We varied the window size from 20Kb to 50Kb, 100Kb, 150Kb, 200Kb, 300Kb, 400Kb, 500Kb, 750Kb and 1Mb, and fitted a two-component model in GCTA-GREML analysis, with the first component being the top associated SNPs and the second component being the rest of SNPs within the window. We found that the per-SNP variance explained excluding the top SNPs (variance explained by the second component divided by the number of SNPs included in this component) decreased with the size of window (Supplementary Fig. 6b), implying that SNPs in closer physical proximity to the top associated SNPs tend to explain disproportionally more variance.
Enrichment of associated SNPs in ENCODE regions, loci containing OMIM genes, eQTLs and nsSNPs
To identify putative causal variants among the height-associated markers, we explored whether the height-associated SNPs were in strong LD (r2>0.8) with non-synonymous coding variants in 1000 Genomes Project CEU Phase 1 data, showed an effect on whole blood gene expression levels, were located within ENCODE-annotated regions, were within loci harboring monogenic growth genes, or had previously been associated with other complex traits in NHGRI GWAS catalog (P<5×10⁻⁸) (Supplementary Tables 7–11). To estimate the empirical assessment of enrichment for listed features we used 10,000
Author Manuscript
Author Manuscript
Author Manuscript
permutations of random sets of SNPs matched to the pruned (LD r2>0.1) 628 height-associated SNPs by the number of nearby genes (within a distance of LD r2>0.5), physical distance to nearest gene, and minor allele frequency.
Enrichment of genes in associated loci in known and novel pathways
Data-Driven Expression-Prioritized Integration for Complex Traits (DEPICT) analysis—The DEPICT method (T.H.P. et al., unpublished data; see Geller et al.29 for an earlier application of DEPICT) relies on pre-computed predictions of gene function based on a heterogeneous panel of 77,840 expression arrays (Fehrmann et al., manuscript in review; ref. 30), 5,984 molecular pathways (based on 169,810 high-confidence experimentally derived protein-protein interactions31), 2,473 phenotypic gene sets (based on 211,882 gene-phenotype pairs from the Mouse Genetics Initiative (see URLs)), 737 Reactome pathways32, 5,083 Gene Ontology terms14, and 184 KEGG pathways33. The method leverages these predictions to extend the functional annotations of genes, including genes that previously had only a few or no functional annotations. DEPICT facilitates the analysis of GWAS data by (1) assessing whether genes in associated loci are enriched in tissue-specific expression, (2) identifying reconstituted gene sets that are enriched in genes from associated loci, and (3) systematically identifying the most likely causal gene(s) at a given locus (see
Supplementary Note for a more detailed description of DEPICT). In order to run DEPICT, we first clumped the summary statistics from the meta-analysis using 500kb flanking regions, r2>0.1, and excluded SNPs with P≥5×10⁻⁸, which resulted in 628 SNPs. We then mapped genes to each of the 628 best-associated SNPs. For a given SNP, this was
accomplished by including all genes that resided within LD r2>0.5 boundaries of that SNP, and always including the nearest gene, to its locus gene set. We used a locus definition that was calibrated using the GWAS data for height levels presented in this paper and optimized capture of known monogenic genes for those traits. We merged overlapping loci, and excluded loci that mapped near or within the major histocompatibility complex locus (chromosome 6, location: 20 to 40 Mb), which resulted in a list of 566 non-overlapping loci that were used as input to DEPICT. HapMap Project Phase II CEU genotype data was used for all LD calculations.
GRAIL and MAGENTA analysis—The GRAIL14 algorithm was run using the LD pruned (r2>0.1) 628 SNPs without correcting for gene size, and using text-mining data up to December 2006 (default setting). MAGENTA13 was run with the single genomic control adjusted summary statistics as input using default settings and excluding the HLA region.
Supplementary Material
Refer to Web version on PubMed Central for supplementary material.
Authors
Andrew R Wood1,*, Tonu Esko2,3,4,5,*, Jian Yang6,7,*, Sailaja Vedantam3,4,*, Tune H Pers3,4,5,8,*, Stefan Gustafsson9,10,*, Audrey Y Chu11, Karol Estrada4,12,13, Jian’an Luan14, Zoltán Kutalik15,16,17, Najaf Amin18, Martin L Buchkovich19, Damien C Croteau-Chonka19,20, Felix R Day14, Yanan Duan21, Tove Fall9,10,22, Rudolf
Author Manuscript
Author Manuscript
Author Manuscript
Fehrmann23, Teresa Ferreira24, Anne U Jackson25, Juha Karjalainen23, Ken Sin Lo26, Adam E Locke25, Reedik Mägi2,24, Evelin Mihailov2,27, Eleonora Porcu28, Joshua C Randall24,29, André Scherag30,31, Anna AE Vinkhuyzen6, Harm-Jan Westra23, Thomas W Winkler32, Tsegaselassie Workalemahu33, Jing Hua Zhao14, Devin Absher34, Eva Albrecht35, Denise Anderson36, Jeffrey Baron37, Marian Beekman38,39, Ayse Demirkan18,40, Georg B Ehret41,42, Bjarke Feenstra43, Mary F Feitosa44, Krista Fischer2, Ross M Fraser45, Anuj Goel24,46, Jian Gong47, Anne E Justice48, Stavroula Kanoni49, Marcus E Kleber50,51, Kati Kristiansson52, Unhee Lim53, Vaneet Lotay54, Julian C Lui37, Massimo Mangino55, Irene Mateo Leach56, Carolina Medina-Gomez12,57,58, Michael A Nalls59, Dale R Nyholt60, Cameron D Palmer3,4, Dorota Pasko1, Sonali Pechlivanis30, Inga Prokopenko24,61,62, Janina S Ried35, Stephan Ripke13,63, Dmitry Shungin64,65,66, Alena Stancáková67, Rona J Strawbridge68, Yun Ju Sung69, Toshiko Tanaka70, Alexander Teumer71, Stella Trompet72,73, Sander W van der Laan74, Jessica van Setten75, Jana V Van Vliet-Ostaptchouk76, Zhaoming Wang77,78,79,80, Loïc Yengo81,82,83, Weihua Zhang84,85, Uzma Afzal84,85, Johan Ärnlöv9,10,86, Gillian M Arscott87, Stefania Bandinelli88, Amy Barrett61, Claire Bellis89, Amanda J Bennett61, Christian Berne90, Matthias
Blüher91,92, Jennifer L Bolton45, Yvonne Böttcher91, Heather A Boyd43, Marcel Bruinenberg93, Brendan M Buckley94, Steven Buyske95,96, Ida H Caspersen97, Peter S Chines98, Robert Clarke99, Simone Claudi-Boehm100, Matthew Cooper36, E Warwick Daw44, Pim A De Jong101, Joris Deelen38,39, Graciela Delgado50, Josh C Denny102, Rosalie Dhonukshe-Rutten103, Maria Dimitriou104, Alex SF Doney105, Marcus Dörr77,106, Niina Eklund52,107, Elodie Eury81,82,83, Lasse Folkersen68, Melissa E Garcia108, Frank Geller43, Vilmantas Giedraitis109, Alan S Go110, Harald Grallert35,111,112, Tanja B Grammer50, Jürgen Gräßler113, Henrik Grönberg22, Lisette C.P.G.M. de Groot103, Christopher J Groves61, Jeffrey Haessler47, Per Hall22, Toomas Haller2, Goran Hallmans114, Anke Hannemann78, Catharina A Hartman115, Maija Hassinen116, Caroline Hayward117, Nancy L Heard-Costa118,119, Quinta Helmer38,120,121, Gibran Hemani6,7, Anjali K Henders60, Hans L
Hillege56,122, Mark A Hlatky123, Wolfgang Hoffmann77,124, Per Hoffmann125,126,127, Oddgeir Holmen128, Jeanine J Houwing-Duistermaat38,120, Thomas Illig111,129, Aaron Isaacs18,130, Alan L James131,132, Janina Jeff54, Berit Johansen97, Åsa Johansson133, Jennifer Jolley134,135, Thorhildur Juliusdottir24, Juhani Junttila136, Abel N Kho137, Leena Kinnunen52, Norman Klopp111,129, Thomas Kocher138, Wolfgang Kratzer139, Peter Lichtner140, Lars Lind141, Jaana Lindström52, Stéphane Lobbens81,82,83, Mattias Lorentzon142, Yingchang Lu54,143, Valeriya Lyssenko144, Patrik KE Magnusson22, Anubha Mahajan24, Marc Maillard145, Wendy L
McArdle146, Colin A McKenzie147, Stela McLachlan45, Paul J McLaren148,149, Cristina Menni55, Sigrun Merger100, Lili Milani2, Alireza Moayyeri55, Keri L Monda48,150, Mario A Morken98, Gabriele Müller151, Martina
Müller-Nurasyid35,152,153,154, Arthur W Musk155, Narisu Narisu98, Matthias Nauck77,78, Ilja M Nolte122, Markus M Nöthen126,127, Laticia Oozageer84, Stefan Pilz156,157, Nigel W Rayner24,29,61, Frida Renstrom64, Neil R Robertson24,61, Lynda M Rose11, Ronan Roussel158,159,160, Serena Sanna28, Hubert Scharnagl161, Salome Scholtens122, Fredrick R Schumacher162, Heribert Schunkert154,163, Robert A
Author Manuscript
Author Manuscript
Author Manuscript
Scott14, Joban Sehmi84,85, Thomas Seufferlein139, Jianxin Shi164, Karri Silventoinen165, Johannes H Smit166,167, Albert Vernon Smith168,169, Joanna Smolonska23,122, Alice V Stanton170, Kathleen Stirrups29,49, David J Stott171, Heather M Stringham25, Johan Sundström141, Morris A Swertz23, Ann-Christine Syvänen9,172, Bamidele O Tayo173, Gudmar Thorleifsson174, Jonathan P Tyrer175, Suzanne van Dijk12, Natasja M van Schoor156, Nathalie van der Velde12,176, Diana van Heemst38,73, Floor VA van Oort177, Sita H Vermeulen178,179, Niek Verweij56, Judith M Vonk122, Lindsay L Waite34, Melanie Waldenberger111, Roman
Wennauer180, Lynne R Wilkens53, Christina Willenborg181,182, Tom Wilsgaard183, Mary K Wojczynski44, Andrew Wong184, Alan F Wright117, Qunyuan Zhang44, Dominique Arveiler185, Stephan JL Bakker186, John Beilby87,187, Richard N Bergman188, Sven Bergmann16,17, Reiner Biffar189, John Blangero89, Dorret I Boomsma190, Stefan R Bornstein113, Pascal Bovet191,192, Paolo Brambilla193, Morris J Brown194, Harry Campbell45, Mark J Caulfield195, Aravinda Chakravarti41, Rory Collins99, Francis S Collins98, Dana C Crawford196,197, L Adrienne
Cupples118,198, John Danesh199, Ulf de Faire200, Hester M den Ruijter74,201, Raimund Erbel202, Jeanette Erdmann181,182, Johan G Eriksson52,203,204, Martin Farrall24,46, Ele Ferrannini205,206, Jean Ferrières207, Ian Ford208, Nita G Forouhi14, Terrence Forrester147, Ron T Gansevoort186, Pablo V Gejman209, Christian Gieger35, Alain Golay210, Omri Gottesman54, Vilmundur Gudnason168,169, Ulf Gyllensten133, David W Haas211, Alistair S Hall212, Tamara B Harris108, Andrew T Hattersley213, Andrew C Heath214, Christian Hengstenberg154,163, Andrew A Hicks215,216, Lucia A Hindorff217, Aroon D Hingorani218, Albert Hofman57,58, G Kees Hovingh219, Steve E Humphries220, Steven C Hunt221, Elina
Hypponen222,223,224, Kevin B Jacobs79,80, Marjo-Riitta Jarvelin85,225,226,227,228,229, Pekka Jousilahti52, Antti M Jula52, Jaakko Kaprio52,107,230, John JP Kastelein219, Manfred Kayser57,231, Frank Kee232, Sirkka M Keinanen-Kiukaanniemi233,234, Lambertus A Kiemeney178,235, Jaspal S Kooner84,236,237, Charles Kooperberg47, Seppo Koskinen52, Peter Kovacs91,92, Aldi T Kraja44, Meena Kumari238, Johanna Kuusisto239, Timo A Lakka116,240,241, Claudia Langenberg14,238, Loic Le
Marchand53, Terho Lehtimäki242, Sara Lupoli243,244, Pamela AF Madden214, Satu Männistö52, Paolo Manunta245,246, André Marette247,248, Tara C Matise96, Barbara McKnight249, Thomas Meitinger154, Frans L Moll250, Grant W Montgomery60, Andrew D Morris105, Andrew P Morris2,24,251, Jeffrey C Murray252, Mari Nelis2, Claes Ohlsson142, Albertine J Oldehinkel115, Ken K Ong14,184, Willem H Ouwehand134,135, Gerard Pasterkamp74, Annette Peters111,154,253, Peter P Pramstaller215,216,254, Jackie F Price45, Lu Qi20,255, Olli T Raitakari256,257, Tuomo Rankinen258, DC Rao44,69,214, Treva K Rice69,214, Marylyn Ritchie259, Igor
Rudan45,260, Veikko Salomaa52, Nilesh J Samani261,262, Jouko Saramies263, Mark A Sarzynski258, Peter EH Schwarz113,264, Sylvain Sebert229, Peter Sever265, Alan R Shuldiner266,267, Juha Sinisalo268, Valgerdur Steinthorsdottir174, Ronald P Stolk122, Jean-Claude Tardif26,269, Anke Tönjes91,92, Angelo Tremblay270, Elena Tremoli271, Jarmo Virtamo52, Marie-Claude Vohl248,272, The electronic medical records and genomics (eMERGE) consortium273, The MIGen Consortium274,275, The PAGE Consortium275,276, The LifeLines Cohort Study275,277, Philippe
Author Manuscript
Author Manuscript
Author Manuscript
Amouyel278, Folkert W Asselbergs218,279,280, Themistocles L Assimes123, Murielle Bochud191,192, Bernhard O Boehm100,281, Eric Boerwinkle282, Erwin P Bottinger54, Claude Bouchard258, Stéphane Cauchi81,82,83, John C Chambers84,85,236, Stephen J Chanock79, Richard S Cooper173, Paul IW de Bakker75,283,284, George
Dedoussis104, Luigi Ferrucci70, Paul W Franks64,65,255, Philippe Froguel62,81,82,83, Leif C Groop107,285, Christopher A Haiman162, Anders Hamsten68, M Geoffrey Hayes137, Jennie Hui87,187,222, David J. Hunter20,255,286, Kristian Hveem128, J Wouter Jukema72,280,287, Robert C Kaplan288, Mika Kivimaki238, Diana Kuh184, Markku Laakso239, Yongmei Liu289, Nicholas G Martin60, Winfried März50,161,290, Mads Melbye43,123, Susanne Moebus30, Patricia B Munroe195, Inger Njølstad183, Ben A Oostra18,130,291, Colin NA Palmer105, Nancy L Pedersen22, Markus Perola2,52,107, Louis Pérusse248,270, Ulrike Peters47, Joseph E Powell6,7, Chris Power224, Thomas Quertermous123, Rainer Rauramaa116,241, Eva Reinmaa2, Paul M Ridker11,292, Fernando Rivadeneira12,57,58, Jerome I Rotter293, Timo E
Saaristo294,295, Danish Saleheen199,296,297, David Schlessinger298, P Eline Slagboom38,39, Harold Snieder122, Tim D Spector55, Konstantin Strauch35,153, Michael Stumvoll91,92, Jaakko Tuomilehto52,299,300,301, Matti Uusitupa302,303, Pim van der Harst23,56,280, Henry Völzke77,124, Mark Walker304, Nicholas J Wareham14, Hugh Watkins24,46, H-Erich Wichmann305,306,307, James F Wilson45, Pieter
Zanen308, Panos Deloukas29,49,309, Iris M Heid32,35, Cecilia M Lindgren4,24, Karen L Mohlke19, Elizabeth K Speliotes310, Unnur Thorsteinsdottir174,311, Inês
Barroso29,312,313, Caroline S Fox118, Kari E North48,314, David P Strachan315, Jacques S. Beckmann16,17,316, Sonja I Berndt79, Michael Boehnke25, Ingrid B Borecki44, Mark I McCarthy24,61,317, Andres Metspalu2,27, Kari Stefansson174,311, André G Uitterlinden12,57,58, Cornelia M van Duijn18,57,58,130, Lude Franke23, Cristen J Willer318,319,320, Alkes L. Price4,286,321, Guillaume Lettre26,269, Ruth JF Loos14,54,143,322, Michael N Weedon1, Erik Ingelsson9,10,24, Jeffrey R O’Connell266, Goncalo R Abecasis25,‡, Daniel I Chasman11,292,‡, Michael E Goddard323,324,‡, Peter M Visscher6,7,‡, Joel N Hirschhorn3,4,5,‡, and Timothy M Frayling1,‡
Affiliations
1Genetics of Complex Traits, University of Exeter Medical School, University of
Exeter, Exeter EX1 2LU, UK 2Estonian Genome Center, University of Tartu, Tartu
51010, Estonia 3Division of Endocrinology, Genetics and Basic and Translational
Obesity Research, Boston Children’s Hospital, Boston, MA 02115, USA 4Broad
Institute of the Massachusetts Institute of Technology and Harvard University, Cambridge 02142, MA, USA 5Department of Genetics, Harvard Medical School,
Boston, MA 02115, USA 6Queensland Brain Institute, The University of
Queensland, Brisbane 4072, Australia 7The University of Queensland Diamantina
Institute, The Translation Research Institute, Brisbane 4012, Australia 8Center for
Biological Sequence Analysis, Department of Systems Biology, Technical University of Denmark, Lyngby 2800, Denmark 9Science for Life Laboratory, Uppsala
University, Uppsala 75185, Sweden 10Department of Medical Sciences, Molecular
Epidemiology, Uppsala University, Uppsala 75185, Sweden 11Division of Preventive
Medicine, Brigham and Women’s Hospital, Boston, MA 02215, USA 12Department
Author Manuscript
Author Manuscript
Author Manuscript
of Internal Medicine, Erasmus Medical Center, 3015GE Rotterdam, The
Netherlands 13Analytic and Translational Genetics Unit, Massachusetts General
Hospital and Harvard Medical School, Boston, MA, USA 14MRC Epidemiology Unit,
University of Cambridge, Institute of Metabolic Science, Addenbrooke’s Hospital, Hills Road, Cambridge, CB2 0QQ, UK 15Institute of Social and Preventive Medicine
(IUMSP), Centre Hospitalier Universitaire Vaudois (CHUV), Lausanne 1010, Switzerland 16Swiss Institute of Bioinformatics, Lausanne 1015, Switzerland 17Department of Medical Genetics, University of Lausanne, Lausanne 1005,
Switzerland 18Genetic Epidemiology Unit, Department of Epidemiology, Erasmus
University Medical Center, 3015 GE Rotterdam, The Netherlands 19Department of
Genetics, University of North Carolina, Chapel Hill, NC 27599, USA 20Channing
Division of Network Medicine, Department of Medicine, Brigham and Women’s Hospital and Harvard Medical School, Boston, MA 02115, USA 21Division of
Statistical Genomics, Department of Genetics Washington University School of Medicine, St. Louis, MO, USA 22Department of Medical Epidemiology and
Biostatistics, Karolinska Institutet, Stockholm 17177, Sweden 23Department of
Genetics, University Medical Center Groningen, University of Groningen, 9700 RB Groningen, The Netherlands 24Wellcome Trust Centre for Human Genetics,
University of Oxford, Oxford OX3 7BN, UK 25Center for Statistical Genetics,
Department of Biostatistics, University of Michigan, Ann Arbor, MI 48109, USA
26Montreal Heart Institute, Montreal, Quebec H1T 1C8, Canada 27Institute of
Molecular and Cell Biology, University of Tartu, Tartu 51010, Estonia 28Istituto di
Ricerca Genetica e Biomedica (IRGB), Consiglio Nazionale delle Ricerche, Cagliari, Sardinia 09042, Italy 29Wellcome Trust Sanger Institute, Hinxton, Cambridge CB10
1SA, UK 30Institute for Medical Informatics, Biometry and Epidemiology (IMIBE),
University Hospital Essen, Essen, Germany 31Clinical Epidemiology, Integrated
Research and Treatment Center, Center for Sepsis Control and Care (CSCC), Jena University Hospital, Jena, Germany 32Department of Genetic Epidemiology, Institute
of Epidemiology and Preventive Medicine, University of Regensburg, D-93053 Regensburg, Germany 33Harvard School of Public Health, Department of Nutrition,
Harvard University, Boston, MA 2115, USA 34HudsonAlpha Institute for
Biotechnology, Huntsville, AL 35806, USA 35Institute of Genetic Epidemiology,
Helmholtz Zentrum München - German Research Center for Environmental Health, D-85764 Neuherberg, Germany 36Telethon Institute for Child Health Research,
Centre for Child Health Research, The University of Western Australia, Western Australia 6008, Australia 37Section on Growth and Development, Program in
Developmental Endocrinology and Genetics, Eunice Kennedy Shriver National Institute of Child Health and Human Development, National Institutes of Health, Bethesda, MD 20892, USA 38Netherlands Consortium for Healthy Aging (NCHA),
Leiden University Medical Center, Leiden 2300 RC, The Netherlands 39Department
of Molecular Epidemiology, Leiden University Medical Center, 2300 RC Leiden, The Netherlands 40Department of Human Genetics, Leiden University Medical Center,
2333 ZC Leiden, The Netherlands 41Center for Complex Disease Genomics,
McKusick-Nathans Institute of Genetic Medicine, Johns Hopkins University School
Author Manuscript
Author Manuscript
Author Manuscript
of Medicine, Baltimore, MD 21205, USA 42Cardiology, Department of Specialties of
Internal Medicine, Geneva University Hospital, Geneva 1211, Switzerland
43Department of Epidemiology Research, Statens Serum Institut, Copenhagen
DK-2300, Denmark 44Department of Genetics, Washington University School of
Medicine, St. Louis, MO 63110, USA 45Centre for Population Health Sciences,
University of Edinburgh, Teviot Place, Edinburgh, EH8 9AG, Scotland, UK
46Division of Cardiovacular Medicine, Radcliffe Department of Medicine, University
of Oxford, Oxford OX3 9DU, UK 47Division of Public Health Sciences, Fred
Hutchinson Cancer Research Center, Seattle, WA 98109, USA 48Department of
Epidemiology, University of North Carolina at Chapel Hill, Chapel Hill, NC 27599, USA 49William Harvey Research Institute, Barts and The London School of
Medicine and Dentistry, Queen Mary University of London, EC1M 6BQ UK 50Vth
Department of Medicine (Nephrology, Hypertensiology, Endocrinology, Diabetology, Rheumatology), Medical Faculty of Mannheim, University of Heidelberg, Germany
51Department of Internal Medicine II, Ulm University Medical Centre, D-89081 Ulm,
Germany 52National Institute for Health and Welfare, FI-00271 Helsinki, Finland 53Epidemiology Program, University of Hawaii Cancer Center, Honolulu, HI USA 54The Charles Bronfman Institute for Personalized Medicine, Icahn School of
Medicine at Mount Sinai, New York, NY 10029, USA 55Department of Twin
Research and Genetic Epidemiology, King’s College London, London SE1 7EH, UK
56Department of Cardiology, University Medical Center Groningen, University of
Groningen, 9700RB Groningen, The Netherlands 57Netherlands Consortium for
Healthy Aging (NCHA), 3015GE Rotterdam, The Netherlands 58Department of
Epidemiology, Erasmus Medical Center, 3015GE Rotterdam, The Netherlands
59Laboratory of Neurogenetics, National Institute on Aging, National Institutes of
Health, Bethesda, MD 20892, USA 60QIMR Berghofer Medical Research Institute,
Queensland 4006, Australia 61Oxford Centre for Diabetes, Endocrinology and
Metabolism, University of Oxford, Oxford OX3 7LJ, UK 62Department of Genomics
of Common Disease, School of Public Health, Imperial College London, Hammersmith Hospital, London, UK 63Stanley Center for Psychiatric Research,
Broad Institute of MIT and Harvard, Cambridge, MA 02142, USA 64Department of
Clinical Sciences, Genetic & Molecular Epidemiology Unit, Lund University Diabetes Center, Skåne University Hosptial, Malmö 205 02, Sweden 65Department of Public
Health and Clinical Medicine, Unit of Medicine, Umeå University, Umeå 901 87, Sweden 66Department of Odontology, Umeå University, Umeå 901 85, Sweden 67University of Eastern Finland, FI-70210 Kuopio, Finland 68Atherosclerosis
Research Unit, Center for Molecular Medicine, Department of Medicine, Karolinska Institutet, Stockholm 17176, Sweden 69Division of Biostatistics, Washington
University School of Medicine, St. Louis, MO 63110, USA 70Translational
Gerontology Branch, National institute on Aging, Baltimore MD 21225, USA
71Interfaculty Institute for Genetics and Functional Genomics, University Medicine
Greifswald, D-17475 Greifswald, Germany 72Department of Cardiology, Leiden
University Medical Center, 2300 RC Leiden, The Netherlands 73Department of
Gerontology and Geriatrics, Leiden University Medical Center, 2300 RC Leiden,
Author Manuscript
Author Manuscript
Author Manuscript
The Netherlands 74Experimental Cardiology Laboratory, Division Heart and Lungs,
University Medical Center Utrecht, 3584 CX Utrecht, The Netherlands 75Department
of Medical Genetics, University Medical Center Utrecht, 3584 CX Utrecht, The Netherlands 76Department of Endocrinology, University of Groningen, University
Medical Center Groningen, Groningen, 9700 RB, The Netherlands 77DZHK
(Deutsches Zentrum für Herz-Kreislaufforschung – German Centre for
Cardiovascular Research), partner site Greifswald, D-17475 Greifswald, Germany
78Institute of Clinical Chemistry and Laboratory Medicine, University Medicine
Greifswald, D-17475 Greifswald, Germany 79Division of Cancer Epidemiology and
Genetics, National Cancer Institute, National Institutes of Health, Bethesda, MD 20892, USA 80Core Genotyping Facility, SAIC-Frederick, Inc., NCI-Frederick,
Frederick, MD 21702, USA 81CNRS UMR 8199, F-59019 Lille, France 82European
Genomic Institute for Diabetes, F-59000 Lille, France 83Université de Lille 2,
F-59000 Lille, France 84Ealing Hospital NHS Trust, Middlesex UB1 3HW, UK 85Department of Epidemiology and Biostatistics, Imperial College London, London
W2 1PG, UK 86School of Health and Social Studies, Dalarna University, Falun,
Sweden 87PathWest Laboratory Medicine of Western Australia, NEDLANDS,
Western Australia 6009, Australia 88Geriatric Unit, Azienda Sanitaria Firenze (ASF),
Florence, Italy 89Department of Genetics, Texas Biomedical Research Institute, San
Antonio, TX, USA 90Department of Medical Sciences, Endocrinology, Diabetes and
Metabolism, Uppsala University, Uppsala 75185, Sweden 91IFB Adiposity Diseases,
University of Leipzig, D-04103 Leipzig, Germany 92Department of Medicine,
University of Leipzig, D-04103 Leipzig, Germany 93LifeLines, University Medical
Center Groningen, University of Groningen, 9700 RB Groningen, The Netherlands
94Department of Pharmacology and Therapeutics, University College Cork, Cork,
Ireland 95Department of Statistics & Biostatistics, Rutgers University, Piscataway,
N.J. USA 96Department of Genetics, Rutgers University, Piscataway, N.J. USA 97Department of Biology, Norwegian University of Science and Technology,
Trondheim, Norway 98Genome Technology Branch, National Human Genome
Research Institute, NIH, Bethesda, MD 20892, USA 99Clinical Trial Service Unit,
Epidemiological Studies Unit, Nuffield Department of Population Health, University of Oxford, Oxford OX3 7LF, UK 100Division of Endocrinology, Diabetes and
Metabolism, Ulm University Medical Centre, D-89081 Ulm, Germany 101Department
of Radiology, University Medical Center Utrecht, Utrecht, The Netherlands
102Department of Biomedical Informatics, Vanderbilt University, Nashville, TN
37232, USA 103Department of Human Nutrition, Wageningen University,
Wageningen, The Netherlands 104Department of Dietetics-Nutrition, Harokopio
University, Athens, Greece 105Medical Research Institute, University of Dundee,
Ninewells Hospital and Medical School, Dundee DD1 9SY, UK 106Department of
Internal Medicine B, University Medicine Greifswald, D-17475 Greifswald, Germany
107Institute for Molecular Medicine, University of Helsinki, FI-00014 Helsinki, Finland 108Laboratory of Epidemiology and Population Sciences, National Institute on Aging,
NIH, Bethesda, MD 20892, USA 109Department of Public Health and Caring
Sciences, Geriatrics, Uppsala University, Uppsala 75185, Sweden 110Kaiser
Author Manuscript
Author Manuscript
Author Manuscript
Permanente, Division of Research, Oakland, CA 94612, USA 111Research Unit of
Molecular Epidemiology, Helmholtz Zentrum München - German Research Center for Environmental Health, D-85764 Neuherberg, Germany 112German Center for
Diabetes Research (DZD), Neuherberg, Germany 113Department of Medicine III,
University Hospital Carl Gustav Carus, Technische Universität Dresden, D-01307 Dresden, Germany 114Department of Public Health and Clinical Medicine, Unit of
Nutritional Research, Umeå University, Umeå 90187, Sweden 115Department of
Psychiatry, University of Groningen, University Medical Center Groningen, Groningen, The Netherlands 116Kuopio Research Institute of Exercise Medicine,
Kuopio, Finland 117MRC Human Genetics Unit, Institute of Genetics and Molecular
Medicine, University of Edinburgh, Western General Hospital, Edinburgh, EH4 2XU, Scotland, UK 118National Heart, Lung, and Blood Institute, the Framingham Heart
Study, Framingham MA 01702, USA 119Department of Neurology, Boston University
School of Medicine, Boston, MA 02118, USA 120Department of Medical Statistics
and Bioinformatics, Leiden University Medical Center, 2300 RC Leiden, The Netherlands 121Faculty of Psychology and Education, VU University Amsterdam,
Amsterdam, The Netherlands 122Department of Epidemiology, University Medical
Center Groningen, University of Groningen, 9700 RB Groningen, The Netherlands
123Department of Medicine, Stanford University School of Medicine, Stanford, CA
94305, USA 124Institute for Community Medicine, University Medicine Greifswald,
D-17475 Greifswald, Germany 125Division of Medical Genetics, Department of
Biomedicine, University of Basel, Basel, Switzerland 126Department of Genomics,
Life & Brain Center, University of Bonn, Bonn, Germany 127Institute of Human
Genetics, University of Bonn, Bonn, Germany 128Department of Public Health and
General Practice, Norwegian University of Science and Technology, Trondheim 7489, Norway 129Hannover Unified Biobank, Hannover Medical School, Hannover,
D-30625 Hannover, Germany 130Center for Medical Sytems Biology, Leiden, The
Netherlands 131Department of Pulmonary Physiology and Sleep Medicine,
NEDLANDS, Western Australia 6009, Australia 132School of Medicine and
Pharmacology, University of Western Australia, CRAWLEY 6009, Australia
133Uppsala University, Department of Immunology, Genetics & Pathology,
SciLifeLab, Rudbeck Laboratory, SE-751 85, Uppsala, Sweden 134Department of
Haematology, University of Cambridge, Cambridge CB2 0PT, UK 135NHS Blood and
Transplant, Cambridge CB2 0PT, UK 136Department of Medicine, University of
Oulo, Oulo, Finland 137Department of Medicine, Northwestern University Feinberg
School of Medicine, Chicago, IL 60611, USA 138Unit of Periodontology, Department
of Restorative Dentistry, Periodontology and Endodontology, University Medicine Greifswald, D-17475 Greifswald, Germany 139Department of Internal Medicine I,
Ulm University Medical Centre, D-89081 Ulm, Germany 140Institute of Human
Genetics, Helmholtz Zentrum München - German Research Center for
Environmental Health, D-85764 Neuherberg, Germany 141Department of Medical
Sciences, Cardiovascular Epidemiology, Uppsala University, Uppsala 75185, Sweden 142Centre for Bone and Arthritis Research, Department of Internal Medicine
and Clinical Nutrition, Institute of Medicine, Sahlgrenska Academy, University of