October 2004
AMR 04-04
Department of Agricultural and Resource Economics, Fort Collins, CO 80523-1172
http://dare.colostate.edu/pubs•
From 1997 to 2002, the number of farms in the United States increased by 11.4%.•
In 2002, the average U.S. farm size was only 441 acres, 10% smaller than the average farm size in 1992.•
From 1992 to 2002 the total number of farms in Colorado increased by 15.5%.•
In 2002, the average Colorado farm size was 991 acres, 20.8% smaller than in 1992.An evaluation of the 2002 Census of Agriculture data released in June 2004 indicates some interesting changes in the structure of agriculture and farms for both the United States and Colorado. There are vari-ous definitions of “farm structure”, but two character-istics that are usually discussed when evaluating farm structure are the number of farms and the size of farms. This fact sheet provides a brief discussion on U.S. and Colorado farm numbers, farm size, organizational structure of farms, and primary occupation of farm operators based on data from the most recent 2002 Census of Agriculture.
The Number of Farms in the U.S. and Colorado
The number of farms in the United States peaked in 1935 at 6.8 million farms. Increases in agricultural productivity and more off-farm employment opportu-nities were likely causes of the 66% decline in farms that occurred from 1935 to 1974. However, since 1974, the number of farms in the United States has tended to stay more constant, declining an average of 3.7% every 5 years from 1974 to 1997 (Figure 1). Conversely, the 2002 Census of Agriculture numbers indicate a break from the previous trend of declining U.S. farm numbers. From 1997 to 2002, the number of farms in the United States actually increased by 11.4%. Additionally, as Figure 1 indicates, since peak-ing in 1992, the average farm size (acres per farm) has declined. In 2002, the average U.S. farm size was only 441 acres, 10% smaller than the average farm size in 1992.
Historical changes in the total number of farms in Colorado from 1974 to 2000 have been somewhat dif-ferent than the U.S. trends (Figure 2), although the most recent five-year changes have been similar. Since 1974, thenumber of farms in Colorado has been steadily increasing. During the ten years from 1992 to 2002 the total number of farms in Colorado increased by 15.5%. The average farm size in Coloradois much
THE 2002 CENSUS OF AGRICULTURE: AN OVERVIEW OF CHANGES IN U.S. AND COLORADO FARM STRUCTURE
Wendy Umberger 1
1
Assistant Professor and Extension Agribusiness Economist, Department of Agricultural and Resource Economics, Colorado State University; Colorado State University, Fort Collins, CO 80523-1172.
Numbers of Farms and Average Size of Farms in the United States (By Census of Agriculture Year, 1974-2002)
0 500 1,000 1,500 2,000 2,500 1974 1978 1982 1987 1992 1997 2002 Year Thousands of Farms 410 420 430 440 450 460 470 480 490 500 Ac re s
Number of Farms Average size of farm (acres)
Figure 1. Numbers of Farms and Average Size of Farms in the United States
Numbers of Farms and Average Size of Farms in Colorado (By Census of Agriculture Year, 1974-2002)
0 5 10 15 20 25 30 35 1974 1978 1982 1987 1992 1997 2002 Year Thousands of Farms 0 200 400 600 800 1000 1200 1400 1600 Ac re s
Number of Farms Average size of farm (acres)
larger (more than double) the average size of U.S. farms. However, similar to the U.S. trend, the average size of farms in Colorado has been declining since 1992 (Figure 2). In 2002, the average Colorado farm size was 991 acres, 20.8% smaller than in 1992.
Changes in the Percent of U.S. and Colorado Farms by Farm Size Category
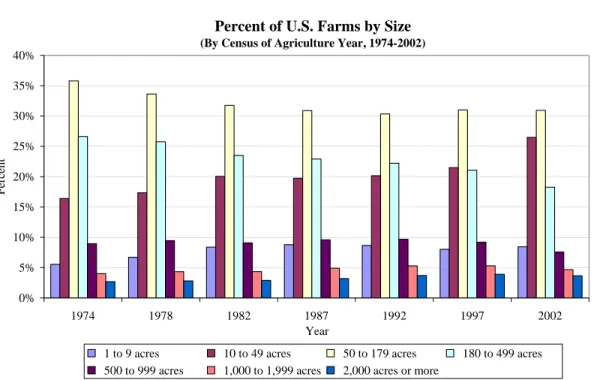
The Census of Agriculture also classifies farms into seven size categories based on their acreage. Figures 3 and 4 show the percent of U.S. and Colorado farms, respectively, by size category for Census of Agricul-ture years from 1974 to 2002. The increase in total number of farms and the decline in average farm size in the United States discussed above can be further explained by the 21% increase from 1997 to 2002 in the number of small farms ranging in size from 1 to 179 acres. The largest increase in farm size category from 1997 to 2002 was a 37.2% increase in the number of farms ranging in size from 10 to 49 acres. This size category also had the largest relative increase from 1992 to 1997. The numbers of farms fitting into size categories ranging between 180 to 1,999 acres have declined in the years between the 1992 and the 2002 Censuses of Agriculture.
It is also important to note the increase in the number of farms that fit the largest farm size category: farms with 2,000 acres or more. The number of farms fitting this large farm size category has been steadily increas-ing over the last century. From 1997 to 2002 the num-ber of farms with 2,000 acres or more increased 4.5%. When considering the increases in farm size categories it is also interesting to examine the market value of agricultural products sold and government payments by each size category (Figures 5 and 6). The 2002 Census of Agriculture numbers indicate that 24.7% of the market value of agricultural products sold is from farms ranging in size from 1 to 179 acres, 51.7% of the sales are from farms with 180 to 1,999 acres, and 23.7% of the sales are from farms with 2,000 acres or more. Thus, less than 5% of U.S. farms accounted for approximately 24% of the market value of agricultural products sold in 2002. Additionally, in 2002, over
one-half, 57.8%, of all U.S. farms had sales of $10,000 or less per year.
Changes in the percent of Colorado farms composing each of the seven size categories (Figure 4) differ somewhat from the U.S. trends. The number of farms falling into one of the four size categories of farms with less than 499 acres has been increasing since 1992. The size category of 10 to 49 acres had the larg-est percent increase in both the 1997 census and the 2002 Census of Agriculture. On the other hand, since the 1992 Census, the number of Colorado farms falling into one of the three size categories of farms with 500 acres or more has declined. Interestingly, however, in 2002 farms with more than 500 acres accounted for approximately 70% of Colorado agricultural sales, while farms with 499 acres or less only accounted for 30% of sales.
Other statistics such as the distribution of farms by type of organizational structure and distribution of principal farm operator by primary occupation are dis-played in Figures 7-10. The Census of Agriculture data appears to contradict the often-perceived notion that the number of family farms is declining. As Fig-ures 7 and 8 indicate, in both the United States and Colorado, the percent of farms owned by a family or an individual has actually increased slightly in the last ten years. It is also interesting to note the slight increase in the percent of principal farm operators whose primary occupation is farming in both the United States and Colorado (Figures 9 and 10).
Summary
The 2002 Census of Agriculture data indicates that the total number of farms in the United States and Colo-rado is increasing. However, in both the United States and Colorado, most of this increase in numbers is due to more small farms, particularly farms with only 10 to 49 acres. Therefore, in general, farms in both the United States and Colorado are getting smaller. How-ever, these small farms with less than 180 acres accounted for a relatively small portion (only 25%) of the market value of agriculture in 2002. Most of the U.S. market value of agricultural production comes from farms that are greater than 1,000 acres in size.
Percent of U.S. Farms by Size (By Census of Agriculture Year, 1974-2002)
0% 5% 10% 15% 20% 25% 30% 35% 40% 1974 1978 1982 1987 1992 1997 2002 Year Per cent
1 to 9 acres 10 to 49 acres 50 to 179 acres 180 to 499 acres 500 to 999 acres 1,000 to 1,999 acres 2,000 acres or more
Figure 3. Percent of U.S. Farms by Size Category
Percent of Colorado Farms by Size
(By Census of Agriculture Year, 1974-2002)
0% 5% 10% 15% 20% 25% 30% 1974 1978 1982 1987 1992 1997 2002 Year Percent
1 to 9 acres 10 to 49 acres 50 to 179 acres 180 to 499 acres
500 to 999 acres 1,000 to 1,999 acres 2,000 acres or more
Distribution of U.S. Farms by Value of Sales Category
(By Census of Agriculture Year, 1978-2002*) *Data was not available for all categories in 1974
0.0% 5.0% 10.0% 15.0% 20.0% 25.0% 30.0% 35.0% 40.0% 45.0% 1978 1982 1987 1992 1997 2002 Census Year % of Farms Less than $2,500 $2,500 to $4,999 $5,000 to $9,999 $10,000 to $24,999 $25,000 to $49,999 $50,000 to $99,999 $100,000 to $499,999 $500,000 or more
Figure 5. The Distribution of U.S. Farms by Market Value of Sales Category
Distribution of Colorado Farms by Value of Sales Category
(By Census of Agriculture Year, 1978-2002*) *Data was not available for all categories in 1974
0.0% 5.0% 10.0% 15.0% 20.0% 25.0% 30.0% 35.0% 40.0% 45.0% 1978 1982 1987 1992 1997 2002 Census Year % of Farm s Less than $2,500 $2,500 to $4,999 $5,000 to $9,999 $10,000 to $24,999 $25,000 to $49,999 $50,000 to $99,999 $100,000 to $499,999 $500,000 or more
Distribution of U.S. Farms by Type of Organizational Structure (By Census of Agriculture Year, 1978-2002*)
*Data was not available for all categories in 1974
89.7% 86.0% 85.9% 87.1% 86.8% 86.7% 6.1% 8.9% 9.7% 9.6% 10.0% 10.3% 3.2% 3.8% 4.4% 3.5% 2.7% 2.2% 0.8% 0.8% 0.6% 0.6% 0.5% 0.4% 0% 10% 20% 30% 40% 50% 60% 70% 80% 90% 100% 1978 1982 1987 1992 1997 2002 Year Per cent
Family or individual Partnership Corporation Other cooperative, estate
Figure 7. Distribution of U.S. Farms by Type of Organizational Structure
Distribution of Colorado Farms by Type of Organizational Structure (By Census of Agriculture Year, 1978-2002*)
*Data was not available for all categories in 1974
82.8% 83.3% 82.8% 82.3% 82.4% 87.0% 6.7% 9.9% 10.6% 11.0% 10.8% 11.6% 6.1% 5.4% 6.7% 5.2% 5.0% 4.9% 1.1% 1.1% 0.9% 0.9% 0.8% 0.7% 0% 10% 20% 30% 40% 50% 60% 70% 80% 90% 100% 1978 1982 1987 1992 1997 2002 Year Per cent
Family or individual Partnership Corporation Other cooperative, estate
Distribution of Principal Farm Operator by Primary Occupation in the United States
(By Census of Agriculture Year, 1974-2002)
0% 10% 20% 30% 40% 50% 60% 70% 80% 90% 100% 1974 1978 1982 1987 1992 1997 2002 Year Per cent Farming Other
Figure 9. Distribution of Principal Farm Operator by Primary Occupation in the United States
Distribution of Principal Farm Operator by Primary Occupation in Colorado
(By Census of Agriculture Year, 1974-2002)
0% 10% 20% 30% 40% 50% 60% 70% 80% 90% 100% 1974 1978 1982 1987 1992 1997 2002 Year Per cent Farming Other