Colorado State University Agricultural Experiment Station Technical Report TR12-15
Page 1
TABLE of CONTENTS
Foreword 2
Joint Colorado and Nebraska Wine Quality Assurance Study ... 8
Roundup-Ready Soybean Variety Performance Trial and ... 21
Number of Seed Rows on a Bed at Fruita, Colorado 2011... 21
Evaluation of Peach Rootstocks ... 29
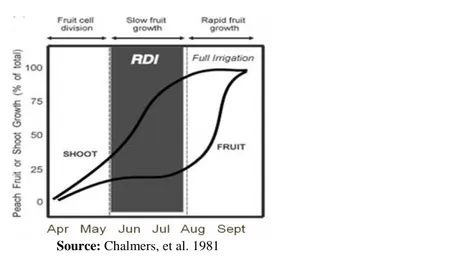
Testing the Benefits of Deficit Irrigation on Western Slope Peach Orchards... 32
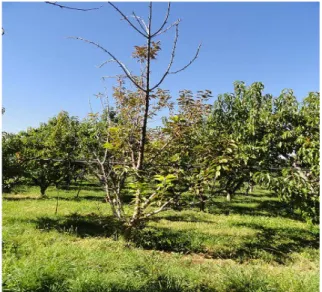
Plant and soil health on Cytospora incidence, growth, and production in peach ... 38
Colorado State University Agricultural Experiment Station Technical Report TR12-15
Page 2
FOREWORD
During 2011, a milestone was noted, as the Orchard Mesa Site of the Western Colorado Research Center (WCRC-OM) celebrated the 50th anniversary of its establishment and operation.
Dr. Lee Sommers, Director of the Colorado Agricultural Experiment Station (CAES) and Associate Dean for Research, College of Agricultural Sciences at Colorado State University has announced his retirement effective May 31, 2013. Lee joined Colorado State as Professor and Head of the Department of Soil and Crop Sciences in 1985 and became the CAES Director in 1996. In 2006, he assumed the additional responsibility of Associate Dean for Research.
Lee has provided the leadership and oversight of agricultural research programs funded by the CAES in six of the eight colleges at CSU and eight off-campus research sites. He has had a significant impact on developing interdisciplinary agricultural and natural resource programs at Colorado State to address complex problems and issues facing Colorado growers and producers, commodity organizations, and governmental agencies including addressing and public policy issues. Also of significance is his restructuring of the program delivery and support system for combined faculty plant and animal programs at the Agricultural Research, Development and Education Center near Fort Collins.
Lee is a Fellow of the Soil Science Society of America (SSSA) and the American Society of Agronomy (ASA). He has served as President of both societies. He was awarded the Environmental Quality Research Award (ASA) in 1987, the Agronomic Service Award (ASA) in 2010, and the Soil Science Professional Service Award (SSSA) in 2010.
A reorganization of the College of Agricultural Sciences (CAS) and the Colorado Agricultural Experiment Station (CAES) is underway. Dr. Craig Beyrouty will become the CAS Dean/CAES Director. Lee’s position will become CAES Deputy Director/CAS Associate Dean for Research and will have responsibility for planning, coordinating, and executing on-and off-campus research programs. A national search is being initiated with an expected start date in April 2013. Additional restructuring is expected due to other retirements during FY 2013.
Closer to “home”, Dr. Amaya Atucha has joined the WCRC faculty as an assistant professor at Orchard Mesa. Her responsibilities are to conduct research and outreach activities in support of the commercial tree fruit industry in Western Colorado. Amaya’s education, experience and interests include a BS in Horticultural Sciences and a PhD in Horticulture, she worked as a private consultant for the avocado industry in Chile, and her research focuses on soil management systems in relation with tree performance and root growth patterns. We welcome Amaya and wish her a rewarding and productive career at CSU. This 2013 fiscal year is creating opportunities and challenges to address program and operational needs for filling positions due to vacancies and retirements. The results of these deliberations and decisions will be announced as they occur in Phytoworks, Fruit Facts and/or the 2012 Annual Report.
Colorado State University Agricultural Experiment Station Technical Report TR12-15
Page 3
Site descriptions
Fruita Site 1910 L Road Fruita, CO 81521 Tel (970) 858-3629 fax (970) 858-0461The Fruita site is located 15 miles northwest of Grand Junction. With an average growing season of 180 days at an elevation of 4600 ft, a diversity of agronomic research is conducted at the Western Colorado Research Center at Fruita, including variety performance trials in alfalfa, corn silage, corn grain, canola, grasses, small grains; new and alternative crops; irrigation; cropping systems; soil fertility; and new crop trait evaluation. The Colorado Foundation Bean Program is located at Fruita. The specialized laboratory facilities at Fruita allow research to be conducted on tissue culture and natural rubber extraction and quantification in various plant species.
Orchard Mesa Site
3168 B1/2 Road
Grand Junction CO 81503
Tel (970) 434-3264 fax (970) 434-1035
The Orchard Mesa site is located 7 miles southeast of Grand Junction. Site elevation is approximately 4700 ft. with an average growing season of 182 frost-free days. The research conducted at this site includes tree fruits, wine grape production, and ornamental horticulture. This site has alternative crops (e.g. pistachio nuts and edible honeysuckle), greenhouses, offices and laboratory facilities.
Colorado State University Agricultural Experiment Station Technical Report TR12-15
Page 4
AcknowledgmentsDr. Frank P. Johnson, Interim Manager and Dr. Stephen D. Menke were co-editors. Donna Iovanni was assistant to the editors.
The assistance of the following people, farmer cooperators, and staff is gratefully acknowledged: Bryan Braddy, Greg Irwin, Fred Judson, George Osborn, and John Wilhelm - Research Associates,
Colorado State University, Western Colorado Research Center
Jennifer Phillips and Jennifer Woods - Colorado State University, Western Colorado Research Center. Sara Pungitore, Viticulture student intern - Colorado State University, Western Colorado Research Center Mike Williams - Farmer cooperator, Hayden
Bruce Talbott, Harry Talbott, John Moore-Talbott Farms, Palisade
Funding Support
Colorado Agricultural Experiment Station Colorado Association of Viticulture and Enology Colorado Wine Industry Development Board Viticulture Consortium West
Nurseries: Dave Wilson Nursery, Van Well Nursery Delta Conservation District
Mesa County Conservation District
Water Conservation Field Services Program, US Bureau of Reclamation Natural Resource Conservation Service.
Department of Horticulture & Landscape Architecture, Colorado State University Grand Mesa Discount
DOW AgroSciences
Colorado Wheat Administrative Committee South Central Sun Grant Initiative
Forage Genetics International Enviro Consultant Service
Western Sustainable Agricultural Research and Education Program
Colorado Department of Agriculture’s Advancing Colorado’s Renewable Energy (ACRE) Nebraska Grape and Winery Board
Colorado State University Agricultural Experiment Station Technical Report TR12-15
Page 5
2011 Personnel Listing
Mr. Bryan Braddy, Research Associate bryan.braddy@colostate.edu
3168 B ½ Rd., Grand Junction, CO 81503 Ph. 970-434-3264, x-208; Fax 970-434-1035 Dr. Horst Caspari, Viticulturist
horst.caspari@colostate.edu
3168 B ½ Rd., Grand Junction, CO 81503 Ph. 970-434-3264, x-204; Fax 970-434-1035 Mrs. Donna Iovanni, Accounting Technician
donna.iovanni@colostate.edu
3168 B ½ Rd., Grand Junction, CO 81503 Ph. 970-434-3264, x-201; Fax 970-434-1035 Mr. Greg Irwin, Research Associate
greg.irwin@colostate.edu
1910 L Rd., Fruita, CO 81521
Ph. 970-858-3629, x-5; Fax 970-858-0461 Mr. Fred Judson, Research Associate /
Foundation Bean Manager fred.judson@colostate.edu
1910 L Rd., Fruita, CO 81521
Ph. 970-858-3629, x-4; Fax 970-858-0461 Dr. Stephen Menke, Enologist
stephen.menke@colostate.edu
3168 B ½ Rd., Grand Junction, CO 81503 Ph. 970-434-3264, x-202; Fax 970-434-1035 Mrs. Amy Montano, Research Associate
amy.montano@colostate.edu
3168 B ½ Rd., Grand Junction, CO 81503 Ph. 970-434-3264; X-206, Fax 970-434-1035 Mr. George Osborn, Research Associate
george.osborn@colostate.edu
30624 Hwy. 92, Hotchkiss, CO 81419 - 9549 Ph. 970-872-3387, x-4; Fax 970-872-3397 Dr. Calvin Pearson, Research Agronomist
calvin.pearson@colostate.edu
1910 L Rd., Fruita, CO 81521
Ph. 970-858-3629, x-2; Fax 970-858-0461 Dr. Ramesh R. Pokharel, Nematologist / Fruit
Pathologist
ramesh.pokharel@colostate.edu
3168 B ½ Rd., Grand Junction, CO 81503 Ph. 970-434-3264 x-203; Fax 970-434-1035 Mr. John Wilhelm, Research Associate
john.wilhelm@colostate.edu
3168 B ½ Rd., Grand Junction, CO 81503 Ph. 970-434-3264, x-207; Fax 970-434-1035
Colorado State University Agricultural Experiment Station Technical Report TR12-15
Page 6
Advisory Committee
The Western Colorado Research Center (WCRC) Advisory Committee has two roles - advocacy and advisory. The advocacy role is to actively promote WCRC research and outreach activities with policy makers, producers, and the general public. Advocacy is the primary mission of the Committee. The advisory role is to provide input and feedback on research and outreach activities conducted through the programs of the Western Colorado Research Center.
The members of the WCRC Advisory Committee for 2011 are listed below. Committee members serve voluntarily without compensation. WCRC Advisory Committee meetings are open to the public. For the current membership list please visit our web page: http://www.colostate.edu/programs/wcrc/.
Steve Aquafresca 637 27 ½ Road Grand Junction, CO 81506 Steve.aquafresca@mesacounty.us Nancy Janes 130 31 Road Grand Junction, CO 81503 wwhill@whitewaterhill.com Frank Kelsey 2835 Acrin Court Grand Junction, CO 81503 fkelsey@highcor.com Randy Kramer 2400 Mesa Drive Olathe, CO 81425 Randy.kramer@co.nacdnet.net Nathan Moreng
2764 Compass Drive, Suite 232 Grand Junction, CO 81506 Nathan.moreng@colostate.edu Richard Nunamaker 640 Leon Street Delta, CO 81416 grandmesavineyards@earthlink.net Maylon Peters 62757 Jeremy Road Montrose, CO 81401 Mjpeters42@msn.com Bruce Talbott 497 34 ¾ Road Palisade, CO 81526 bruce@talbottfarms.com Harvey Tashiro 3386 C ½ Road Palisade, CO 81526 Harvey@luckyducksfarm.com
Colorado State University Agricultural Experiment Station Technical Report TR12-15
Page 7
SECTION I
Colorado State University Agricultural Experiment Station Technical Report TR12-15
Page 8
Joint Colorado and Nebraska Wine Quality Assurance Study
Wine Sensory Evaluation Using Quantitative and Hedonistic Panels and a Composite Score
S. D. Menke
1and S. L.Cuppett
2Summary
Evaluation of sensory quality for wines is a difficult problem. Wine is a highly diversified product, which makes applying uniform sensory quality standards very difficult. Also, definitions of sensory quality and market value are often confused. In the method outlined in this article, we attempt to provide a wine sensory quality evaluation system that has both a consumer reference standard and quantifiable aroma standards. We create a sensory evaluation system for wine that combines a traditional hedonistic expert wine tasting panel and a panel trained to smell and quantify wine sensory aroma fault chemicals. Each commercial wine sample evaluated is presented to each member of the fault panel and the hedonistic tasting panel. The evaluation scores of the two panels are combined by a formula to give an overall sensory score, expressed as a market value rating. This combined score is used, by the quality assurance organizations involved in this study, to assign a pass/fail market value rating. Each panel also makes written comments on wine sensory characteristics. Universally available market wine samples in similar price ranges are included in the evaluation. These ratings are compared between panels, and with the combined scores. Also, the comments are reviewed to see how noted sample characteristics vary by panel. This paper presents results of this method, used in a joint quality assurance evaluation of 138 Colorado and Nebraska commercial wines.
Introduction
Product evaluation by quality assurance (QA) methods is regarded as a necessary and integral part of production operations. If the product does not fit the expectations of the consumer of the product, the producer will suffer loss of sales and eventual marginalization or elimination of its product. This is especially true of a product, like wine, whose sale depends on being perceived as having unique characteristics that are deemed of superior quality and of good value.
Quality is defined as the degree to which a set of inherent characteristics fulfills requirements, whereas value is related to both intrinsic quality and image (Francis, et al, 2005).
Standards for QA evaluations of wine quality differ widely among major producing countries. Most standards are linked to labeling requirements that embrace the concept of terroir, which is broadly defined as the total natural environment of any viticultural site and its effect on the characteristics of the grapes and their resulting wine (Robinson, ed., 2006). Some major producing countries have very prescriptive and detailed government terroir standards for marketing, such as the AOC in France ( INAO ), the DOC in Italy (Italian law), and DO in Spain (Spanish law). Germany imposes standards that are a combination of terroir and grape chemical composition (Meinhard, 1971). Canada has standards both for terroir and freedom-from-fault sensory characteristics (VQA Ontario, VQA British Columbia). Most countries have generated uniform terroir standards that are less restrictive than France or Italy, including major producers like Australia, USA, South Africa, Chile, and ___________
Colorado State University, Dept. of Horticulture and Landscape Architecture, WCRC AES, 3168 B ½ Road, Grand Junction, CO 81503, 970.434.3264 ext.202, Stephen.menke@colostate.edu1
University of Nebraska at Lincoln, Dept. of Food Science and Technology2
Mention of a trade name or proprietary product does not imply endorsement by the author, the Agricultural Experiment Station, or Colorado State University.
Colorado State University Agricultural Experiment Station Technical Report TR12-15
Page 9
others. In the USA, almost all quality standardsare based on terroir standards plus some basic chemical testing for selected chemicals with proscribed legal safety or tax-related limits. (TTB Regulations). There are global standardization organizations, like ISO and SQF (ISO standard, SQF standard), that have generated uniform voluntary QA methods standards for food, including wine. Entities using these standard QA methods can participate in uniform certification processes. Individual countries or companies can use these methods to generate their own specific QA standards. For example, Australia uses SQF methodology in its Wine Corporation Act of 1980 (Wine Australia). However, only a few countries have required human sensory QA standards used for marketing wines. These standards are usually a faults-free standard, and are always done by expert hedonistic panels. Examples of hedonistic sensory export standards are DOC and DOCG in Italy and VQA in Canada. Some geographical wine areas have instituted self-imposed voluntary standards that incorporate hedonistic and/or chemical testing. Some examples in the USA are: Napa Valley, (Napa Valley Vintners), Lake Erie AVA (LEQWA), Pennsylvania (PWQI, PQA), Ohio (OQW), New Jersey (NJQWA), and Iowa (IQWC).
Though hedonistic and/or chemical testing is the norm for quality assurance of wine, there are several large problems with these methods. Chemical testing generally consists of tests against quantitative standards for pH, alcohol, titratable acidity, organic acids, reducing sugars, free SO2, volatile acidity, and presence of microbiological contaminants. The problem is that these tests are not the same as the human sensory apparatus, and thus are poorly correlated with the consumers’ hedonistic impressions of aroma and taste quality at time of purchase. Hedonistic expert ratings are often used for market QA standards. These range from writers who make highly regarded ratings of commercial wines, such as Robert Parker in Wine Advocate magazine, to wine competition medals, to expert panels for most regional wine quality assurance systems. The large problem with these ratings is that they are not subject to replications, uniform control samples, verifiable standards, or uniform training of panelists, and
thus are not statistically consistent across evaluations. A recent study (Hodgson, 2008) bore out the inability of the same expert panelists to repeat evaluations consistently on the same wines. There is a testing service, Enologix (Darlinton, 2005), that correlates grapes and wine by quality standards derived from a database of wines categorized by industry price and expert hedonistic evaluations. However, these database standards for price and hedonistic evaluations are proprietary and not subject to independent analysis.
Sensory testing of wine consumer hedonistic components is done by researchers using various sensory techniques, usually permutations of Quantitative Descriptive Analysis (Kemp, et al, 2009). Principal Component Analysis (Abdi and Williams, 2010) (Chapman, et al, 2001) is usually done on these descriptions to yield wine sensory profiles. Countless chromatographic separations of wine aromatic chemicals have been done over the years (Pola´sˇkova´, et al,
2008). It is theoretically possible that good correlations of consumer sensory panels, chromatically separated and quantified aroma chemicals, and consumer perceptions of these chemicals could be done and organized into standardized consumer profiles for wines. Some limited quantifiable and standardized consumer profiles have been done. One beverage example is bitterness in beer (da Silva, et al 2012). However, this is an extremely expensive and laborious process, mostly done for a limited number of aromatic components. The industry will not bear the QA costs and time necessary to evaluate the huge number of aromatic chemicals in wine, especially over the wide diversity of grape varieties in wines and small lot sizes of wine production. Evaluation is further complicated by the large variation of styles, geographic and vintage differences, and wide array of winemaking techniques in wines.
So, if strictly hedonistic sensory analysis is unreliable for QA as it relates to the wine consumer, and if chemical standards do not relate easily to sensory evaluation, and if statistically reliable standards that correlate well between hedonistic and quantitative sensory standards are expensive to develop, then what QA approach do we take? Is it possible to develop a QA method for wine that is both
Colorado State University Agricultural Experiment Station Technical Report TR12-15
Page 10
relatively inexpensive, and yet provides somecorrelation of hedonistic and quantitative sensory standards? One possibility is to meld the scores of a panel trained to a quantifiable set of wine aroma fault chemical standards with the scores of a highly experienced hedonistic panel. The resulting combined score could then serve as a link between the reasons for sensory rejection by consumers of wine aroma and taste faults and the reasons for their overall sensory impression of the combined attributes and faults of a wine.
In this paper we will describe testing a methodology that attempts to evaluate wines by a quantitative set of standards for wine aroma fault chemicals that is combined with a
hedonistic panel aroma and taste evaluation to give a combined score. The test described in this paper will be evaluated to see if the perceived market value is consistent within each panel, among the panels and with the combined panel score.
Scores of the panelists from an Aroma Faults Panel are added to the scores of the Hedonistic Tasting Panel by a formula to give a Combined Panels Score [See Materials and Methods
below]. This combined score is designed to
correlate the detection of quantitative amounts of fault chemicals with the qualitative consumer evaluation. The applicability of the Combined Score is tested in this study.
Materials and Methods
Evaluation Panels and Protocols
Two panels are used for this study, a Hedonistic Tasting Panel, and an Aroma Faults Panel. This study has four panelists on each panel, instead of five as designed, due to limitations of number of booths in the laboratory used [See Results and
Discussion]. Each panelist on both panels
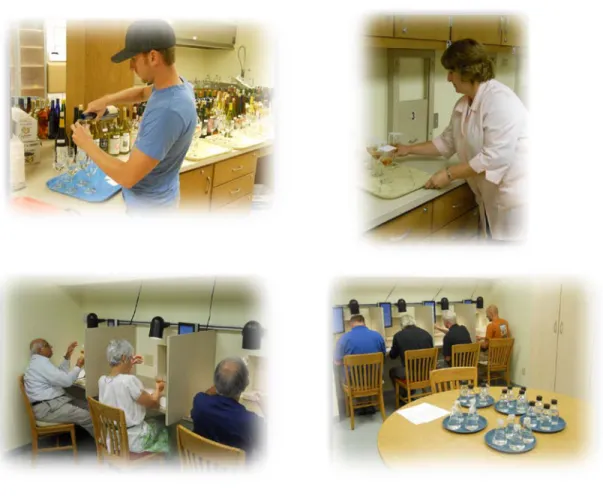
scores each wine sample separately and blindly. Every individual in both panels scores the wine sample in isolation, using individual sensory booths in a controlled-atmosphere sensory laboratory. A 40 ml sample of wine is poured from freshly opened bottles into a 200 ml glass (standard seven ounce winery tasting room glass) and capped with paper for at least 30 seconds prior to delivery to a panelist. Each panelist is instructed to re-cover the sample for 30 seconds before re-sampling. The scoring criteria are separate for each panel. Each panel has a separate sampling protocol. The Hedonistic Tasting Panel lifts the cover off the glass, sniffs the sample just at the rim of the glass, then swirls briefly before tasting a small sip, rinsing the sip around the mouth, then spitting out the sample. The Aroma Faults Panel lifts the cap from the glass, and sniffs at the rim of the glass. Both panels use the same procedure to clear out sample effects between samples. Each panelist rinses with and spits out or swallows water between samples and then inhales and exhales several times through the nose.
Aroma Faults Panel Training and Selection Prior to serving as panelists on the Aroma Faults Panel, all panelists undergo a prescribed course of sensory training (Menke, 2009). This course contains an introduction to sensory science and incorporates QDA methodology to learn how to individually identify aroma faults and to quantify the detection of each fault to each one’s native ability and experience.
Because the course enables participants to learn how they detect and perceive aromas and how to identify aroma faults, it is valuable in itself as a learning tool for quality assurance, both in production wineries and in marketing of wines. In fact, the training course is deemed valuable enough by the participants that they pay to take the training, whereas researchers and industry QA evaluators normally have to pay the costs of this training. These panelists have thus been prepared to serve on QA evaluations at no cost to the evaluation process, other than per diem costs.
It is notable that detection of an aroma usually begins at concentrations much lower than recognition. As well, fault aromas often suppress desired aroma attributes at detection levels well below recognition thresholds. So we can often sense a fault aroma by noting the changes in other aromas. In this training regimen, we define detection as a change in aroma from a control wine with no chemical added.
Colorado State University Agricultural Experiment Station Technical Report TR12-15
Page 11
Each panelist is calibrated to differencesdetection of eleven individual aroma fault chemicals, each over a non-linear range of four exact concentrations, those concentrations ranging from below detection to above the published recognition threshold (L. J. van Gemert, 2003) for each chemical [See Table 1]. Aroma detection at each concentration is defined by each panelist against seven consumer sensory definition terms. These seven terms are relatively scaled and are imposed upon a relative scale of four levels of consumer acceptance of the fault chemical [See Figure 1a]. All panelists are calibrated for their abilities to correlate the consumer definitions with quantitative amounts of each fault chemical. After training to each individual chemical, combinations of chemicals, involved in similar consumer fault terms, are presented to panelists over the same range of concentrations and consumer terms. This results in grouping some chemicals into the same perceptual consumer fault category. For example, ethyl acetate and acetic acid are grouped into a category called volatile acidity. In all, six consumer aroma fault categories are created from the eleven training chemicals. These categories are used for scoring by the Aroma Faults Panel [See Table 2]. For this study, each trained panelist on the Aroma Faults Panel has to be able to identify each consumer fault category, on the four term relative market value scale, within a range of two aroma chemical concentrations. Just before the evaluation session, all Aroma Fault panelists are recalibrated to their training solution concentrations.
Aroma Faults Panel Scoring
The score for each panelist for a sample is the result of adding up subtractions of up to 2 fault points for each of the six fault categories, and subtracting those points from a 12 point perfect score. The point score of each panelist is grouped with the other panelists, and the panel average score is determined. This average
contributes to the formula used for the Combined Panel Score. In addition, an intentional bias is given to the Aroma Faults Panel, in that it can automatically disqualify a wine from being included in the combined score. This reflects the observation that wines with detectable aroma fault chemicals at higher levels of detection are almost universally offensive, and thus are heavily discriminated against by consumers (Bisson, 2001). A panelist may contribute to disqualification of a sample by giving a failing score in any category or by taking off 7 or more points across all categories. If the majority of the panelists in the Aroma Faults Panel fail the sample in at least one fault category or in total points taken off across categories, the wine will be automatically disqualified from the combined scoring process. Disqualified wines cannot participate in the formula to determine a Combined Score, but are automatically treated as if they had a failing Combined Score.
Hedonistic Tasting Panel Selection
The Hedonistic Tasting Panel consists of panelists who are expert tasters. They are selected by the breadth and depth of their experience in competition and quality assurance hedonistic judging, and are further selected by references. They are designed to represent a highly expert consumer opinion of the market value of a wine. This panel scores use a twenty point modified Davis quantitative scale, with a super-imposed relative scale of market values
[See Figure 1b].
Hedonistic Tasting Panel Scoring
The score for each panelist [See Table 2], out of twenty possible points, will be grouped with the other panelists and averaged. This average score contributes to the formula used for the Combined Panel Score. This panel cannot automatically disqualify a sample, no matter what the average score is for the panel.
Colorado State University Agricultural Experiment Station Technical Report TR12-15
Page 12
Combined Panel Score and Quality Assurance Pass/FailThe combined score for qualified wines is by the following formula:
[12 – (aroma panelists ave. deduction score) + (hedonic panelists ave. score)] = Combined Score
The Combined Score is used to determine the pass/fail status of qualifying samples. In this study, if a qualifying sample has a score of ≥ 0.70 = 22.4/32 points, it has acceptable market value.
The Combined Score is also used to determine Combined Score Market Value by converting it to a percentage as follows:
[12 – (aroma panelists ave. deduction score) + (hedonic panelists ave. score)] = Combined Score 32 possible points Market Value
Results and Discussion
Statistical Values
A pre-trained Aroma Faults Panel of four panelists and a Hedonistic Tasting Panel of four panelists were convened and blindly sampled 138 wine samples, including 129 wines from Colorado and Nebraska and 9 nationally marketed control wines, as part of a joint test of the Colorado Quality Assurance Program method of using combined panels. The statistical results are summarized below [See
Table 3].
For each panel, panelist’s scores for each sample were averaged and standard deviations were computed for each sample. The average score of all samples was also computed for each panel, as well as the panel average of all of the standard deviations for all samples. As well, the percentage of points out of possible points for the average score, called a Market Value score, was computed for each panel. A Market Value Combined Score of 70 % or greater was deemed acceptable for commercial sale.
For each of the Hedonistic Panel and the Aroma Panel, the average standard deviation among panelist scores was low (1.66 and 0.93, respectively), indicating internal consistency of panelists within each panel over the range of samples. Given this, it is notable that there was a difference of 24% in the average % of possible points between the two panels, as well as a 24% difference in commercial acceptability, indicating that the two panels had differing applications of the effects of their different evaluations on the market values of the samples. The Hedonistic panel (ave. score of 64.00% and market acceptability of 76.00%) was tougher on
the perception of overall quality than the Aroma Panel (average score of 88.00% and market acceptability of 100%). When the Combined Score formula is applied, the Hedonistic Panel has a greater effect on the Combined Score than the Aroma Panel by a constant of .625/.375, bringing the Combined Score to an average score of 73% and market acceptability of 72.70%.
Differing Intents of the Hedonistic and Aroma Panels
The design of the Combined Score method allows the Aroma Panel to use a relative scale of market value terms, but have each of these relative market value terms proscribed to quantitative detection ranges of each aroma chemical. This way, one can observe the effect of training to quantifiable aroma fault concentrations on the perception of market values. By allowing the Aroma panel to evaluate levels of fault chemicals and to disqualify a wine having higher quantities of one or more fault chemicals, a mimic is created of what level of aroma faults leads to consumer rejection of a faulted wine.
However, consumers do not just decide a wine’s fate by detection of aroma faults and rejection, but also by the counterbalancing effects of aroma attributes that are pleasing. The Hedonistic Panel is a mimic of this balance of all sensory parameters when consumer sensory selection of wines occurs.
Sources of Variability
What are the possible sources of the scoring differences in Market Value and Acceptability between panels [See Table 3] Does the
Colorado State University Agricultural Experiment Station Technical Report TR12-15
Page 13
Combined Score give a more useful MarketValue than either panel alone? Are potential problems with the design of the methodology exposed, and, if so, can they be alleviated? Sources of variability in the Aroma Faults Panel may lie with how the standards are set for scoring and for disqualification. For example, if the Aroma Fault Market Value relative scale was more discrete, would scoring and disqualification be more coordinate with the Market Value acceptability of the Hedonistic panel and the Combined Score? That is, if the panel were to choose values in quarter or tenth points, rather than cardinal numbers along the 3 point scale, would scores be more consistent with the Hedonistic and Combined Scores? Similarly, would a scale that allowed for a disqualification at a value between 2 and 3 points give more consistent rates of rejection? Another source of variability may be present in the number of panelists in the Aroma Panel. The Aroma Panel was designed to have five members, and in this study there were only four. This makes a difference in the level of panel members needed to disqualify a wine. Instead of 3 out of 5 panelists needed to disqualify a wine (60%), it took 3 out of 4 (75%). There were 10 wines of the 138 that had 50% of panelists voting disqualification and 50% just short of disqualification. If all 10 of these wines would have been disqualified with a five member panel, it would have lowered the Market Value acceptability score on the Aroma Panel by approximately 10%.
By utilizing the Aroma Faults Panel, we know the exact range of quantities detected by the panel during training and can recalibrate them to those concentrations just before the evaluation session. Thus, making the scoring system more discrete will not change the level of detection by the panelist, just fine tune the accuracy of the scoring.
Sources of variability in the Hedonistic Panel are more straightforward, but lie mostly in the lack of sample repetitions. The Hedonistic panel members are not trained to apply quantifiable standards like the Aroma Panel. Since a very discrete 20 point scale is used, the size of the average standard deviation is a good indicator of scoring consistency, though it says nothing about scoring accuracy, since panelists only
have a consensus standard, based on variable experience and variable hedonistic training. The only source of variability in the Combined Score lies in the actual formula, which depends on the ratio of points between the Aroma and Hedonistic Panels that are used to derive the Combined Score. The only way to address this is to change the scoring ratio of the panels and see what the effect is on the Combined Score and the market value.
Panelist Comments
Both panels made comments on the samples as they scored them. These comments are intended for the wineries submitting the samples, and are only released to the individual wineries. It is hoped that both the comments and the actual evaluation scores will be used by the wineries as instruments of quality control. These comments are not quantifiable, but examination of the comments shows that perceptions of the type and degree of wine faults are often different between the Aroma Fault and Hedonistic panels. This is likely an indication of the inherent bias of the Aroma Fault panel only looking for fault levels and the Hedonistic panel balancing faults and positive attributes.
Conclusions and Future Study
This study is currently being repeated with the Colorado and Nebraska quality assurance programs to gather more data. Similar studies are occurring with this system in another quality assurance program in Pennsylvania. Therefore, we will soon have enough combined data to better judge the overall effectiveness of the system.
This study only included control wines judged as acceptable in the general market at a similar price level to the submitted samples. For future studies, it will be necessary to include direct sample comparisons with other quality assurance or commercial evaluation systems. This would mean including more control market wines over a greater range of already accepted market values, as defined by price, rating by critics, rating by other quality assurance systems, and medals won at recognized national and international competitions. This would give a better measure of the true differences among the systems in determining market value.
Colorado State University Agricultural Experiment Station Technical Report TR12-15
Page 14
A future study using the Combined Scoresystem could use differently weighted scoring ratios between the panels, to see if it changes the effect of each panel on the market value calculation.
The effects of altering the quantitative amount/market value calibration of faults detection by the Aroma Panel should be examined more closely. This could be done by either having the scoring done with finer discretions of the relative scales or by using more levels of discrete concentrations within the range used for training the panelists. The panelists would not need to be trained differently, but just trained to finer calibration within their already established range of detection.
At this point, the results have been welcomed by the participant wineries in Colorado, Nebraska, and Pennsylvania. This system seems to engender a higher level of trust among commercial wineries, due to the perceived value of the training received by the Aroma Faults panelists. As more studies using the Combined Score system are done, and as more comparisons are done directly on samples evaluated by other systems, comparative data can be generated. This data then needs to also be tested by surveys at the wholesale and retail purchase level, to compare the market values assigned by the various evaluation systems to actual levels of consumer acceptance.
Figure 1: Preparing samples for presentation to wine QA panelists. Figure 2: Blind presentation of samples to panelists. Figure 3: Evaluation of samples by Hedonistic panelists. Figure 4: Calibration references and evaluation of wine samples by Aroma Faults panelists.
Colorado State University Agricultural Experiment Station Technical Report TR12-15
Page 15
Table 1. Faults Concentration Range (Wine) for Aroma Panel TrainingChemical Fault Category Published Wine Recognition Threshold Training Amount Solution 1 Training Amount Solution 2 Training Amount Solution 3 Training Amount Solution 4 ethyl acetate volatile
acidity 50-300 ppm 10 ppm 200 ppm 500 ppm 2000 ppm acetic acid volatile
acidity 500-1100 ppm 50 ppm 500 ppm 1000 ppm 4000 ppm acetaldehyde oxidized 100-300 ppm 10 ppm 100 ppm 500 ppm 2000 ppm 2,4,6-trichloranisole corked 4-50 ppt 0.5 ppt 5 ppt 50 ppt 5000 ppt SO2 acrid,burnt tingle 60-120 ppm 10 ppm 50 ppm 100 ppm 200 ppm ethanethiol reduced sulfur 0.5-1 ppb 5 ppt 1 ppb 10 ppb 100 ppb Diethyl disulfide reduced sulfur 2-5 ppb 20 ppt 2 ppb 50 ppb 500 ppb H2S* *approximate values -highly reactive reduced sulfur 1-10 ppb* 10 ppt* 5 ppb* 50 ppb* 500 ppb* 4-ethylphenol brett-like 100-150 ppb 1.5 ppb 50 ppb 400 ppb 4000 ppb 4-ethylguaiacol brett-like 50-500 ppb 500 ppt 250 ppb 1000 ppb 5000 ppb Isovaleric acid brett-like 30-100 ppb 500 ppt 250 ppb 500 ppb 5000 ppb Market Value Range (as per Figure 1a) 1 to 3 = detected flaw up to recognized unaccepted fault 0 to 2 = not detected up to recognized flaw 1 to 3 = detected flaw up to recognized unaccepted fault 1 to 3 = detected flaw up to recognized unaccepted fault 2 to 3 = recognized flaw up to recognized unaccepted fault
Colorado State University Agricultural Experiment Station Technical Report TR12-15
Page 16
Fig. 1a Super-imposed Relative Scales of Consumer Fault Concentrations and Market AcceptabilityTerms for Aroma Faults Panel Training and Evaluation
Evaluation 0______________1___________________2____________________3 NNN DNR DF L DF T
Training --- NNN RNF RF L RF T Training ---
ppm amount Lowest ppm published thr eshold highest ppm
0 = no chemical detected, highly acceptable
1 = some minor amount of chemical, acceptable
2 = noticeable amount of chemical, flawed and still somewhat acceptable 3 = large amount of chemical, faulted and unacceptable
NNN = no fault aroma detected
DNR = detected aroma, but not recognized or flawed
DFL = detected aroma, not recognized, flawed DFT = detected aroma, not recognized, faulted
RNF = aroma recognized, but not flawed RFL = aroma recognized, flawed RFT = aroma recognized, faulted
Fig. 1b Super-imposed Relative Scales of Modified Davis Hedonistic Quality Score and Market Acceptability for Hedonistic Tasting Panel Evaluation
.__.__.__.__.__.__.__.__.__.__.__.__.__.__.__.__.__._ .__._ .
0 1 2 3 4 5 6 7 8 9 10 11 12 13 14 15 16 17 18 19 20
---
U
O G E
S
U = unmarketableO = ordinary market value
G = good market value E = excellent market value S = superior market value
Colorado State University Agricultural Experiment Station Technical Report TR12-15
Page 17
Table 2. Evaluation Scoring for Hedonistic and Aroma Faults PanelsHEDONISTIC PANEL
Score 0-20 points relative to marketability of sample. Panel average is used in formula for Combined ScoreAPPEARANCE Color and Clarity 0-3 points Aroma/Bouquet
Intensity, Complexity, Character of variety or style 0-5 points TASTE
Fruit-sweet/acid balance, retro-nasal intensity, complexity, varietal character, lack of faults 0-6 points BODY
Appropriate tannin, bitters and astringency, appropriate warmth 0-3 points AFTERTASTE/FINISH
Retro-nasal persistence, appropriate persistence of acid/bitter/astringency, lack of faults 0-3 points TOTAL POINTS
QUANTITATIVE FAULTS PANEL
Points are deducted for amount of chemical detected in each fault category . Each panelist can score a sample disqualification for a deduction of 3 points in any category or for a sum of categories of 7 points deducted or more. Panel average deduction of 7 points or more disqualifies wine, or if a majority of panelists have at least one disqualifying deduction in any category.VOLATILE ACIDITY
Ethyl acetate, acetic acid 0,1,2 points deducted 3-DISQUALIFY OXIDATION
Acetaldehyde 0,1,2 points deducted 3- DISQUALIFY CORKED
2,4,6 trichloranisole 0,1,2 points deducted 3- DISQUALIFY SULFITES
SO2 0,1,2 points deducted 3- DISQUALIFY REDUCED SULFUR
H2S, ethanethiol, diethyldisulfide 0,1,2 points deducted 3- DISQUALIFY BRETT
4-ethylphenol, 4-ethyl guaiacol, isovaleric acid 0,1,2 points deducted 3- DISQUALIFY TOTAL POINTS DEDUCTED
Colorado State University Agricultural Experiment Station Technical Report TR12-15
Page 18
Table 3. Comparison of Market Value by Panels and Combined ScoreMarket Value Category
Percentage of Total
Samples
% Wines with Accepted Market Value
Combined Score
72.70
% Wines with Accepted Market Value
Aroma Panel Score
100.00*
% Wines with Accepted Market Value
Hedonic Panel Score
76.00
Average Sample Score
by Panel
Ave. of Combined Scores
23.26/32 = 73 % Market
Value
Std. Dev. of Combined Scores
1.88
Ave. of Aroma Scores
10.51/12 = 88% Market
Value
Ave. of Std. Devs. of
Aroma Panelist Scores
0.93
Ave. of Hedonic Scores
12.75/20 = 64% Market
Value
Ave. of Std. Devs. of
Hedonic Panelist Scores
1.66
*[See Results and Discussion]
Bibliography
Abdi, H. and Williams, L.J., 2010, Principal component analysis, Wiley Interdisciplinary Reviews: Computational Statistics, 2: pp. 433–459.
Bisson, L., 2001, Course VEN124 Wine Production, Lesson 1,
http://lfbisson.ucdavis.edu/PDF/VEN124%20Section%201.pdf
Chapman K.W., et al, 2001, Quantitative Descriptive Analysis and Principal Component Analysis for Sensory Characterization of Ultrapasteurized Milk, J. Dairy Sci. 84: pp.12–20
Darlington, D., The Chemistry of a 90+ Wine, August 7, 2005, The NY Times Magazine http://www.nytimes.com/2005/08/07/magazine/07ENOLOGI.html?pagewanted=all Da Silva, et al, 2012, Correlation of quantitative sensorial descriptors and chromatographic
signals of beer using multivariate calibration strategies, Food Chem. 134: pp. 1673–1681
Francis, L., et al, 2005, Objective measures of grape quality - are they achievable?, ANZWIJ, 20:3: pp.12-19
Colorado State University Agricultural Experiment Station Technical Report TR12-15
Page 19
• Hodgson, R., 2008, An Examination of Judge Reliability at a major U.S. Wine Competition,o Journal of Wine Economics, 3:2: pp. 105–113 • INAO, http://www.inao.gouv.fr/
• IQWC, http://iowawinegrowers.org/pdfs/IQWCguidelines_20120522.pdf • ISO Beverage Standards, http://www.iso.org/iso/home.htm
• Italian DOC law, LEGGE 10 FEBBRAIO 1992, N. 164,
o http://members.xoom.virgilio.it/mercurio2000/vino/L100292.htm
• Kemp, S.E., et al, 2009, Sensory Evaluation, a Practical Handbook, Wiley-Blackwell, pp. 96-119
LEQWA, http://www.lakeeriewine.com/ Meinhard, H., 1971, German Wines, Oriel Press
Menke, S., 2009, Colorado Wine Industry Quality Assurance Program, Wine Aroma Faults Panelist Training Manual, Colorado State University
Napa Valley Vintners, http://napavintners.com/
NJQWA, http://www.newjerseywines.com/qualitywine.html
OQW, http://www.grapeandwineryboard.nebraska.gov/oqw_overview_nebraska2010.pdf
Pola´sˇkova´, P., et al, 2008, Wine flavor: chemistry in a glass, Chem. Soc. Rev., 2008, 37, pp. 2478–2489
PWQI, http://wine.appellationamerica.com/wine-review/547/Quality-Assurance.html http://extension.psu.edu/enology/wine-production/workshop-seminar-summaries Robinson, J., ed., 2006, Oxford Companion to Wine, pp. 693-695
Spanish law, Ley 24/2003 de la Viña y del Vino,
http://noticias.juridicas.com/base_datos/Admin/l24-2003.html SQF Standards, http://www.sqfi.com/
TTB, Code of Federal Regulations, Title 27 CFR, Parts 1, 4, 9, 12, 13, 16, 24, 27, 28, 107-188 http://ecfr.gpoaccess.gov/cgi/t/text/textidx?c=ecfr&tpl=/ecfrbrowse/Title27/27tab_02.tpl van Gemert, L. J., 2003, Odour Thresholds, Oliemans Punter and Partners, pp. 5
VQA Ontario, http://www.vqaontario.com/Home VQA British Columbia, http://www.winelaw.ca/cms/
Colorado State University Agricultural Experiment Station Technical Report TR12-15
Page 20
SECTION II
Colorado State University Agricultural Experiment Station Technical Report TR12-15
Page 21
Roundup-Ready Soybean Variety Performance Trial and
Number of Seed Rows on a Bed at Fruita, Colorado 2011
Calvin H. Pearson1
Summary
Commercial acreage of soybeans is being grown by some producers in the Grand Valley of western Colorado. Soybeans are of interest to growers in the area because they are relatively easy to grow. Also, growers currently have the equipment to grow soybeans, and soybeans work well in rotation with other crops grown in the area such as corn. Soybeans do not require high levels of costly production inputs and soybeans provide organic nitrogen for succeeding crops. Furthermore, in many years farm gate prices for soybeans have been attractive. Numerous new Roundup-Ready soybean varieties continue to be available for commercial production. The objective of this research was to evaluate ten Roundup-Ready soybean varieties for seed yield and related agronomic performance. Weed control in the soybean variety trial in 2011 was excellent. Weeds in the field and plot area were controlled with two Roundup applications. Maturity ratings for the ten varieties ranged from Group 2 to mid-Group 3. Average seed yield of the ten soybean varieties was 2702 lbs/acre (45.0 bu/acre). Seed yields ranged from a high of 3098 lbs/acre (51.6 bu/acre) for S31-L7 to a low of 1846 lbs/acre (30.9 bu/acre) for S20-Y2. Seed yield for the twin seed rows was 221 lbs/acre (3.7 bu/acre) higher than the single seed row. The represents an 8.5% increase in yield when twin seed rows were compared to yields on a single seed row on a 30-inch bed. Compared to a single seed row on a 30-inch bed, planting twin seed rows also increased plant population, seed moisture at harvest, matured slightly later, was taller, set the first pod higher up on the bottom of the plant, and reduced shattering. Based on one year of field results, planting twin seed rows of soybean on a 30-inch bed would be advantageous for commercial soybean producers in western Colorado. Also, Roundup-Ready soybean varieties provide producers with a convenient, cost-effective, and highly effective weed control management tool that results in weed-free fields and promotes soybean productivity. In general, soybean varieties with late maturity Group 2 and early maturity Group 3 produced the highest seed yields.
Introduction
Commercial acreage of soybeans is being grown by some producers in the Grand Valley of western Colorado. New soybean varieties continue to be available for use in commercial agriculture. Selecting the proper variety for local adaptation and performance is critical to the profitability of producing soybean.
Weed control can be a major challenge and can contribute significantly to seed yield variations. Commercial production of soybean using Roundup-Ready varieties offers producers with considerable crop management flexibility. Roundup-Ready soybean varieties can be planted on a more timely and flexible basis than conventional soybeans given that conventional soybean varieties require the use of herbicides that have to be applied following detailed and timely procedures. Commercial production of Roundup-Ready soybean varieties allows for flexible timing application and relative ease for control of weeds during the growing season. Furthermore, applying Roundup can be accomplished more quickly and often with fewer concerns for weed control than operations involving cultivation.
In 2004, a soybean trial was conducted at the
__________________ 1
Contact information: Colorado State University Agricultural Experiment Station, Western Colorado Research Center – Fruita, 1910 L Road, Fruita, CO 81521. Ph. 970-858-3629; Fax 970-858-0461; email: calvin.pearson@colostate.edu
Mention of a trade name or proprietary product does not imply endorsement by the author, the Agricultural Experiment Station, or Colorado State University.
Colorado State University Agricultural Experiment Station Technical Report TR12-15
Page 22
Soybean plot samples being processed in the field lab for seed yield, seed moisture, and test weight following harvest in 2011. Photo by Calvin Pearson.
Western Colorado Research Center at Fruita to evaluate new Roundup-Ready soybean varieties for their adaptation and performance under local conditions (Pearson, 2005). These Roundup-Ready soybean varieties evaluated in 2004 were found to perform similar to the conventional varieties evaluated in western Colorado during the period 1986-1989.
Research conducted in western Colorado years ago showed that the multiple seed rows per bed increased yields (Pearson and Golus, 1988; Pearson et al., 1989). Bruns (2011) recently conducted research in Mississippi and he did not promote twin-row soybean production, but neither did he discourage planting twin seeds rows.
The objective of our 2011 research was to evaluate Roundup-Ready soybean varieties for seed yield and related agronomic performance and determine how these varieties are likely to perform when produced commercially in the Grand Valley of western Colorado. An additional objective in 2011 was to evaluate soybean performance when planted in single and twin-seed rows on 30-inch beds.
Materials and Methods
Soybean Variety Performance Trial
A Roundup-Ready® soybean variety performance test was conducted at the Western Colorado Research Center at Fruita, Colorado during 2011. The experiment was a randomized complete block with four replicates.
Ten varieties were included in the trial. Plot size was 5-feet wide by 25-feet long (2, 30-inch rows). The previous crop was corn.
Planting occurred on 6 June 2011 with a cone plot planter. Seeding rate was approximately 185,000 seeds/acre.
Glyphosate (Glystar) herbicide at 2 qt/acre plus ½ pt/acre of Activator 90 plus ½ pint/acre Maximizer plus 1.5 qt. of urea ammonium nitrate fertilizer in 100 gals of water was applied at 30 psi in 20 gallons/acre on 14 June 2011. Another application of glyphosate (Glystar) herbicide at 2 qt/acre plus 1 qt/acre of Activator 90 plus 2 gal. of urea ammonium nitrate fertilizer per 100 gal. of water was applied at 40 psi using 27 gallon/acre on 14 July 2011.
The experiment was furrow-irrigated using gated pipe. The plot area was irrigated eight times during the season, averaging 24 hours per irrigation set. Plots were harvested on 10 Oct. 2011 using a Hege small plot combine.
Data were collected for seed yield, seed moisture, test weight, plant population, days to maturity, plant height, height to first pod, test weight, seed shattering, and seeds/lb. Seed moisture and test weight were obtained using a Seedburo GMA-128 seed analyzer. Seeds/lb was determined by hand-counting 200 seeds followed by calculating the number of seeds per pound.
Number of Seed Rows per Bed
In 2011 we planted a single seed row and twin-seed rows on 30-inch beds with 8 inches between the seed rows. The ten soybean varieties in the variety trial were planted on both single and twin-seed rows. Crop production practices and data collection were similar to the variety performance trial.
Results and Discussion
Weed control across the entire plot area was excellent. Application of Roundup was convenient and provided considerable flexibility in applying the herbicide and obtaining effective weed control. Weeds in the field and plot area were readily controlled with the two Roundup applications.
The cost of applying Roundup for commercial production of Roundup-Ready soybeans in
Colorado State University Agricultural Experiment Station Technical Report TR12-15
Page 23
western Colorado, based on rates, applicatorcosts, and adjuvants used in our study, ranges from $20 to $25 per acre per application.
The 2011 growing season in the Grand Valley was short at 157 days. The last spring killing frost occurred on May 3 (28ºF) and the first fall killing frost occurred on October 7 (28ºF). The average growing season for the Grand Valley is 181 days (28ºF). Adequate irrigation water was available during the growing season and was not a limiting factor for crop production.
Soybean Variety Performance Trial
Maturity ratings of the ten varieties ranged from Group 2 to mid-Group 3 (Table 1). Seven varieties were Maturity Group 2 and three varieties were Maturity Group 3.
Average seed moisture content at harvest was 9.6% (Table 1). There were significant differences among soybean varieties for seed moisture. Soybean variety S34-N3 had the highest seed moisture content at 10.5%. S20-Y2 had the lowest seed moisture content at harvest at 8.6% and it was an early-maturing variety with a maturity rating of 2.0. In 1987, average seed moisture content of the 15 varieties evaluated in a variety performance test was 6.4% (Pearson and Golus, 1988).
Average seed yield for the ten soybean varieties was 2702 lbs/acre (45.0 bu/acre) (Table 1). Seed yields ranged from a high of 3098 lbs/acre (51.6 bu/acre) for S31-L7 to a low of 1846 lbs/acre (30.9 bu/acre) for S20-Y2. Other high yielding soybean varieties in this study were S34-N3, S28-K1, S28-B4, and S30-F5.
Yields obtained in the 2011 trial were lower compared to yields obtained in previous research conducted in western Colorado in the 1980s and in 2004. Highest seed yields obtained in previous research conducted in the Grand Valley were 73.6 bushels/acre in 1986 (Pearson et al., 1987), 67.8 bushels/acre in 1987 (Pearson and Golus, 1988), 61.9 bushels/acre in 1988 (Pearson, et al., 1989), 55.7 bushels/acre in 1989 (Pearson et al., 1990), and 51.5 bushels/acre in 2004 (Pearson, 2005).
Test weight in 2011 averaged 57.6 lbs/bu and ranged from a high of 58.5 lbs/bu for S31-L7 and S34-N3 to a low of 56.6 lbs/bu for S20-Y2 (Table 1). There were significant differences among the ten soybean varieties for test weights.
Test weights in 2011 were comparable to those obtained in most other years. In 2004, test weights averaged 56.6 lbs/bu (Pearson, 2005). In 1986, test weights averaged 58.3 lbs/bu (Pearson et al., 1987), 57.8 lbs/bu in 1987 (Pearson and Golus, 1988), 57.2 lbs/bu in 1988 (Pearson et al., 1989), and 56.3 lbs/bu in 1989 (Pearson et al., 1990).
Average plant population in 2011 in the soybean variety performance study was 120,153 plants/acre (Table 2). S28-B4 soybean variety had the highest plant population at 137,214 plants/acre and S20-Y2 had the lowest plant population at 105,270 plants/acre. Seed quality of the soybean varieties may have been a factor that contributed to the wide range in plant population among the varieties. Based on previous research in western Colorado, grain yields increased as plant populations increased up to 170,000 plants/acre (Pearson et al., 1989). Thus, plant population in 2011 could have been a limiting factor for obtaining higher seed yields, although we also had a shorter growing season than normal.
The average number of days for the soybean varieties to reach maturity was 104 (Table 2). Soybean variety S20-Y2 matured earlier than other varieties at 99 days and S31-L7 and S34-N3 required 112 days to reach maturity.
Plant height in 2011 averaged 29.3 inches and the tallest variety was S30-F5 at 37.0 inches (Table 2). The shortest variety was S22-C5 at 22.4 inches. In 2004, the average plant height of 23 soybean varieties was 47.0 inches. The range in plant height in 2004 was from 37.6 to 54.7 inches (Pearson, 2005).
In 1987, the average plant height of 15 soybean varieties was 37.7 inches. The range in plant height in 1987 was from 29.4 to 49.0 inches (Pearson and Golus, 1988). In 1988, average plant height of 21 soybean varieties was 37.0 inches. The range in plant height in 1988 was from 24.1 to 46.1 inches (Pearson et al., 1989).
Height to first pod is an important harvest factor. Pods that are produced close to the soil thus, reduce yields. Harvest efficiency is increased when the first pod is set higher up the plant. Average height from the soil surface to the first pod in 2011 was 4.5 inches (Table 2). Soybean varieties with the greatest height to the
Colorado State University Agricultural Experiment Station Technical Report TR12-15
Page 24
first pod were S31-L7 at 5.6 inches, S28-K1 at5.3 inches, S34-N3 at 5.1 inches and S30-F5 at 5.0 inches. Soybean varieties with the lowest height to the first pod were S22-C5 at 3.2 inches, and S21-E4 at 3.8 inches.
Average height from the soil surface to the first pod in the 2004 trial was much higher than that in the 2011 trial (Pearson, 2005). The average height to the first pod in 2004 was 9.1 inches and heights ranged from a high of 11.8 inches to a low of 6.8 inches.
In 1987, the average height to the first pod of 15 soybean varieties was 5.7 inches. The range in height to first pod was from 2.9 to 7.4 inches (Pearson and Golus, 1988). In 1988, average height to the first pod of 21 soybean varieties was 3.9 inches. The range in height to the first pod was from 2.6 to 5.3 inches (Pearson et al., 1989).
The desired height to the first pod should be at least 6 inches so the combine head will be able to cut low enough without leaving pods still attached to the stem and still be high enough that soil does not get into the head and into the combine. Thus, all of the varieties evaluated in 2011 had pod heights that were lower than desired.
Seed shattering for the ten varieties in 2011 averaged 1.5 (Table 2). The early-maturing variety S20-Y2 had the highest shattering rating at 3.8 while six of the ten varieties had shattering scores less than 1.5. Seed shattering for the twenty-three varieties in 2004 averaged 1.2 (Pearson, 2005). In 1987, seed shattering averaged 0.5 (Pearson and Golus, 1988), 0.7 in 1988 (Pearson et al., 1989), and 0.3 in 1989 (Pearson et al., 1990). Seed shattering in 2011 was higher than in other years. Rain events occurred in fall 2011 which delayed harvest. This harvest delay could have contributed to the higher seed shattering in 2011.
Average seed size for the ten soybean varieties was 2724 seeds/lb (Table 2). S21-E4 had the largest seed size at 2457 seeds/lb and S28-B4 had the smallest seed size at 3066 seeds/lb. There were significant differences among the soybean varieties for seed size. S31-L7 also had a small seed size. S28-K1 also had a large seed size at 2528 seeds lb. In 2004, average seed size for the twenty-three soybean varieties was 2683 seeds/lb (Pearson, 2005). In 1986, seeds/lb
averaged 2560 (Pearson et al., 1987), 2550 in 1987 (Pearson and Golus, 1988), 3059 in 1988 (Pearson et al., 1989), and 2366 in 1989 (Pearson et al., 1990).
Number of Seed Rows per Bed
Seed moisture content for the twin seed rows was slightly higher than the single seed row. The difference in seed moisture between the twin and single seed row was only 0.2 percentage points (Table 1).
Seed yield for the twin seed rows was 221 lbs/acre (3.7 bu/acre) higher than the single seed row. The represents an 8.5% increase in yield when twin seed rows were planted compared to a single seed row in a 30-inch bed.
Seed rows per bed did not affect test weight of soybean (Table 1).
Plant population of twin seed rows per bed was 25% higher than the single seed row per bed (Table 2). The reason for the higher plant population on the twin seed rows compared to the single seed row is not readily apparent, but could be due to better germination because twin rows were closer to the furrow and seed may have imbibed water more readily.
Soybeans planted in a single seed row matured one day earlier than soybean grown on twin seed rows (Table 2). Soybean plants grown in twin seed rows were 2 inches taller than soybeans grown on a single seed row. Additionally, soybean plants grown in twin seed rows set their first pod 0.6 inches higher on the plant than soybean planted on a single seed row.
Shattering was 14% higher when soybean was grown in a single seed row compared to a twin seed row (Table 2). Seed size was not affected by the number of seed rows on a 30-inch bed (Table 2).
Summary
Roundup-Ready soybean varieties provide producers with a convenient, cost-effective, and highly effective weed control management tool that results in weed-free fields and promotes soybean productivity. In general, soybean varieties with late maturity Group 2 and early maturity Group 3 produced the highest seed yields.
Colorado State University Agricultural Experiment Station Technical Report TR12-15
Page 25
Compared to a single seed row on a 30-inchbed, planting twin seed rows increased plant population, seed yield, seed moisture at harvest, matured slightly later, was taller, set the first pod higher up on the bottom of the plant, and
reduced shattering. Based on one year of field results, planting twin seed rows of soybean on a 30-inch bed would be advantageous for commercial soybean producers in western Colorado.
Acknowledgments
Thanks to Fred Judson and Greg Irwin (WCRC staff) who assisted with aspects of the field work. Also, thanks to Syngenta for supplying the seed of the soybean varieties used in the trial.
Publications
Bruns, H.A. 2011. Comparisons of single-row and twin-row soybean production in the mid-South. Agron. J. 103:702-708.
Pearson, C.H. 2005. Agronomic performance of Roundup-Ready soybean varieties at Fruita, Colorado 2004, pps. 47-52. In: Western Colorado Research Center 2004 Research Report. Colorado State University, Agricultural Experiment Station and Extension, Technical Report TR05-08. Fort Collins, Colorado.
Pearson, C.H., Miklas, P.N., and Golus, H.M. 1986. Soybean production in the Grand Valley of Colorado, 1986: variety performance test, farmer field sampling, and prospectus. Agricultural Experiment Station. Department of Agronomy. Fruita Research Center. Colorado State University Technical Report TR87-5.
Pearson, C.H. and Golus, H.M. 1987. Variety performance, inoculation, and nitrogen fertilization of soybean in western Colorado, 1987. Agricultural Experiment Station. Department of Agronomy. Fruita Research Center. Colorado State University Technical Report TR88-7.
Pearson, C.H., Golus, H.M., and Judson, F.M. 1988. Variety performance tests, row spacing, and plant population of soybeans in western Colorado, 1988. Agricultural Experiment Station. Department of Agronomy. Fruita Research Center. Colorado State University Technical Report TR89-5.
Pearson, C.H., Golus, H.M., and Judson, F.M. 1989. Variety performance tests, inoculation, and plant population of soybeans in western Colorado, 1989. Agricultural Experiment Station. Department of Agronomy. Fruita Research Center. Colorado State University Technical Report TR90-5.