Mälardalen University Press Licentiate Theses
No. 204
PROPOSING COMBINED APPROACHES TO REMOVE
ECG ARTIFACTS FROM SURFACE EMG SIGNALS
Sara Abbaspour
2015
School of Innovation, Design and Engineering
Mälardalen University Press Licentiate Theses
No. 204
PROPOSING COMBINED APPROACHES TO REMOVE
ECG ARTIFACTS FROM SURFACE EMG SIGNALS
Sara Abbaspour
2015
Copyright © Sara Abbaspour, 2015
ISBN 978-91-7485-206-6
ISSN 1651-9256
I
Abstract
Electromyography (EMG) is a tool routinely used for a variety of applications in a very large breadth of disciplines. However, this signal is inevitably contaminated by various artifacts originated from different sources. Electrical activity of heart muscles, electrocardiogram (ECG), is one of sources which affects the EMG signals due to the proximity of the collection sites to the heart and makes its analysis non-reliable. Different methods have been proposed to remove ECG artifacts from surface EMG signals; however, in spite of numerous attempts to eliminate or reduce this artifact, the problem of accurate and effective de-noising of EMG still remains a challenge. In this study common methods such as high pass filter (HPF), gating method, spike clipping, hybrid technique, template subtraction, independent component analysis (ICA), wavelet transform, wavelet-ICA, artificial neural network (ANN), and adaptive noise canceller (ANC) and adaptive neuro-fuzzy inference system (ANFIS) are used to remove ECG artifacts from surface EMG signals and their accuracy and effectiveness is investigated. HPF, gating method and spike clipping are fast; however they remove useful information from EMG signals. Hybrid technique and ANC are time consuming. Template subtraction requires predetermined QRS pattern. Using wavelet transform some artifacts remain in the original signal and part of the desired signal is removed. ICA requires multi-channel signals. Wavelet-ICA approach does not require multi-channel signals; however, it is user-dependent. ANN and ANFIS have good performance, but it is possible to improve their results by combining them with other techniques. For some applications of EMG signals such as rehabilitation, motion control and motion prediction, the quality of EMG signals is very important. Furthermore, the artifact removal methods need to be online and automatic. Hence, efficient methods such as ANN-wavelet, adaptive subtraction and automated wavelet-ICA are proposed to effectively eliminate ECG artifacts from surface EMG signals. To compare the results of the investigated methods and the proposed methods in this study, clean EMG signals from biceps and deltoid muscles and ECG artifacts from pectoralis major muscle are recorded from five healthy subjects to create 10 channels of contaminated EMG signals by adding the recorded ECG artifacts to the clean EMG signals. The artifact removal methods are also applied to the 10 channels of real contaminated EMG signals from pectoralis major muscle of the left side. Evaluation criteria such as signal to noise ratio, relative error, correlation coefficient, elapsed time and power spectrum density are used to evaluate the performance of the proposed methods. It is found that the performance of the proposed ANN-wavelet method is superior to the other methods with a signal to noise ratio, relative error and correlation coefficient of 15.53, 0.01 and 0.98 respectively.
III
Sammanfattning
Elektromyografi (EMG) är ett verktyg som rutinmässigt används för en mängd olika applikationer inom många discipliner. Dock är denna signal oundvikligen kontaminerad av artefakter som kommer från olika källor. Elektrisk aktivitet av hjärtmuskln, elektrokardiogram (EKG), är en av störkällorna som påverkar EMG-signalerna på grund av närheten till hjärtat och som försämrar analysens tillförlitlig. Olika metoder har föreslagits för att ta bort EKG artefakter från yt-EMG-signaler men trots många försök att eliminera eller minska denna artefakt, kvarstår problemet med korrekt och effektivt brusreducering av EMG. I denna studie har vanliga metoder för brusundertryckning undersökts, såsom högpassfilter (HPF), gatingmetod, spikklippning, hybridteknik, subtraktionsmetod, oberoende komponentanalys (ICA), wavelet, wavelet-ICA, artificiella neurala nätverk (ANN), och adaptiv brusreducering (ANC) och adaptiv neuro fuzzy inference system (ANFIS). Metorderna har använts för att avlägsna EKG- artefakter från yt-EMG-signaler och deras noggrannhet och effektivitet har undersökts. HPF, gatingmetod och spikklippning är snabba; men de tar även bort relevant information från EMG-signalen. Hybridteknik och ANC är tidskrävande. Subtraktionsmetoden kräver kännedom om QRS-mönstret.Wavelettransformen lämnade kvar vissa artefakter i signalen, och avlägsnade även endel av den ursprungliga EMG-signalen. ICA kräver flerkanaliga signaler. Wavelet-ICA kräver inte flerkanaliga signaler, men är däremot användarberoende. ANN och ANFIS har bra prestanda, men det är möjligt att förbättra resultaten genom att kombinera dem med andra tekniker. För vissa tillämpningar av signaler såsom rehabilitering, rörelsekontroll och prediktion, är kvaliteten på EMG-signalerna mycket viktigt. Dessutom måste de artefaktreducerande metoderna vara i realtid och automatiska. Detta innebär att metoderna ANN-wavelet, adaptiv subtraktion och automatiserad wavelet-ICA rekommenderas för effektiv eliminering av EKG-artefakter från yt-EMG-signaler. För att jämföra resultaten av de undersökta och föreslagna metoderna i denna studie, har rena EMG-signaler från biceps och delta-muskler, samt EKG-artefakter från stora bröstmuskeln spelats in från fem friska personer. För att skapa 10-kanaliga brusiga EMG-signaler har de inspelade EKG-artefakterna adderats till de rena EMG-signalerna. De olika artefaktreduceringsmetoderna har även tillämpats på 10 kanaler verkliga EMG signaler med artefakter, från stora bröstmuskeln på vänster sida. Utvärderingskriterier såsom signal-brusförhållandet, relativta felet, korrelationskoefficienten, förfluten tid och effektspektrumstäthet har använts för att utvärdera de föreslagna metoderna. Prestandan hos den föreslagna ANN-wavelet metoden befanns överlägsen de andra metoderna med ett signalbrusförhållande på 15,53, relativt fel på 0,01 och korrelationskoefficient på 0,98.
V
To my beloved husband,
Mehdi
VII
Acknowledgments
Foremost, I would like to express my sincere gratitude to my supervisors Prof. Maria Lindén, Dr. Shahina Begum and Dr. Giacomo Spampinato. I am grateful to them for providing valuable and useful suggestions, comments and feedback throughout my studies. In particular, I thank my main supervisor Prof. Maria Lindén for her continuous support of my study and research. Her guidance helped me in all the time of research and writing of this thesis. I could not have imagined having a better supervisor and mentor for my study. I also would like to express the deepest appreciation to my co-author Dr. Hamid Gholamhosseini for his constructive comments on my papers. I am grateful in every possible way and hope to keep up our collaboration in the future.
I thank the lecturers and professors who I learned a lot from during meetings, lectures, seminars and PhD courses including Mats Björkman, Magnus Otterskog, Elisabeth Uhlemann, Hans Hansson, Mia Folke, Mikael Ekström, Martin Ekström, Peter Funk, Miguel Angel Valero, Ning Xiong, Anatoliy Malyarenko, Gordana Dodig-Crnkovic, Lars Asplund, Sasikumar Punnekkat, Baran Çürüklü, Daniel Sundmark, Jan Gustafsson, Johan Åkerberg, Björn Lisper, Lucia Lo Bello, Luis Almeida, Damir Isovic, Tomas Nolte, Cristina Seceleanu, Moris Behnam and Dag Nyström. You all have been a source of inspiration for me. I thank the administrative staff in particular, Carola Ryttersson, Sofia Jäderén and Susanne Fronnå for making my things easier. My sincere thanks also go to my friends and colleagues at the department; in my research group Per, Melika, Mobyen, Anna, Elaine, Nikola, Gregory, Lum, Shaibal, Aida and Jiaying; and in an alphabetic order Abhilash, Adnan, Alessio, Andreas G., Ayhan, Batu, Carl, Eduard, Elena, Farid, Federico, Francisco, Fredrik Ek., Gabriel, Guillermo, Hamid, Hang, Husni, Irfan, Ivan, Juraj, Kan, Kivanc, Leo, Luka, Malin Ås., Mahnaz, Matthias, Mehrdad, Meng, Miguel, Mohammad, Nesredin, Nima, Omar, Pablo, Predrag, Rafia, Raluca, Saad, Sara Ab., Sara Af., Severine, Simin, Stephan, Svetlana, Wasif, Yue and others.
Last but not the least, I thank my family: my parents for giving birth to me at the first place and supporting me spiritually throughout my life. I would like to acknowledge my husband and best friend, Mehdi. A big thank must go to him for his love, support and encouragement. Without you it would not have been done!
The work was financed by the Knowledge Foundation’s research profile Embedded Sensor System for Health (ESS- H).
IX
List of Publications
Papers included in this thesis
1:
A. A Combination Method for Electrocardiogram Rejection from Surface Electromyogram. Sara Abbaspour, Ali Fallah, Open Biomedical Engineering Journal, 8:13-19, doi: 10.2174/1874120701408010013, 2014.
B. Removing ECG Artifact from Surface EMG Signal Using Adaptive Subtraction Technique. Sara Abbaspour, Ali Fallah, Journal of Biomedical Physics and Engineering, 4:33-38, 2014.
C. ECG Artifact Removal from Surface EMG Signal Using an Automated Method Based on Wavelet-ICA. Sara Abbaspour, Maria Linden, Hamid Gholamhosseini, 12th International Conference on Wearable Micro and Nano Technologies for Personalized Health, 2015.
X List of Publications
Additional publications, not included in this thesis:
1. Evaluation of Wavelet Based Methods in Removing Motion Artifact from ECG Signal. Sara Abbaspour, Hamid Gholamhosseini, Maria Linden, IFMBE Proceeding, 16th Nordic-Baltic Conference on Biomedical Engineering, 48:1-4, doi: 10.1007/978-3-319-12967-9_1, 2015.
2. A Comparison of Adaptive Filter and Artificial Neural Network Results in Removing Electrocardiogram Contamination from Surface EMG. Sara Abbaspour, Ali Fallah, Ali Maleki, IEEE Proceeding, 20th Iranian Conference on Electrical Engineering (ICEE), 1554-1557, doi: 10.1109/IranianCEE.2012.6292606, 2012. 3. A Comparison of Adaptive Neuro-fuzzy Inference System and Real-time Filtering
in Cancellation of ECG Artifact from Surface EMG. Sara Abbaspour, Ali Fallah, Ali Maleki, IEEE Proceeding, 20th Iranian Conference on Electrical Engineering (ICEE), 1558-1561, doi: 10.1109/IranianCEE.2012.6292607, 2012.
XI
List of Figures
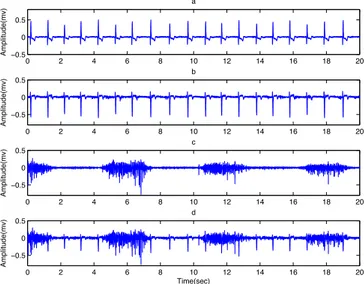
Figure 1. (a) ECG signal, (b) ECG artifact, (C) clean EMG and (d) contaminated EMG. 10
Figure 2. The model for creating the contaminated EMG signals. ... 11
Figure 3. The structure of the hybrid technique. ... 12
Figure 4. The flowchart of the wavelet-ICA method. ... 14
Figure 5. The structure of the adaptive noise canceller. ... 14
Figure 6. The structure of the ANFIS. ... 16
Figure 7. (a) Contaminated EMG, (b) denoised EMG and (c) estimated noise using HPF and (d) PSD of clean EMG and denoised EMG using HPF. ... 20
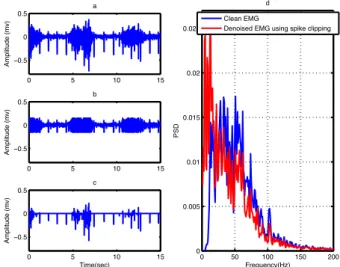
Figure 8. (a) Contaminated EMG, (b) denoised EMG and (c) estimated noise using spike clipping and (d) PSD of clean EMG and denoised EMG using spike clipping. ... 20
Figure 9. (a) Contaminated EMG, (b) denoised EMG and (c) estimated noise using gating method and (d) PSD of the clean EMG and denoised EMG using gating method. ... 21
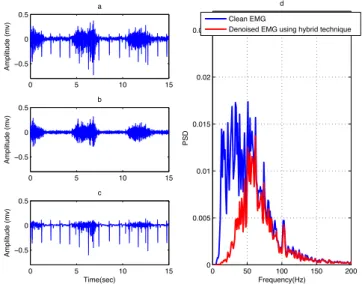
Figure 10. (a) Contaminated EMG, (b) denoised EMG and (c) estimated noise using hybrid technique and (d) PSD of the clean EMG and denoised EMG using hybrid technique. ... 22
Figure 11. 20 selected frames including the QRS complexes in the contaminated EMG signal. ... 22
Figure 12. Created ECG template by averaging QRS complexes in the contaminated EMG signal. ... 23
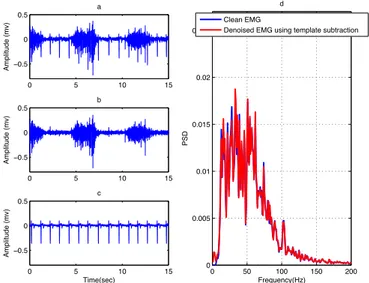
Figure 13. (a) Contaminated EMG, (b) denoised EMG and (c) estimated noise using template subtraction and (d) PSD of the clean EMG and denoised EMG using template subtraction. ... 23
Figure 14. (a, b) Contaminated EMG signals, (c, d) independent components obtained by ICA and (e, f) filtered components using HPF. ... 24
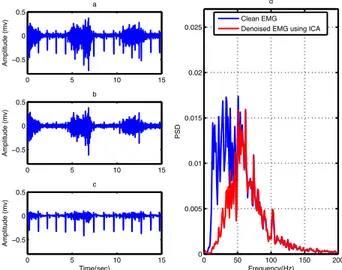
Figure 15. (a) Contaminated EMG, (b) denoised EMG and (c) estimated noise using ICA and (d) PSD of the clean EMG and denoised EMG using ICA. ... 24
Figure 16. (a) Contaminated EMG, (b) denoised EMG and (c) estimated noise using wavelet transform and (d) PSD of the clean EMG and denoised EMG using wavelet transform. ... 25
Figure 17. (a) Contaminated EMG, (b) denoised EMG and (c) estimated noise using wavelet-ICA and (d) PSD of the clean EMG and denoised EMG using wavelet-ICA. ... 26
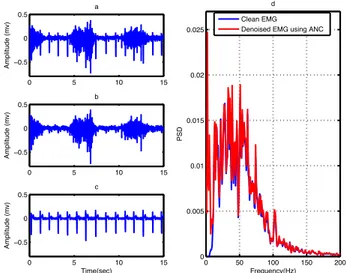
Figure 18. (a) Contaminated EMG, (b) denoised EMG and (c) estimated noise using ANC and (d) PSD of the clean EMG and denoised EMG using ANC. ... 26
Figure 19. (a) Contaminated EMG, (b) denoised EMG and (c) estimated noise using ANN and (d) PSD of the clean EMG and denoised EMG using ANN. ... 27
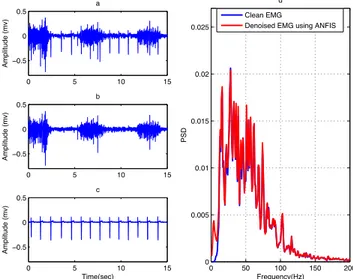
XII List of Figures Figure 20. (a) Contaminated EMG, (b) denoised EMG and (c) estimated noise using ANFIS and (d) PSD of the clean EMG and denoised EMG using ANFIS. ... 28 Figure 21. The mean of PSD of the contaminated EMG, clean EMG, denoised EMG using ANN and denoised EMG using ANN-wavelet for 10 channel signals. ... 29 Figure 22. (a) Contaminated EMG, (b) denoised EMG and (c) estimated noise using ANN-wavelet and (d) PSD of the clean EMG and denoised EMG using ANN-wavelet. 29 Figure 23. (a) Contaminated EMG, (b) denoised EMG and (c) estimated noise using adaptive subtraction and (d) PSD of the clean EMG and denoised EMG using adaptive subtraction. ... 30 Figure 24. (a) Contaminated EMG, (b) denoised EMG and (c) estimated noise using automated wavelet-ICA and (d) PSD of the clean EMG and denoised EMG using automated wavelet-ICA. ... 31 Figure 25. The performance of ANN, ANN-wavelet, template subtraction, adaptive subtraction, wavelet-ICA and automated wavelet-ICA on the contaminated EMG signals with different levels of noise (ECG artifacts). ... 34 Figure 26. (a) Contaminated EMG and (b) ECG signal with muscle movement artifact. 35 Figure 27. Denoised ECG signal using wavelet transform. ... 35 Figure 28. (a) Contaminated EMG, (b) denoised EMG and (c) estimated noise using HPF, (d) PSD of contaminated EMG and denoised EMG using HPF. ... 36 Figure 29. (a) Contaminated EMG, (b) denoised EMG and (c) estimated noise using spike clipping, (d) PSD of contaminated EMG and denoised EMG using spike clipping. ... 36 Figure 30. (a) Contaminated EMG, (b) denoised EMG and (c) estimated noise using gating method, (d) PSD of contaminated EMG and denoised EMG using gating method. ... 37 Figure 31. (a) Contaminated EMG, (b) denoised EMG and (c) estimated noise using hybrid technique, (d) PSD of contaminated EMG and denoised EMG using hybrid technique. ... 37 Figure 32. (a) Contaminated EMG, (b) denoised EMG and (c) estimated noise using template subtraction, (d) PSD of the contaminated EMG and denoised EMG using template subtraction. ... 38 Figure 33. (a) Contaminated EMG, (b) denoised EMG and (c) estimated noise using ICA, (d) PSD of the contaminated EMG and denoised EMG using ICA. ... 38 Figure 34. (a) Contaminated EMG, (b) denoised EMG and (c) estimated noise using wavelet transform, (d) PSD of contaminated EMG and denoised EMG using wavelet transform. ... 39 Figure 35. (a) Contaminated EMG, (b) denoised EMG and (c) estimated noise using wavelet-ICA, (d) PSD of contaminated EMG and denoised EMG using wavelet-ICA. .. 39 Figure 36. (a) Contaminated EMG, (b) denoised EMG and (c) estimated noise using ANC, (d) PSD of contaminated EMG and denoised EMG using ANC. ... 40 Figure 37. (a) Contaminated EMG, (b) denoised EMG and (c) estimated noise using ANN, (d) PSD of contaminated EMG and denoised EMG using ANN. ... 40 Figure 38. (a) Contaminated EMG, (b) denoised EMG and (c) estimated noise using ANFIS, (d) PSD of contaminated EMG and denoised EMG using ANFIS. ... 41
List of Figures XIII Figure 39. (a) Contaminated EMG, (b) denoised EMG and (c) estimated noise using wavelet, (d) PSD of the contaminated EMG and denoised EMG using ANN-wavelet. ... 41 Figure 40. (a) Contaminated EMG, (b) denoised EMG and (c) estimated noise using adaptive subtraction, (d) PSD of the contaminated EMG and denoised EMG using adaptive subtraction. ... 42 Figure 41. (a) Contaminated EMG, (b) denoised EMG and (c) estimated noise using automated wavelet-ICA, (d) PSD of the contaminated EMG and denoised EMG using automated wavelet-ICA. ... 42
XV
List of Tables
Table 1. The contributions made by Sara Abbaspour to papers A, B and C, 1 = Main responsibility, 2 = Contributed to a high extent. ... 6 Table 2. Calculating signal to noise ratio of HPF, spike clipping, gating method, hybrid technique, template subtraction, ICA, wavelet transform, wavelet-ICA, ANC, ANN, ANFIS, adaptive subtraction, ANN-wavelet and automated (auto) wavelet-ICA for 10 contaminated EMG signals. ... 32 Table 3. Calculating evaluation criteria (SNR, RE, CC and ET in second) for HPF, spike clipping, gating method, hybrid technique, template subtraction, ICA, wavelet transform, wavelet-ICA, ANC, ANN, ANFIS, adaptive subtraction, ANN-wavelet and automated (auto) wavelet-ICA for 10 contaminated EMG signals. ... 33 Table 4. The advantages and disadvantages of HPF, spike clipping, gating method, hybrid technique, template subtraction, ICA, wavelet transform, wavelet-ICA, ANC, ANN, ANFIS, adaptive subtraction, ANN-wavelet and automated (auto) wavelet-ICA in removing ECG artifacts from EMG signals. ... 43
XVII
List of Abbreviations
ANFIS Adaptive Neuro-Fuzzy Inference System ANC Adaptive Noise Canceller
ANN Artificial Neural Network ARV Averaged Rectified Value BPN Back Propagation Network CC Correlation Coefficient DC Direct Current ET Elapsed Time ECG Electrocardiogram EMG Electromyogram
EMD Empirical Mode Decomposition FIR Finite Impulse Response HPF High Pass Filter
ICA Independent Component Analysis PSD Power Spectrum Density RLS Recursive Least Square RE Relative Error
SNR Signal to Noise Ratio SD Standard Deviation
XIX
Table of Contents
PART 1 ... 1
Thesis ... 1
Chapter 1 ... 3 Introduction ... 3 1.1 Motivation ... 31.2 Background and Problem Description ... 4
1.3 Hypothesis ... 5 1.4 Research Questions ... 5 1.5 Approach ... 5 1.6 Scientific Contributions ... 6 1.6.1 Combined Method ... 6 1.6.2 Online Method ... 6 1.6.3 Automatic Method ... 6
1.7 Outline of the Thesis ... 7
Chapter 2 ... 9
Methodology ... 9
2.1 Signal Recording ... 9
2.2 Common Artifact Removal Methods ... 11
2.2.1 High Pass Filter ... 11
2.2.2 Spike Clipping ... 11
2.2.3 Gating Method ... 11
2.2.4 Hybrid Technique ... 12
2.2.5 Template Subtraction ... 12
2.2.6 Independent Component Analysis ... 12
2.2.7 Wavelet Transform ... 13
2.2.8 Combined Wavelet and ICA ... 13
2.2.9 Adaptive Noise Canceller ... 14
2.2.10 Artificial Neural Network ... 15
2.2.11 Adaptive Neuro-Fuzzy Inference System ... 15
2.3 Proposed Combined Artifact Removal Methods ... 16
2.3.1 ANN-Wavelet (Paper A) ... 16
2.3.2 Adaptive Subtraction (Paper B) ... 16
XX Table of Contents 2.4 Evaluation Criteria ... 17
Chapter 3 ... 19 Result and Discussion ... 19 3.1 Simulated Signals ... 19 3.1.1 High Pass Filter ... 19 3.1.2 Spike Clipping ... 19 3.1.3 Gating Method ... 21 3.1.4 Hybrid Technique ... 21 3.1.5 Template Subtraction ... 22 3.1.6 Independent Component Analysis ... 24 3.1.7 Wavelet Transform ... 25 3.1.8 Combined Wavelet and ICA ... 25 3.1.9 Adaptive Noise Canceller ... 26 3.1.10 Artificial Neural Network ... 27 3.1.11 Adaptive Neuro-Fuzzy Inference System ... 28 3.1.12 ANN-Wavelet (Paper A) ... 28 3.1.13 Adaptive Subtraction (Paper B) ... 30 3.1.14 Automated Wavelet-ICA (Paper C) ... 31 3.2 Real signals ... 34
Chapter 4 ... 47 Conclusion and Future Work ... 47 References ... 49
PART 2 ... 55
Included Papers ... 55
Chapter 5 ... 57 Paper A: A Combination Method for Electrocardiogram Rejection from Surface Electromyogram ... 57Abstract ... 59 5.1 Introduction ... 60 5.2 Materials and methods ... 61 5.2.1 Signal recording and simulation ... 61 5.2.2 Artificial neural network ... 62 5.2.3 Wavelet transform based on nonlinear thresholding ... 63 5.2.4 Artificial neural network- wavelet transform ... 64 5.2.5 Quantitative evaluation criteria ... 65 5.3 Results ... 65 5.4 Discussion ... 67 Acknowledgments ... 69 References ... 70
Table of Contents XXI Chapter 6 ... 73 Paper B: Removing ECG Artifact from Surface EMG Signal Using Adaptive Subtraction Technique ... 73
Abstract ... 75 6.1 Introduction ... 76 6.2 Material and Methods ... 76 6.3 Adaptive Subtraction Technique ... 77 6.3.1 ECG Template ... 77 6.3.2 Low Pass Filter ... 78 6.3.3 Subtraction ... 79 6.4 Evaluation Criteria ... 79 6.5 Results ... 79 6.6 Discussion ... 81 References ... 82 Chapter 7 ... 83 Paper C: ECG Artifact Removal from Surface EMG Signal Using an Automated Method Based on Wavelet-ICA ... 83
Abstract ... 85 7.1 Introduction ... 86 7.2 Material and Methods ... 86 7.2.1 Signal Recording and Simulating ... 86 7.2.2 Automated Wavelet-ICA Technique ... 87 7.3 Results ... 89 7.4 Discussion and Conclusion ... 90 Acknowledgment ... 90 References ... 91
1
PART 1
Thesis
3
Chapter 1
Introduction
The electromyogram (EMG) signal indicates electrical activity of muscles, which comprises the summation of all motor unit action potentials within the detection area of the electrode [1]. Surface EMGs are powerful non-invasive tools, which allow for diagnosis of a wide range of diseases [2]. EMG recording has been widely used in the field of neuroscience, sports medicine and rehabilitation [1]. However, when the surface EMG signal is recorded, noise is often captured from different sources such as inherent noise in the electronic components of detection and recording equipment, ambient noise, motion artifacts, inherent instability of signal and biological signals [3]. Especially, when EMG is recorded from upper trunk muscles, electrical artifacts produced by heart (electrocardiogram (ECG)) significantly affect the EMG signal and make its analysis and quantification non-reliable [4, 5]. When the biomedical signal recordings are strongly corrupted by the artifacts, it is impossible to analyze the data accurately [6]. The choice of an efficient method for removing artifacts from biomedical signals is very important in accomplishing a reliable signal processing.
In the state of the art different techniques have been proposed to remove ECG artifacts from EMG signals. However, few studies have made direct comparisons between different methods for a given data set. Difficulties in comparing between studies arise due to the different signals, electrodes and collection systems. Understanding the impacts of the ECG elimination methods on amplitude and frequency parameters is vital given the widespread use of EMG. To achieve this understanding, techniques that are employed require to be assessed for efficacy and possible detrimental outcomes to measures of EMG data. Hence, our objective of this study is to evaluate commonly used approaches and propose suitable methods to improve this process.
1.1 Motivation
The loss of a limb, especially of an arm or hand, causes a severe worsening of the quality of life. To regain the ability for an independent and unimpaired life, artificial limbs have been developed over the past decades. These initiatives include hand prostheses that can be controlled by the user through the activity of the remnant muscles above the amputation. These systems provide the possibility to control multiple degrees of freedom so that the movement can mimic well that of the human hand. The control methods for
4 Introduction prostheses use signals recorded using electromyography. The quality of the EMG signal is one of the most important factors for the performance of the prosthesis [7].
Every year more than 750,000 people experience a stroke. Approximately one quarter of these people die, and a significant portion of the remainder survive with long-term disability. Post-stroke patients may have trouble moving their arms and legs, difficulty walking, and may also experience a loss of balance. Rehabilitation can help patients to learn new ways of using and moving their weak arms and legs, and may eventually help them to regain movement [8]. There is a pressing need to increase the potential for functional recovery of the muscles after stroke. To investigate muscle changes in post-stroke rehabilitation, surface EMG signal can be used to assess the effectiveness of different rehabilitation methods in muscle treatment [9-12]. One of challenges in this area is the requirement of clean EMG signals. Therefore, extensive work is required to be performed to increase the quality and information content of the EMG signal [7].
1.2 Background and Problem Description
In recent years, removal of ECG artifacts from surface EMG signals has been given large consideration. Where the quality of EMG signal is of interest, it is important to remove the ECG artifacts from the EMG signals. However, removal of the ECG artifacts from EMG signals is very difficult because their frequency spectrums greatly overlap. The frequency range of surface EMG signals is between 0 Hz and 400 Hz depending on the amount of fatty tissue and the muscle type [13]. The frequency range of ECG signals is between 0 Hz and 200 Hz and the highest frequency power occurs at frequencies less than 45 Hz [14].
ECG artifact removal from EMG signals has been performed using techniques such as high-pass filter (HPF) [15], gating method[16], spike clipping [17], hybrid technique [18], template subtraction [19], independent component analysis (ICA) [3, 20-22], wavelet transform [1, 23, 24], wavelet-ICA [25], artificial neural network (ANN) [26, 27], adaptive noise canceller (ANC) [27-30] and adaptive neuro-fuzzy inference system (ANFIS) [31-34]. Conventional high-pass filter is a simple and fast method, but it is not suitable for some applications such as hand motion control because it removes a large amount of useful information in EMG signals [27]. The efficacy of the subtraction procedure relies on the accuracy of QRS complex detection and the stationarity of the ECG signals [27]. It also requires the selection of the predefined QRS templates [1]. Gating method perhaps is the most frequently used technique for ECG removal, which although simple, suffers from the loss of portions of the EMG signal overlying the QRS complexes [16]. Moreover, ANC has been recently used to reduce the ECG artifacts [16], but due to the heavy computational cost it is not suitable for clinical applications [1]. Wavelet transform is an online method with low computation cost that does not require multiple inputs. However, using this method some artifacts remain in the original signal and part of the desired signal is removed [35]. The ICA method is an online method which operates on multi-channel signal that adds to the complexity of hardware [36]. Among all of these methods, ANN and ANFIS methods have better performance, but the
Introduction 5 result of these methods could be improved when used in combination with other techniques for specific applications [35].
1.3 Hypothesis
The quality of surface EMG signals is very important in applications such as rehabilitation, motion control and motion prediction. Furthermore, the artifact removal methods used in these applications need to be online and automatic. The hypothesis in this research work is that it is possible to improve the result of some artifact removal methods based on their quantitative and qualitative criteria by combining them with other methods and converting them to online and automatic approaches.
1.4 Research Questions
During development and investigation process it was expected to answer a number of research questions. The following research questions are formulated based on the problem description in section 1.2.
Q1: What combination of methods could be used to improve the results based on the
quantitative and qualitative criteria?
Q2: Which artifact removal methods are suitable for online applications?
¥ How can a template subtraction method be converted to an online method?
Q3: How can a user-dependent wavelet-ICA be converted to an automatic method?
1.5 Approach
In this study 10 contaminated EMG signals were created by adding real ECG artifacts recorded from pectoralis major muscle of the left side to real clean EMG signals collected from biceps and deltoid muscles of the right side. Common methods such as HPF, gating method, spike clipping, hybrid technique, template subtraction, ICA, wavelet transform, wavelet-ICA, ANN, ANC and ANFIS methods were applied to the contaminated EMG signals to investigate the impact of these methods on the denoised EMG signals. Then, a combined method based on ANN and wavelet transform (ANN-wavelet), an adaptive subtraction method and an automated wavelet-ICA technique were proposed to remove ECG interferences from the surface EMG signals. Quantitative and qualitative criteria such as signal to noise ratio (SNR), relative error (RE), correlation coefficients (CC), and power spectrum density (PSD) were calculated to compare the results. Finally, the investigated and proposed methods in this study were applied to the real contaminated EMG signals to remove the ECG artifacts.
6 Introduction
1.6 Scientific Contributions
In this section the contributions of the thesis are presented that address the formulated research questions. The contributions are organized in three parts. The first contribution provides three different solutions for the first research question. The second contribution proposes one solution for the second research question and the third contribution proposes one solution for the third research question.
1.6.1 Combined Method
A combined method based on ANN and wavelet transform is proposed to eliminate ECG contamination from surface EMG signals recorded from upper trunk muscles. An adaptive subtraction technique in combination with low pass filter is proposed to improve the template creation process. An automated wavelet-ICA method, which uses a HPF for removing noise from noisy component, also is proposed. This contribution is presented in Paper A, B and C.
1.6.2 Online Method
To answer the second research question, the results of different methods in removing ECG artifacts from surface EMG signals on a given data set are investigated and an approach named adaptive subtraction method is proposed to convert the template subtraction to an online technique. This contribution is presented in Paper B.
1.6.3 Automatic Method
Following the previous contributions, this contribution addresses the third research question. An automatic wavelet-ICA method is proposed to convert the user-dependent wavelet-ICA to an automatic method with a better result. This contribution is presented in Paper C.
In Table 1, my contribution in paper A, paper B and paper C is presented.
Table 1. The contributions made by Sara Abbaspour to papers A, B and C, 1 = Main
responsibility, 2 = Contributed to a high extent.
Papers Paper sections A B C Idea and study formulation 1 2 1 Experimental design 2 1 1 Performance of experiments 2 1 1
Programming 1 1 1
Data analysis 1 1 1 Writing of manuscript 1 1 1
Introduction 7
1.7 Outline of the Thesis
The thesis report is divided into two parts. The first part includes four chapters; Chapter 1 presents a short introduction, motivation of the research, problem description, hypothesis, research questions, approach and scientific contributions. Chapter 2 describes the signal recording process, common methods in ECG artifact removal from surface EMG signals, proposed methods and evaluation criteria used to compare the results. Chapter 3 summarizes the results and discussions of the common methods and the proposed methods in this study on contaminated EMG signals. Chapter 4 concludes the first part of the dissertation and also presents the plans of future work. The second part presents the three included papers.
9
Chapter 2
Methodology
As it is formulated in Chapter 1, the main challenges of the proposed research include (1) evaluating the impact of commonly used approaches on the denoised EMG signal in a given data set and (2) proposing suitable techniques to improve ECG artifact removal process. To address these challenges, the following steps were performed which include describing the signal recording process, evaluating common artifact removal methods and proposing combined approaches.
2.1 Signal Recording
EMG signals recorded from regions close to the heart usually contain ECG interferences, but a clean1 EMG signal can be recorded from places where electrocardiogram
contamination is negligible. In this study, five sets of two channels clean EMG signals, each of five minutes, were collected from the biceps and deltoid muscles of the right side (Figure 1c). The main reason for selecting these muscles is hand motion prediction and hand prosthesis control applications. Five sets of two channels ECG artifacts were also recorded from the pectoralis major muscle of the left side (Figure 1b). This signal is required for creating the contaminated EMG signals. The ECG artifact is added to the clean EMG to create the contaminated EMG signal (Figure 1d). The reference electrodes were located on the wrist.
To implement some of these methods, such as ANC, ANN and ANFIS, it is necessary to record both the ECG artifact and the corresponding ECG signal. Therefore, ECG signal was recorded from V5 area (Figure 1a). When the EMG signals were recorded, subjects were seated in a chair during the experiment, and were asked to activate their biceps and deltoid muscles at two different times. A rest time was considered between each activity. When ECG and ECG artifacts were recorded, the subjects were asked to lie in a completely relaxed position. Electrode placement on the pectoralis major, deltoid and biceps muscles was selected based on the SENIAM standard [37]. In order to record the ECG and EMG signals, the PowerLab/16SP device (ML795 from ADInstrument) was used at Biological Systems Control Laboratory, Faculty of Biomedical Engineering, Amirkabir University of Technology. Five 21.4±1.94 (mean ± standard deviation (SD))
10 Methodology years old males (height= 177±3.67 cm, mass= 72.6±13.37 kg) were recruited from the university population after obtaining informed consent.
Figure 1. (a) ECG signal, (b) ECG artifact, (C) clean EMG and (d) contaminated EMG. The signals were recorded using pre-gelled Ag-AgCl bipolar electrodes (SKINTAC F-RG1 with dimensions of 32 x 41 mm) placed on the skin surface. The inter-electrode distance was 30 mm [37]. The skin was first prepared by shaving, light abrasion and cleaning with alcohol. The impedance level was kept below 10 kΩ. The EMG signal from these electrodes was fed into a biological amplifier (Dual Bio Amp/simulator, ML408 and ML135). After the pre-amplification and before sampling, the raw EMG signals were band-pass filtered from 0.3 to 500 Hz with an analogue filter to reduce the effects of high frequency noise and avoid aliasing problem. A notch filter (centered at 50 Hz) was also used to remove power line interference from EMG signals. The signals were recorded with a sampling frequency of 2000 Hz. To remove undesirable motion artifacts, the clean EMG signal was high-pass filtered with a cutoff frequency of 5 Hz (infinite impulse response, Butterworth order 5), and the direct current (DC) value was also removed from the ECG signal and the ECG artifact.
In order to obtain a quantitative evaluation of the methods, it is necessary that the corresponding clean EMG signal be available with the contaminated EMG. Therefore, in this study, the contaminated EMG signal has been created as accurately as possible. As it is presented in Figure 2, for creating the contaminated EMG signal, the ECG artifacts recorded from the pectoralis major muscle of the left side were multiplied by a factor (C=0.65) and were added to the clean EMG signals recorded from biceps and deltoid muscles of the right side. The SNR value of the contaminated EMG signals were considered zero (dB). Considering this initial SNR helps us to find out how different methods change the desired signal. This model was applied to all signals recorded from
0 2 4 6 8 10 12 14 16 18 20 −0.5 0 0.5 Amplitude(mv) a 0 2 4 6 8 10 12 14 16 18 20 −0.5 0 0.5 Amplitude(mv) b 0 2 4 6 8 10 12 14 16 18 20 −0.5 0 0.5 Amplitude(mv) c 0 2 4 6 8 10 12 14 16 18 20 −0.5 0 0.5 Amplitude(mv) d Time(sec)
Methodology 11 five healthy subjects to create 10 channels of contaminated EMG signals and finally a 60 seconds segment of signals was selected from each channel to be processed.
Figure 2. The model for creating the contaminated EMG signals.
2.2 Common Artifact Removal Methods
To investigate the effectiveness of ECG artifact removal methods, different currently used techniques such as HPF, spike clipping, gating method, hybrid technique, template subtraction, ICA, wavelet transform, wavelet-ICA, ANN, ANC and ANFIS were used to remove ECG artifacts from EMG signals.
2.2.1 High Pass Filter
A finite impulse response (FIR) high pass filter with Hamming window (length=100) and different cutoff frequencies of 10, 20, 30 and 60 Hz has been implemented to remove ECG artifacts from EMG signals [15, 25, 38]. The result with a cutoff frequency of 30 Hz is better than the other cutoff frequencies. A large amount of noise remains in the cleaned signal when using cutoff frequencies of 10 and 20 Hz, but when cutoff frequency of 50 Hz is used, a large amount of useful signal is removed [15].
2.2.2 Spike Clipping
As it is presented in equation (1) spike clipping relies on a threshold level (𝑇𝑇ℎ𝑟𝑟). If the amplitude of the recorded signal (𝑦𝑦!(𝑛𝑛)) exceeds this value, the signal is limited in
amplitude at this level. 𝑠𝑠 𝑛𝑛 is the denoised signal [17]. 𝑠𝑠 𝑛𝑛 = 𝑦𝑦𝑇𝑇ℎ𝑟𝑟 𝑦𝑦! 𝑛𝑛 𝑦𝑦!(𝑛𝑛) < 𝑇𝑇ℎ𝑟𝑟
!(𝑛𝑛) > 𝑇𝑇ℎ𝑟𝑟 (1)
2.2.3 Gating Method
Gating method is very similar to the clipping technique, as it requires a threshold to be determined. In this method if the amplitude of the recorded signal (𝑦𝑦! 𝑛𝑛 ) exceeds this
value, the signal is clamped to zero (equation (2)) [17]. The performance of this method depends on the thresholding process.
𝑠𝑠 𝑛𝑛 = 𝑦𝑦0 𝑦𝑦! 𝑛𝑛 𝑦𝑦!(𝑛𝑛) < 𝑇𝑇ℎ𝑟𝑟 !(𝑛𝑛) > 𝑇𝑇ℎ𝑟𝑟 (2) ! ! ! ! ! ! ! ! ! ! ! Clean EMG! ECG artifact! Contaminated EMG! ! ! ! Contaminated
12 Methodology
2.2.4 Hybrid Technique
Hybrid technique has been performed to remove ECG artifacts from EMG signals [18]. As it is presented in Figure 3, it combines a spike clipping algorithm and a HPF. In this approach, spike-clipping algorithm is based on an adaptive thresholding. The threshold depends on the amplitude of the previous samples and a gain determined by the user. In each iteration of the spike-clipping algorithm an averaged rectified value (ARV) of the contaminated signal is calculated in a window of N duration. Then, a threshold is set as a gain of the ARV. Since an occurred spike is greater than the threshold, it is clipped and set to the cutoff level. The EMG signal in the output of the spike clipping technique is sent to a forth order Butterworth HPF with a cutoff frequency of 30 H. The evaluation of the spike-clipping algorithm in each iteration requires a high computation time, which is one of drawbacks of this method [18].
Figure 3. The structure of the hybrid technique.
2.2.5 Template Subtraction
Subtraction method has been used to remove ECG artifacts from the EMG signals [28]. This method consists of two stages: the first stage involves creating an ECG template and the second stage involves subtracting the created template from the contaminated EMG signal. In the first stage, the accurate detection of the ECG beats from the EMG signal is performed based on the R wave detection algorithm [39-41]. After detecting the R waves, a frame of a number of samples around this peak is selected for accommodating one QRS complex in each frame. Using the mean of selected QRS complexes, the ECG template is obtained. In the second stage, a denoised EMG signal is obtained by subtracting the ECG template from the contaminated EMG, where the QRS complex has been manifested by the R peak detection algorithm [19, 25, 38].
2.2.6 Independent Component Analysis
Independent component analysis extracts statistically independent components from a set of measured signals [6]. This method finds a linear representation of non-Gaussian data. When n linear mixtures 𝑦𝑦! 𝑡𝑡 , … , 𝑦𝑦!(𝑡𝑡) of m independent components 𝑥𝑥!𝑡𝑡 , … , 𝑥𝑥!(𝑡𝑡)
are observed, ICA can be used to estimate 𝑎𝑎!", the mixing matrix, based on the
information of their independence, which allows us to separate the original source signals from their mixtures. To use ICA method, the model in equation (3) is considered: 𝑦𝑦 = 𝐴𝐴𝐴𝐴 (3) ! ! ! ! ! ! ! ! ! ! ! Clean EMG! ECG artifact! Contaminated EMG! ! ! ! Contaminated
Methodology 13 Where 𝑦𝑦 is a linear mixture, 𝑥𝑥 is independent source signal and 𝐴𝐴 is full rank mixing matrix. After finding the noisy component in ICA-based methods, the noisy component usually is set to zero [42]. This procedure removes useful information in the reconstructed signal. Therefore, it is preferred to use a HPF to remove ECG artifact from the selected component [3]. Finally, inverse ICA is applied to reconstruct denoised EMG signal. Some fundamental assumptions of ICA are; (1) the number of mixtures (𝑛𝑛) is greater than or equal to the number of independent sources (𝑚𝑚). (2) The mixtures are linear combinations of the sources and there is no delay or external noise included. (3) The sources are stationary and are not moving during the recording process [21]. ICA has three shortcomings (1) amplitude ambiguity (2) source ambiguity and (3) need for number of recordings to be equal to or more than the number of sources [21].
2.2.7 Wavelet Transform
Wavelet transform is a time-frequency representation of a signal that has been introduced to overcome the limitations in time and frequency resolution occurring with the classical Fourier transform. Instead of using a sine wave, which is the basic function for the Fourier transform, a basic waveform (𝜓𝜓) is used, which can be modified to basic functions (𝜓𝜓!,!) in equation (4), obtained from dilations and shifts of the basic waveform
[35, 43]. Where a is the scaling parameter and b represents the translation parameter [35]. 𝜑𝜑!,! 𝑡𝑡 = 𝜑𝜑! 𝑡𝑡 − 𝑏𝑏 = 𝑎𝑎!
! !𝜑𝜑(!!!
! ) (4)
Wavelet decomposes a signal into different frequency components and studies each component with a resolution matched to its scale [44]. This property can be used for denoising purposes [35]. The performance of the wavelet transform depends on the type of wavelet transform, type of the wavelet thresholding rule and the number of decomposition levels. In the denoising process the corrupted EMG signal is first decomposed by a wavelet transform to create wavelet decomposition of the raw signal representing different frequency components of the signal [1, 35]. The wavelet coefficients in the low frequency scales then underwent a nonlinear thresholding process, where the absolute value of the coefficients greater than the threshold is set to zero. The inverse wavelet transform is then implemented using the new coefficients to obtain the denoised EMG signal [1, 35].
2.2.8 Combined Wavelet and ICA
A new attitude in artifact removal process is to use single channel ICA [45]. Empirical mode decomposition (EMD) and wavelet transform are approaches that could enable ICA method to be used in single channel analysis. The combined wavelet-ICA method could successfully remove the ECG artifact [25]. However, EMD has high computational cost which is one of the drawbacks of this method [36].
14 Methodology The idea behind combined wavelet transform and ICA method is to decompose a single channel data into different components using wavelet transform before applying ICA technique. As it is presented in Figure 4, in this method a discrete wavelet transform is applied to a single channel recording to create wavelet decomposition of the raw signal. After calculating the wavelet coefficients, ICA is used to extract independent components from the multidimensional data produced by wavelet transform. After finding noisy component manually, the noisy component is set to zero [42].
Figure 4. The flowchart of the wavelet-ICA method.
2.2.9 Adaptive Noise Canceller
Adaptive noise canceller with recursive least square (RLS) algorithm was used in order to adjust the amplitude and phase of the reference signal against the artifact signal, and subtract it from the primary EMG signal [46-48]. Unlike the conventional band pass filter, which fixes filter weights, the adaptive filter has adjustable weights (𝑤𝑤!" in Figure
5), which are iteratively updated based on the characteristics of two input signals (the contaminated EMG and the reference ECG) [29]. In separating the EMG signal from the ECG artifact using an ANC, the contaminated EMG signal and ECG are primary input and reference input, respectively. The structure of the adaptive filter is presented in Figure 5. Where 𝑧𝑧!! is one sample delay, 𝑘𝑘 is time instant, 𝑦𝑦(𝑘𝑘) is the input to the ANC
(contaminated EMG), 𝑛𝑛(𝑘𝑘) is the reference input, 𝑒𝑒(𝑘𝑘) is estimated noise that can be calculated using equation (5) and 𝑠𝑠(𝑘𝑘) is denoised EMG signal obtained from equation (6).
Figure 5. The structure of the adaptive noise canceller.
! ! ! ! ! ! ! ! ! ! ! ! ! ! ! ! ! ! ! ! ! ! ! ! ! ! ! ! ! ! ! ! !
…
Single ChannelEMG signal Transform Wavelet ICA TransformWaveletInverse EMG signal Denoised
…
Single Channel
EMG signal TransformWavelet ICA EMG signalDenoised Hilbert Based method for finding the noisy component automatical ly HPF
(ANC)
ECG
EMG
ANC ECGEMG
ANC
EMG
ECG
EMG
ECG
ECG
( ) y k ( ) n k z1 z1 z1 1k w w2k wMk ˆ( ) e k ˆ( ) s kz
-1k
y(k)
EMG
n(k)
ECG
n(k)
M
w
𝑒𝑒 ̂(𝑘𝑘)
1 Adaptive Noise Cancellation 2 Stationary
Methodology 15 𝑒𝑒 𝑘𝑘 = !!!!𝑤𝑤! 𝑘𝑘 𝑛𝑛(𝑘𝑘 − 𝑖𝑖) (5)
𝑠𝑠 𝑘𝑘 = 𝑦𝑦 𝑘𝑘 − 𝑒𝑒 𝑘𝑘 (6)
2.2.10 Artificial Neural Network
An artificial neural network with back propagation network (BPN), which belongs to the category of nonlinear adaptive systems has been proposed to estimate an unknown interference present in the EMG signal [26]. BPN is a feed forward, multilayer network that uses the supervised mode of learning. It uses a gradient descent algorithm to minimize the interferences. The BPN architecture consists of input layer, hidden layer, and output layer. The number of hidden layers and neurons in each layer depends on the application of the BPN [26]. To implement the BPN the following steps are used: Specifying (1) the inputs and targets to the BPN, (2) the minimum and maximum values of the input ranges, (3) the number of layers and the number of units in each layer, (4) the activation functions for each layer, and (7) the training parameters such as learning rate, momentum, performance goal, number of epochs, etc. (5) Creating a feed forward back propagation network model by using the command called NEWFF; (6) simulating the network for plotting the network output; (8) training the network using the training function called TRAINLM; (9) giving the conditions to stop training the network (the maximum number of epochs is reached or the maximum amount of time has been exceeded, etc.) [26].
2.2.11 Adaptive Neuro-Fuzzy Inference System
Adaptive noise cancelation using a linear filter was used successfully to remove ECG interferences. However, it is clear that the idea of linear adaptive noise cancelation can be extended to nonlinear forms using nonlinear adaptive systems [26]. One of these nonlinear systems is ANFIS, which has been used to estimate noise [31]. ANFIS is a network that combines the advantages of neural network and fuzzy system [49]. The general structure of ANFIS is with two inputs, one output and five hidden layers [31]. The first layer acts as a fuzzifier, the second layer represents the fuzzy rules, the third layer is used for normalization of the membership functions, the fourth layer is used to identify effective parameters and the fifth layer computes the output of the fuzzy system (defuzzification process) [49]. In this method, the noisy signal is applied as target. An ECG signal and a delayed ECG signal are applied as inputs to the ANFIS (Figure 6). Collecting data (the ECG signal and the ECG artifact) from different sources causes delay between recorded signals [25, 29]; hence, to improve the noise estimation process, the delayed ECG signal is used as one of inputs to the ANFIS.
In Figure 6, s(k) is the clean EMG of the biceps and deltoid muscles, e(k) is the ECG artifact (recorded from pectoralis major) and n(k) is the recorded ECG of V5 area. Using this method, the ECG artifact is estimated, ê(k), and the denoised EMG signal, ŝ(k), is obtained by subtracting the estimated noise from the contaminated EMG.
16 Methodology
Figure 6. The structure of the ANFIS.
2.3 Proposed Combined Artifact Removal Methods
To improve the ECG artifact removal process ANN-wavelet, adaptive subtraction and automated wavelet-ICA have been proposed. These methods were presented in paper A, paper B and paper C respectively.
2.3.1 ANN-Wavelet (Paper A)
In this method, ANN is first employed for removing ECG artifact from the contaminated EMG signal. In this step, a large amount of pollution is removed; however, the result shows that there are still low frequency noise components in the denoised EMG signal. Wavelet transform with nonlinear thresholding is used to remove the residual noise in the output of the ANN method. Using this method, low frequency components (noise) remaining at the output of the neural network are deleted.
2.3.2 Adaptive Subtraction (Paper B)
This method contains of four steps; (1) QRS detection in the contaminated EMG signals, (2) formation of ECG template by averaging the electrocardiogram complexes, (3) using low pass filter to remove undesirable artifacts form the ECG template, (4) subtracting the template from the contaminated EMG signal where the QRS complexes are detected. The proposed technique is an online method that is somewhat effective in removing ECG artifact.
2.3.3 Automated Wavelet-ICA (Paper C)
In conventional ICA-based methods, after creating the ICA components, independent components are classified manually as EMG signal or ECG artifact. In this proposed method an automated algorithm is used to determine the ECG artifact components automatically. Each channel of independent components is evaluated separately and the component with ECG artifact is selected automatically. After finding the noisy component in ICA-based methods, the noisy component usually is set to zero. This procedure removes useful information in the reconstructed signal. Therefore, a FIR high pass filter, Hamming window, order 100 with cutoff frequency of 20 Hz is used to
ANFIS ∑ D s(k) e(k) n(k) y(k) ∑ ê(k) + ŝ(k) + +
-Methodology 17 remove ECG artifact from the selected noisy component. Finally, inverse ICA and then inverse wavelet transform are applied to reconstruct the denoised EMG signal.
2.4 Evaluation Criteria
In this study, evaluation criteria such as SNR, RE and CC were calculated to compare the performance of the investigated methods in this study. Since average of the EMG signal is zero, the SNR can be obtained by equation (7) [28]:
SNR = 10
log
10∑
s(k)
2 2(s(k)−ˆs(k))
∑
(7)where, 𝑠𝑠(𝑘𝑘) and ŝ(𝑘𝑘) are clean EMG and denoised EMG respectively. An increase in the signal to noise ratio value corresponds to better performance. Equation (8) was used to calculate the relative error [16, 29], which a lower value of the relative error corresponds to a better performance. 𝑃𝑃!(𝑓𝑓) and 𝑃𝑃!(𝑓𝑓) are the power spectral density of ŝ(𝑘𝑘) and 𝑠𝑠(𝑘𝑘).
RE =
(
P ( f )
s - ˆsP ( f )
)
2 ∑ sP ( f )
(
)
2 ∑ (8) The correlation coefficients between the clean EMG and the denoised EMG using different artifact removal methods are computed using equation (9) [27, 35]. The high correlation value of the different methods represents minimal distortion of the muscle activities after ECG cancellation.CC = ∑s(k) ˆs(k)
s(k)
(
)
∑ 2∑
(
ˆs(k))
219
Chapter 3
Result and Discussion
The investigated and the proposed methods in this study were applied to both simulated (the contaminated EMG signal that was created by adding the real ECG artifact to the real clean EMG signal) and real contaminated EMG signals to remove ECG artifacts. The results are presented in this chapter.
3.1 Simulated Signals
For comparing the results of the proposed methods and other currently used methods, quantitative criteria such as SNR, RE, CC, elapsed time (ET) and PSD were used to investigate the results. The artifact removal methods were applied to the 10 channels of contaminated EMG signals recorded from five healthy subjects. Results for these signals using MATLAB R2014a on a PC with 2.6 GHz dual-core Intel Core i5, Turbo Boost up to 3.1 GHz and 8GB 1600 MHz memory are presented in Table 2 and 3.
3.1.1 High Pass Filter
A FIR high pass filter with Hamming window (length=100) and cutoff frequency of 30 Hz was implemented to remove ECG artifact from surface EMG signal [15, 25, 38]. The contaminated EMG, denoised EMG and noise estimated using HPF and PSD of the clean EMG and the denoised EMG are shown in Figure 7. The SNR, RE, CC and ET of this method are presented in Table 2 and Table 3. HPF with cutoff frequency of 30 Hz not only deletes all useful components below this frequency (Figures 7c and 7d), but also parts of the ECG artifact still remains in the denoised EMG signal (Figure 7b). However, this method is very simple and can be used in online applications. One of the advantages of this method is that HPF does not require a separate ECG channel.
3.1.2 Spike Clipping
In this study a threshold value was set experimentally at 0.2 to remove ECG artifacts from the EMG signals using spike-clipping algorithm. If the absolute value of the amplitude in the contaminated EMG signal is greater than the threshold, it sets to the threshold value. Spike clipping is a simple and fast method; however, it suffers from the
20 Result and Discussion loss of portions of EMG signal overlying QRS complexes (Figure 8c) [16]. Furthermore, the PSD of the clean EMG and the denoised EMG signal using spike clipping in Figure 8d shows that this method removes some components of the original EMG signal in the high frequency and also low frequency noise remains in the denoised signal. The performance of the spike clipping method can be improved using an R peek detection algorithm; however, it is required to record ECG signal simultaneously with the contaminated EMG.
Figure 7. (a) Contaminated EMG, (b) denoised EMG and (c) estimated noise using HPF and (d)
PSD of clean EMG and denoised EMG using HPF.
Figure 8. (a) Contaminated EMG, (b) denoised EMG and (c) estimated noise using spike clipping
and (d) PSD of clean EMG and denoised EMG using spike clipping.
0 5 10 15 −0.5 0 0.5 Amplitude (mv) a 0 5 10 15 −0.5 0 0.5 Amplitude (mv) b 0 5 10 15 −0.5 0 0.5 Amplitude (mv) c Time(sec) 0 50 100 150 200 0 0.005 0.01 0.015 0.02 0.025 d Frequency(Hz) PSD Clean EMG Denoised EMG using HPF
0 5 10 15 −0.5 0 0.5 Amplitude (mv) a 0 5 10 15 −0.5 0 0.5 Amplitude (mv) b 0 5 10 15 −0.5 0 0.5 Amplitude (mv) c Time(sec) 0 50 100 150 200 0 0.005 0.01 0.015 0.02 0.025 d Frequency(Hz) PSD Clean EMG
Result and Discussion 21
3.1.3 Gating Method
Gating method is similar to the spike clipping technique with a difference in the thresholding process. The absolute value of the amplitude greater than the threshold is set to zero. In this method a threshold value was experimentally set to 0.15. As it is presented in Figures 9b and 9c, parts of the EMG signal that have high amplitude (because of high activity of muscles) are removed and a large part of the ECG artifact is remained in the denoised signal. The PSD of the clean EMG and the denoised EMG using gating method in Figure 9d shows that this method removes some parts of EMG component in high frequencies. It is possible to improve the performance of this method using an R peek detection algorithm at the cost of higher computation time and more complex hardware.
Figure 9. (a) Contaminated EMG, (b) denoised EMG and (c) estimated noise using gating method
and (d) PSD of the clean EMG and denoised EMG using gating method.
3.1.4 Hybrid Technique
Hybrid technique is a combination of an adaptive spike clipping and an HPF. The first step is to process the contaminated EMG signal using the adaptive spike-clipping algorithm. The second step is to filter the output of the spike clipping using a forth order Butterworth HPF with a cutoff frequency of 30 Hz. The contaminated EMG, denoised EMG, noise estimated and PSD of the clean EMG and denoised EMG using hybrid technique are presented in Figure 10. The SNR, RE, CC and ET of this method are shown in Table 2 and Table 3. Using a HPF for removing low frequency noise at the output of the spike-clipping algorithm improves the artifact removal process. However, this method removes some useful information in the EMG signal where the activated muscle has high amplitude (Figure 10c). This approach is time consuming (the adaptive spike clipping part) that is not useful in clinical applications (Table 3) [18].
0 5 10 15 −0.5 0 0.5 Amplitude (mv) a 0 5 10 15 −0.5 0 0.5 Amplitude (mv) b 0 5 10 15 −0.5 0 0.5 Amplitude (mv) c Time(sec) 0 50 100 150 200 0 0.005 0.01 0.015 0.02 0.025 d Frequency(Hz) PSD Clean EMG
22 Result and Discussion
Figure 10. (a) Contaminated EMG, (b) denoised EMG and (c) estimated noise using hybrid
technique and (d) PSD of the clean EMG and denoised EMG using hybrid technique.
3.1.5 Template Subtraction
In the first step Pan-Tompkins algorithm was used to detect R peeks in the contaminated EMG signal [39]. A window of 2500 samples duration was used to segment the contaminated EMG signal around the detected R peeks. Each frame in Figure 11 shows one QRS complex.
Figure 11. 20 selected frames including the QRS complexes in the contaminated EMG signal.
0 5 10 15 −0.5 0 0.5 Amplitude (mv) a 0 5 10 15 −0.5 0 0.5 Amplitude (mv) b 0 5 10 15 −0.5 0 0.5 Amplitude (mv) c Time(sec) 0 50 100 150 200 0 0.005 0.01 0.015 0.02 0.025 d Frequency(Hz) PSD Clean EMG
Denoised EMG using hybrid technique
0 0.5 1 −1 −0.5 0 0.5 Amplitude (mv) −10 0.5 1 −0.5 0 0.5 0 0.5 1 −1 −0.5 0 0.5 0 0.5 1 −1 −0.5 0 0.5 0 0.5 1 −1 −0.5 0 0.5 Amplitude (mv) −10 0.5 1 −0.5 0 0.5 0 0.5 1 −1 −0.5 0 0.5 0 0.5 1 −1 −0.5 0 0.5 0 0.5 1 −1 −0.5 0 0.5 Amplitude (mv) −10 0.5 1 −0.5 0 0.5 0 0.5 1 −1 −0.5 0 0.5 0 0.5 1 −1 −0.5 0 0.5 0 0.5 1 −1 −0.5 0 0.5 Amplitude (mv) −10 0.5 1 −0.5 0 0.5 0 0.5 1 −1 −0.5 0 0.5 0 0.5 1 −1 −0.5 0 0.5 0 0.5 1 −1 −0.5 0 0.5 Amplitude (mv) Time(sec) 0 0.5 1 −1 −0.5 0 0.5 Time(sec) 0 0.5 1 −1 −0.5 0 0.5 Time(sec) 0 0.5 1 −1 −0.5 0 0.5 Time(sec)
Result and Discussion 23
The mean of all frames has been performed to create an ECG template (Figure 12). Finally, the denoised EMG (Figure 13b) was obtained by subtracting the created ECG template from the contaminated EMG where the R peek has been detected. Based on the results in Figure 13 and Tables 2 and 3, this method has good performance in removing ECG from surface EMG signals. Owing to the next QRS complex of the signal is required to obtain the ECG template; this method is not usable for online applications. Furthermore, it requires additional ECG signal for accurate detection of QRS complexes.
Figure 12. Created ECG template by averaging QRS complexes in the contaminated EMG signal.
Figure 13. (a) Contaminated EMG, (b) denoised EMG and (c) estimated noise using template
subtraction and (d) PSD of the clean EMG and denoised EMG using template subtraction.
0 0.2 0.4 0.6 0.8 1 1.2 −0.5 −0.4 −0.3 −0.2 −0.1 0 0.1 Amplitude (mv) Time(sec) 0 5 10 15 −0.5 0 0.5 Amplitude (mv) a 0 5 10 15 −0.5 0 0.5 Amplitude (mv) b 0 5 10 15 −0.5 0 0.5 Amplitude (mv) c Time(sec) 0 50 100 150 200 0 0.005 0.01 0.015 0.02 0.025 d Frequency(Hz) PSD Clean EMG
24 Result and Discussion
3.1.6 Independent Component Analysis
Independent component analysis separates independent components from a number of mixed signals. FastICA algorithm was used to separate the independent components form two channels of contaminated EMG signals (Figures 14a and 14b). Then, FIR high pass filter (Hamming window, order 100) with cutoff frequency of 30 Hz was used to remove the ECG artifact from the noisy component (Figure 14c). The inverse ICA was applied to the denoised components to get the denoised EMG signals (Figure 15).
Figure 14. (a, b) Contaminated EMG signals, (c, d) independent components obtained by ICA and
(e, f) filtered components using HPF.
Figure 15. (a) Contaminated EMG, (b) denoised EMG and (c) estimated noise using ICA and (d)
PSD of the clean EMG and denoised EMG using ICA.
0 5 10 15 −1 −0.5 0 0.5 1 Amplitude (mv) a 0 5 10 15 −1 −0.5 0 0.5 1 b 0 5 10 15 −10 −5 0 5 10 Amplitude (mv) c 0 5 10 15 −10 −5 0 5 10 d 0 5 10 15 −10 −5 0 5 10 Amplitude (mv) e Time(sec) 0 5 10 15 −10 −5 0 5 10 f Time(sec) 0 5 10 15 −0.5 0 0.5 Amplitude (mv) a 0 5 10 15 −0.5 0 0.5 Amplitude (mv) b 0 5 10 15 −0.5 0 0.5 Amplitude (mv) c Time(sec) 0 50 100 150 200 0 0.005 0.01 0.015 0.02 0.025 d Frequency(Hz) PSD Clean EMG Denoised EMG using ICA
Result and Discussion 25
It can be observed from Figure 15b that using ICA small parts of noise remain in the denoised signal and parts of the desired signal is removed (Figure 15c and 15d). The requirement of additional sensor is one of the drawbacks of this method because it can add to the complexity of the hardware system [50].
3.1.7 Wavelet Transform
A discrete wavelet transform using a fourth-order Symlet wavelet has been used to decompose the contaminated EMG signal to eight levels. Choosing this wavelet was due to similarity of the wavelet function to the ECG signal that helps to remove ECG artifact successfully [51]. A threshold value was then defined to set the absolute value of the coefficients greater than the threshold to zero. This threshold was set experimentally. The inverse wavelet transform was then implemented using the new coefficients to obtain the denoised EMG signal. According to the result, it is observed that considerable amount of noise remained in the original signal (Figure 16b). In Figure 16d, in the PSD of the clean EMG and denoised EMG it can be observed that wavelet transform affects the EMG signal in high frequencies in a negative way. However, this method has an advantage in that it does not need a separate ECG channel.
Figure 16. (a) Contaminated EMG, (b) denoised EMG and (c) estimated noise using wavelet
transform and (d) PSD of the clean EMG and denoised EMG using wavelet transform.
3.1.8 Combined Wavelet and ICA
A sixth-order Daubechies wavelet was used to decompose the contaminated EMG signal (60 seconds) into six levels to produce multi-channels EMG signal for the ICA method. After decomposing the signal, the FastICA algorithm was used to separate the desired signal from the artifact. The noisy component then was detected manually by the user and was set to zero. Inverse wavelet transform was used to obtain the denoised signal (Figure
0 5 10 15 −0.5 0 0.5 Amplitude (mv) a 0 5 10 15 −0.5 0 0.5 Amplitude (mv) b 0 5 10 15 −0.5 0 0.5 Amplitude (mv) c Time(sec) 0 50 100 150 200 0 0.005 0.01 0.015 0.02 0.025 d Frequency(Hz) PSD Clean EMG
26 Result and Discussion 17b). This technique does not require multi-channel signal. It has better performance compared to the wavelet transform and the ICA technique (Table 2 and 3).
Figure 17. (a) Contaminated EMG, (b) denoised EMG and (c) estimated noise using wavelet-ICA
and (d) PSD of the clean EMG and denoised EMG using wavelet-ICA.
3.1.9 Adaptive Noise Canceller
The contaminated EMG signal is the input and the ECG signal is the reference input to the RLS algorithm. The results are presented in Figure 18.
Figure 18. (a) Contaminated EMG, (b) denoised EMG and (c) estimated noise using ANC and (d)
PSD of the clean EMG and denoised EMG using ANC.
0 5 10 15 −0.5 0 0.5 a Amplitude (mv) 0 5 10 15 −0.5 0 0.5 b Amplitude (mv) 0 5 10 15 −0.5 0 0.5 c Amplitude (mv) Time(sec) 0 50 100 150 200 0 0.005 0.01 0.015 0.02 0.025 d Frequency(Hz) PSD Clean EMG
Denoised EMG using wavelet−ICA
0 5 10 15 −0.5 0 0.5 Amplitude (mv) a 0 5 10 15 −0.5 0 0.5 Amplitude (mv) b 0 5 10 15 −0.5 0 0.5 Amplitude (mv) c Time(sec) 0 50 100 150 200 0 0.005 0.01 0.015 0.02 0.025 d Frequency(Hz) PSD Clean EMG Denoised EMG using ANC
Result and Discussion 27
The algorithm is initialized with w(0) = 0, RLS forgetting factor=0.999 and filter length=32. The results in Figure 18 and Table 2 and 3 show that ANC is somewhat effective in removing ECG from EMG signals. This method is capable of estimating the noise in the contaminated EMG signal using the reference ECG. However, the noise is not well estimated and there is still noise in the denoised signal (Figure 18b and 18d). ANC is not suitable for clinical applications due to the heavy computational burden. It takes a long time to get the denoised signal using this method (Table 3).
3.1.10 Artificial Neural Network
The parameters used to train the ANN are two neurons in the input layer, 35 neurons in the only hidden layer and one neuron in the output layer. ECG signal and delayed ECG signal (9 samples) are inputs and contaminated EMG signal is target to the network. Epochs =1000, goal = 0.65, momentum =0.9, show = 5, learning rate = 0.5 and time = infinity. The activation function for each layer was hyperbolic tangent sigmoid, which is a transfer function. In this method, 120,000 samples (60 seconds) were selected from the dataset. 90,000 samples (45 seconds) were used for training and 30,000 samples (15 seconds) were used for testing.
According to the quantitative evaluation criteria in Table 2 and 3, it can be seen that the performance of the ANN in noise extraction of the EMG signal is relatively good. Using this method, a large amount of ECG artifact in the EMG signal is removed (Figure 19); however, it can be seen in Figure 19d that low frequency noise is remained in the denoised signal. One of the drawbacks of this method is the requirement of an additional sensor to provide a reference input.
Figure 19. (a) Contaminated EMG, (b) denoised EMG and (c) estimated noise using ANN and (d)
PSD of the clean EMG and denoised EMG using ANN.
0 5 10 15 −0.5 0 0.5 Amplitude (mv) a 0 5 10 15 −0.5 0 0.5 Amplitude (mv) b 0 5 10 15 −0.5 0 0.5 Amplitude (mv) c Time(sec) 0 50 100 150 200 0 0.005 0.01 0.015 0.02 0.025 d Frequency(Hz) PSD Clean EMG Denoised EMG using ANN