TH€ LASER R S T :
CURRENT STATUS
Peter W. Arnberg
Swedish Road & Traffic Research Institute (VTI) Linkoping, Sweden
Michael W. Burke
OPQ Systems AB LinkOping, SwedenGeorg Magnusson
Swedish Road & Traffic Research Institute (VTI) Linkoping, Sweden
Roger Oberholtzer
OPQ Systems AB Linkoping, SwedenKnut
Rkhs OPQ Systems AB Linkoping, SwedenLeif Sjogren
Swedish Road & Traffic Research Institute (VTI) Linkoping, Sweden
About the Authors
Peter W. Arnberg, Ph.D., is head of the Laser RST research group. He conceived the initial idea for the Laser RST system and directed its development at the Swedish Road and Traffic Research Institute (VTI). He w a s formerly Division Manager for the Laser RST system at RST Sweden AB but has recently returned to VTI. He also was head of research for the Saab RST.Michael W. Burke, M.A., M.Sc.I.E., (Ph.D. Systems Engineering, in progress), formerly an Assistant Professor of Industrial Engineering at New Mexico State University, was a visiting researcher at both VTI (1987,1988) and RST Sweden AB (1988). In 1990 he joined OPQ Systems AB as the project leader for the video hybrid system.
Georg Magnusson, M.Sc. (Mechanical Engineering) is chief researcher and member of the Laser RST research group at VTI. His research in this area began in 1972 with studies of road comfort and roughness, conducted together with Peter W. Arnberg.
Roger Oberholtzer, M.A. (Psychology) is responsible for the supervisory software in the Laser RST and for all data analysis software. He is Computer Systems Manager at RST Sweden AB and OPQ Systems AB.
Knut Rcihs, M.Sc. (Electrical Engineering) isDirector of OPQ Systems AB, which manufac-tures electronic components and software for the Laser RST.
Leif Sjdgren, (M.Sc. Electrical Engineering, in progress) is chief researcher and member of the Laser RST research group at VTI.
Acknowledgements
This report hasbeen supported by the National Swedish Road Administration. The authors are deeply indebted to Ms. Diana Burke, w h o designed and prepared the report, and to all the other people at VTI and OPQ Systems AB w h o contributed to its preparation.The authors also wish to thank Mr. Ramon Crespodel Rio of AEPO S.A., Spain; Dr. Rudolph R. Hegmon of the Federal Highway Administration, USA; Mr. Patrick G. Jordan of the Transport and Road Research Laboratory, UK; Dr. William D.O. Paterson of The World Bank, USA; Mr. Robert B. Smith of CMPS Pty Ltd, Australia; Dr. James C. Wambold of Pennsylvania Transportation Institute, USA; and other personnel at RST Sweden AB and VTI for their valuable comments and suggestions.
Abstract
Efficient and well-maintained road systems are necessary for the economic well being of any industrialized country. Maintenance and rehabilitation of existing roads have taken priority over new construction in recent years, thus making information about the condi-tion of road surfaces extremely important. Several methods of gathering this informacondi-tion have been developed worldwide; one of them is Laser Road Surface Tester (Laser RST), which was developed in Sweden in 1981.The Laser RST is a laser-based, computer-automated, non-contact road profilometer system with the ability to collect and simultaneously process data about the road surface. Variables measured include rut depth, unevenness, cracking, megatexture, rough macro-texture, fine macromacro-texture, crossfall, curves, and elapsed distance. Subjective evaluations are also supported, if desired.
Eleven laser rangefinders (LRFs), mounted on the front of the Laser RST van, are the primary components of the data collection system. They scan the road with high-speed, high-resolution distance sampling. The signals from the lasers are sent through signal processing cards (SPCs) and then to a computer inside the van for final processing. Data is stored on floppy disk and printed by an on-board printer.
The Laser RST is an extremely complex system but it is also a modular one, making troubleshooting and repair relatively easy, inexpensive, and fast. This paper discusses the various modules available. Variables measured are defined and measurement algorithms detailed. The Laser RST system can be customized to meet specific user requirements quickly and easily.
Data from the Laser RST is used in various ways, depending on where and for w h o m the measurements are done. One example is as input data for Pavement Management Systems (PMS's). These computer programs use the data from the Laser RST about the road surface to generate a set of recommendations for the most cost-efficient road rehabilitation policy. The data format from the Laser RST can be tailored to interface with a wide variety of PMS's. RST Sweden AB has a PMS available for those customers w h o do not currently have one. The Laser RST data also interfaces well with the more traditional statistical databases. RST Sweden AB provides an extensive set of graphical tools and services for these customers as well.
In Sweden, the Laser RST measures a significant portion of the roads every year; the data from these measurements is used by the Swedish National Road Administration and its Road Data Bank, which generates graphical and statistical information about the road system.
The Laser RST is currently measuring or has measured roads in numerous other countries including Australia, Canada, Czechoslovakia, Denmark, England, Finland, France, Ger-many, Hungary, Iceland, New Zealand, Saudi Arabia, Spain, and the United States. Some of the results of these measurements are described.
Future developments for the Laser RST include storage of raw data, video pattern process-ing for crackprocess-ing classification, friction measurement, bearprocess-ing capacity, and road visibility. Also p l a n n e d are a h i g h - p e r f o r m a n c e research vehicle, r o a d - e d g e scanner, and network-node marking.
At present, the Laser RST is the only fully integrated road-surface measurement system available, collecting and directly evaluating all data on a large number of road condition variables simultaneously and at normal traffic speeds.
Table of Contents
List of Figures ix List of Tables
List of Abbreviations xii
Chapter 1: Introduction 1
1.1 Summary 1 1.2 Road Surface Testing: Purpose and Use 1
1.3 Road Surface Characteristics 2 1.4 Road Surface Testing Systems Currently in Use 4
1.5 Overview of Report 5
Chapter 2: The Laser RST Components 5
2.1 Summary 5
22 Overview of the Laser RST 5
2.3 Hardware 9 2.3.1 Laser Rangefinders (LRFs) 9 2.3.2 Accelerometers 11 2.3.3 Inclinometers 11 2.3.4 Rate Gyro 12 2.3.5 Pulse Generator 12 2.3.6 Electrical Compass 12 2.3.7 Supervisory Computer 13 2.3.8 Manual Input 13 2.3.9 System Power 14 2.4 Signal Processing Computer (SPC) Cards 15
2.5 The Driver/Operator 16 2.6 Data Input and Management 17
2.6.1 Data Storage and Analysis 17
2.6.2 Videologging 18 2.6.3 Report Variables 20 2.7 Maintenance and Calibration 22
2.7.1 Maintenance 22 2.7.2 Field Calibration 24 2.7.3 LRF Verification Control 25 2.8 Documentation 26 Chapter 3: Algorithms 27 3.1 Summary 27 3.2 Longitudinal Profile / Road Unevenness 27
3.2.1 Root Mean Square (RMS) 30 3.2.2 International Roughness Index (IRI) 30
3.3 Cross Profile and Rut Depth 35 3.3.1 Laser RST's Cross Profile Measurements Compared to
Stationary Methods 35 3.3.2 Calculation of Rut Depth 36
3.4 Texture 38 3.5 Cracking 42 3.6 Road Geometry 45 3.7 Algorithm Accuracy and Repeatability 50
Chapter 4: Measurements in Sweden 51
4.1 Summary 51 4.2 The Swedish Road Network 51
4.2.1 The Swedish National Road Administration (SNRA) 51 4.2.2 History of Road Measurement Under SNRA 56
4.2.3 Measuring Procedure 56 4.2.3.1 Planning 56 4.2.3.2 Production Measurements 56
4.2.3.3 Reliability Check 57 4.3 Swedish Road Data Bank 57
4.3.1 Reference System 59 4.3.2 Road Database 59 4.3.3 Alignment Database 60 4.3.4 Bridge Database 60 4.3.5 Pavement Database 60 4.3.6 Coordinate Database 61 4.3.7 Accident Database 61 4.4 Airfield Inspection 62 4.5 Calculation of Cut and Fill Volumes 62
4.6 Road Data Systems 64 4.6.1 Pavement Management Systems (PMS's) 64
4.6.2 Graphic Presentation System 68 4.6.3 Data Report Strategy 70
Chapter 5: The Laser RST in Other Countries 71
5.1 Summary 71 5.2 Australia 71 5.3 United States and Canada 73
5.4 England 73 5.5 Denmark 75 5.6 Spain 75 5.7 Hungary 75 5.8 Other Countries 75
Chapter 6: The Future 7 7
6.1 Summary 77 6.2 Storage of Raw Data 77
6.3 Friction Measurement 78 6.4 Road-Edge Scanner 78 6.5 Sight Distance 78
6.6 Network Node Marking
6.7 V i d e o System for Surface Distress Analysis 8 0
6.8 Research Laser RST 8 4 6.9 Bearing Capacity 8 6 6.10 Database Compatibility 8 8 Chapter 7: Epilogue 89 References Bibliography 84 \
List of Figures
2.1 The Laser RST 6 2.2 Characteristics of the Laser RST 6
2.3 The Laser RST principle 7 2.4 Overview of the Laser RST system 7
2.5 Schematic description of the Laser RST processing system 8 2.6 Measurement of macrotexture at six different speeds 9
2.7 Measurement variables 9 2.8 Laser measurement principle 10 2.9 Laser unit positions for the Laser RST (1987) from driver's viewpoint 10
2.10 Manual input to the supervisory computer 14 2.11 Road distance transmitter (pulse transducer) 16
2.12 Course for drivers 17 2.13 Layout of the videologging system V-RST 19
2.14 Two cameras used in the videologging system 19 2.15 Video equipment used in the videologging system 20
2.16 The output pictures from the V-RST 20 2.17 Printout from a survey done in Stockholm 21 2.18 Example of a printout available directly from the Laser RST 23
2.19 Calibration of the LRFs 24 2.20 Laser test stand 25 2.21 Test surface disks 26
3.1 Compensating for the influence of acceleration and deceleration 28
3.2 SPC computation of the unevenness variables 29 3.3 Comparison of longitudinal profiles as measured by the (1) Dipstick,
(2) rod and level, and (3) Laser RST 30
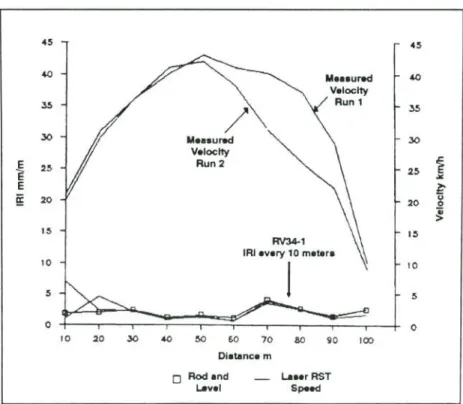
3.4 The quarter-car simulator 32 3.5 Graph showing the effects of varying the Laser RST survey speed on
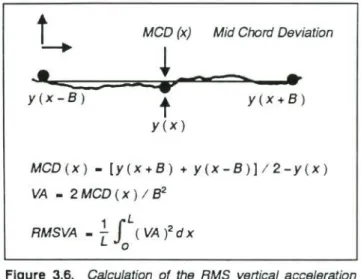
the measured IRI 32 3.6 Calculation of the RMS vertical acceleration (RMSVA) 33
3.7 Calculation of unevenness using a rolling straight edge 34
3.8 Lateral measurement validity 35 3.9 Determination of the rut depth using the wire-surface method 37
3.10 Rut depth measurements of different track widths 37 3.11 Rut depth repeatability 38
3.12 Texture ranges and their effects 39 3.13 Changes in macrotexture over time 41 3.14 Normal macrotexture distribution of a newly laid surface 41
3.15 Texture variations across the lane 42 3.16 Macrotexture reliability 42
3.17 Cracks measured in simulated conditions by the Laser RST 43 3.18 Measurement of longitudinal and transverse cracks 44
3.19 Crack reliability 45 3.20 Crossfall measurement and curve radius 46
3.21 Repeatability of crossfall measurements 47 3.22 Example of curve radius and crossfall experimental presentation 47
3.23 Grade (hilliness) measurement 48 3.24 Comparison of measurements of the relative vertical height of the road 48
3.25 Repeatability of grade measurements 49 3.26 Reliability tests for unevenness values 50
4.1 Road maintenance under the Swedish National Road Administration 52 4.2 Counties and distances measured in the Swedish road survey during
1987, 1988, and 1989 53 4.3 Counties and distance measured in the Swedish road survey during 1990 53
4.4 Roads in the northern half of Sweden measured by the Laser RST
during the spring of 1990 54 4.5 Roads in the southern half of Sweden measured by the Laser RST
during the spring of 1990 55 4.6 Measurement control 57 4.7 IRI reliability check 58 4.8 Rut depth reliability check 58 4.9 Longitudinal profile of a section of a n airport r u n w a y 62
4.10 A contour plot of airport surface macrotexture 63
4.11 Cross profile of runway surface 64 4.12 An example of a print-out of cut and fill volumes 65
4.13 The use of the Laser RST within a PMS 66 4.14 Costs related to a typical Swedish main road 67 4.15 Graphic presentation of Laser RST data 69 4.16 The use of maps to show the change over time of road conditions 69
4.17 Map showing unevenness of streets in Linkoping, Sweden 70
5.1 Correlation between NAASRA Roughness Meter and the Laser RST 72 5.2 Results of measurements taken by the Laser RST in England 74
5.3 The use of the Laser RST throughout the world 76
6.1 The principle of GPS satellite surveying and navigation 79
6.2 Absolute mode point position determination 80 6.3 Research Laser RST (RST-R) currently under development at VTI 85
6.4 Front view of the RST-R 85 6.5 Road Deflection Tester (RDT) under development at VTI 86
6.6 The experimental Road Deflection Tester (RDT) 87 6.7 The results of repeated measurements using two different axle-load combinations . . . . 87
List of Tables
2.1 Usage, sampling frequency, measuring range, and resolution of the LRFs 11
3.1 Categories of texture measurements 40
32 Macrotexture output from the Laser RST 40
List of Abbreviations
ASTM STP American Society for Testing and Materials - Special Technical Publication BPR Bureau of Public Roads (USA) CCD Charged Coupled Device CPS Cross Profile Sampler DOT/FHWA Department of Transportation's Federal Highway Administration (USA) C M General Motors (USA) GPIO General Purpose In- and Output Interface GPS Global Position SystemI/O I n p u t / O u t p u t IRI International Roughness Index
Laser RDT Laser Road Deflection Tester Laser RST Laser Road Surface Tester Laser RST-R Laser RST Research Vehicle LRF Laser Rangefinder M R M Mays Ride Meter Index NAASRA National Association of Australian State Road Authorities NCHRP National Coordinated Highway Research Program (USA) PCA Portland Cement Association P M S Pavement Management System PROM Programmable Read Only Memory PS1 Present Serviceability Index RA Receiving Averaging RFID Radio-Frequency Identification Transponder R M S Root Mean Square RMSVA Root Mean Square Vertical Acceleration RQCS Reference Quarter Car Simulation SNRA Swedish National Road Administration (Vagverket) SPC Signal Processing Computer VCR Video Cassette Recorder V-RST Video Road Surface Tester VDB Road Data Bank (Vagdatabanken) VIST Video Image Surface Tester VTI Swedish Road and Traffic Research Institute (Statens vag- och trafikinstitut)
1: Introduction
1.1 Summary
This chapter introduces the subject of road surface testing, including w h y it is needed and which road surface characteristics are normally measured. Initial efforts to evaluate the surface of the road objectively began about 70 years ago; these early and rather simple procedures have been developed into what is now a highly sophisticated and complex discipline. The Laser RST is one of the systems currently in use worldwide, all of which use more or less different methods. The chapter ends with an overview of the report.
1.2 Road Surface Testing: Purpose and Use
In today's world, economic growth cannot occur without a constructed and well-maintained system of roads, for it is this system that makes the rapid, inexpensive, and safe movement of goods and people possible. In Sweden, it is widely recognized that an efficient system of roads is vital to economic expansion; the Swedish government has therefore allocated a significant percentage of its national budget for road construction and maintenance.
The road system in Sweden consists of an extensive network with a total distance of 415,000 km. The state road network—the major highway system—represents only one-fourth (98,000 km) of the total network. Only 70 percent of this is paved (69,000 km) but carries about 95 percent of the total traffic on the state road network (Statistisk Arsbok for Sverige, 1990). Recent legislation allowing increases in axle loading combined with ever-growing traffic density have resulted in an increase in the rate of pavement deterioration.
Following a trend seen in many countries, in 1979 the Swedish Parliament passed a major road policy giving maintenance priority over construction. It was decided that counteract-ing the deterioration of existcounteract-ing roads would be more cost-efficient than expandcounteract-ing the network. Resources for maintenance have in fact exceeded those for construction during the last ten years, and it is currently estimated that up to 70 percent of future expenditures on major highways will be for pavement rehabilitation or reconstruction.
Selecting the most cost-efficient method and timing of rehabilitating a road pavement are two of the important decisions today's highway engineer has to make. An informed decision of this nature cannot be made without precise and timely information on the
condition of the road surface. Highway engineers and other road authorities are finding such information increasingly important in the evaluation of road performance and in the determination of appropriate rehabilitation methods. Road surface data has become an integral part of the decision-making process which road administrators utilize to make the most cost-effective decisions concerning pavement rehabilitation. Reliable data about the condition of the road surface is vital in these areas:
• Determination of where, when, and how maintenance efforts should be applied to the road surface
• Calculation of materials and time needed for maintenance work • Prioritized allocation of resources
• Correlation and optimization studies between accidents, road-user costs, main-tenance policies, ride comfort, and the road surface condition
• Control of methods and materials used in road construction and maintenance • Acceptance testing of newly constructed roads
• Follow-up of long-term maintenance contracts • Research in new road construction methods
Data on the condition of the road surface is divided into several categories. Each category, or road surface characteristic, has a different effect on the overall quality of the road surface, particularly from the user's point of view. A general description of these characteristics and some of their effects follows.
1.3 Road Surface Characteristics
The characteristics of the road surface may be categorized into several levels of surface irregularity. These vary depending on the size (wavelength) of the smallest dimension involved, and whether that feature extends over a relatively large area (a global feature) or only in the immediate vicinity (a local feature). Whether a feature is global or local is important in terms of its measurement. Global features, no matter how small, can normally be measured accurately through the use of statistical measurement processes applied over the global area. Local features are easily measured only if they extend over a relatively large area; small local features are more difficult to measure.
The characteristic topography of the road surface affects safety, comfort, and economic impact on the road user. Features considered to be of importance in specifying a road's topography include:
• texture
• longitudinal profile and unevenness
• cross profile, including crossfall and rut depth
• road geometry, including inclination and curve radius • cracking
The characteristic texture of a road surface is critical to comfort, safety of the road users, and the economic health of the road network. Pavement texture impacts directly on the frictional characteristics of the pavement, of great importance to the safety of the road users. Texture is also the primary determinant of the level of road noise generated by traffic, which influences the comfort of both road users and communities. In economic terms, road surface texture influences the rates of fuel consumption and vehicular deterioration.
Road unevenness is perhaps the most salient road characteristic from the user's point of view because it affects ride comfort so strongly. Comfort may also correlate with many vibration effects, e.g., the general level of road distress, the probability of damage to transported goods, the wear and tear on cars, and energy consumption. Perceived comfort depends primarily on the dynamics of the vehicle and on the road's longitudinal profile (unevenness). Most measurement systems measure this profile directly and then derive the required unevenness index from it.
Rutting is a primary consequence of vehicular abrasion and deformation of the road pavement. It depends on traffic volume, loading, speed, and type of paving material used. The degree of rutting is also influenced by the use of studded tires. In addition to reducing driver comfort, deep ruts can present a danger to the road user by interfering with vehicular control and allowing standing water, leading to hydroplaning.
As an example of how these various road characteristics affect the road user, consider hydroplaning, a dangerous condition occurring on wet roads above a certain speed. Hydroplaning occurs when a film of water separates the tire from the pavement surface. It is related to vehicular speed and weight, tire characteristics, road texture, and depth of water present on the roadway surface. While many variables are thus seen to affect hydroplaning, it is essential that water of greater than a critical depth be present on the surface if hydroplaning is to occur. Thus, the hydroplaning potential of a section of highway is determined by the possibility that critical depths of water will be present during times of rainfall or flooding.
Since hydroplaning can occur only when water is present on the roadway surface, a determination of the hydroplaning potential of roadway sections is best made by con-sideration of the roadway topography: its surface geometry, texture, and cross profile. The water depth on a road surface is a direct function of rainfall rate and an inverse function of drainage rate. Drainage can be characterized as seepage (drainage through the pave-ment) and runoff (across the surface of the pavement, both longitudinal and transverse drainage toward the shoulders). Seepage in most pavements is minimal, except for newly engineered pavement materials specifically designed for a high seepage rate. Runoff depends on the road surface texture (which affects the water flow rate), the longitudinal and lateral slopes of the surface, and surface depressions which form traps that prevent normal drainage (such as ruts).
Data on crossfall is needed to determine the overall drainage characteristics of the surface. Information on the forward or longitudinal slope is needed to determine the additional drainage which may be attributable to a favorable down slope or inversely the additional water depth which may result from an influx into the region of interest along the flow path provided by the roadway surface. Cross profile is needed to determine areas where water may be trapped and not drain properly regardless of the general slope characteristics of the surface.
Road geometry refers to the vertical and horizontal angular changes of the road surface. Too small a curve radius with respect to the design speed of the roadway (and especially in combination with a too-small or even negative crossfall) can require speed reductions and can even cause accidents. Roads with extreme longitudinal slopes are likewise un-economical and can also be dangerous.
Cracking is an early sign of a road with problems. It can indicate climactic or traffic-loading stresses that have exceeded the pavement's design limitations, or problems with the underlying road structure.
1.4 Road Surface Testing Systems Currently in Use
The need for a systematic means of acquiring and processing information about road surface conditions is recognized as a critical component of any comprehensive pavement management system or PMS (Chapter 4). Unfortunately, much of the road-condition data presently used as input into PMS's and road databanks is acquired manually. This is a slow, costly, error-prone, and labor-intensive process of subjective visual inspection or in-dividual measurement of road parameters, and 100 percent inspection is seldom feasible. In addition, the consistency of subjective ratings has been tested, with results indicating a low correlation between observers (including highly experienced highway engineers) and even among the same observer's ratings over time.
An automated road-surface measurement system is nearly always the most cost-effective and efficient method of collecting the required road-surface data. The Laser Road Surface Tester (Laser RST) is one such automated system, but it is not the only one in existence. Besides a number of instruments capable of measuring just one or two parameters and a few more complex devices used only locally, there are, in addition to the Laser RST, eight other major automated systems now in use: t w o from Japan (Pasco ROADRECON and Kokusai Kogyo ROADMAN), three from the United Kingdom (HRM and its derivatives HSV and MRM), and one each from France (GERPHO), Canada (ARAN), and the United States (KJ Law 690DNC).
1.5 Overview of Report
With this very brief introduction to road surface testing in hand, the Laser RST can now be examined. Chapter 2 begins with an overview of the system and then describes its hardware, signal processing computer cards, data management, driver/operator, main-tenance, and documentation. Chapter 3 discusses the algorithms used to analyze the data, including those for longitudinal profile and unevenness, cross profile and rut depth, texture, cracking, road geometry, and algorithm accuracy and repeatability. Chapter 4 discusses how data from the Laser RST is used in Sweden and includes a description of the Swedish governmental agencies that deal with road maintenance. Chapter 5 focuses on the use of the Laser RST in other countries, and finally, Chapter 6 looks at future plans for the Laser RST.
2: The Laser RST
Components
2.1 Summary
This chapter presents the Laser RST's method of measuring road surface characteristics in general terms and explains what function each of the system's components has in the collection and processing of data. The components are grouped into several categories: (1) hardware, beginning with the laser rangefinders (LRFs); (2) the signal processing computer cards, responsible for processing information from the LRFs; (3) the driver/operator, an extremely important part of the system; and (4) data input and management. Also described are Laser RST maintenance procedures and currently available system documen-tation.
2.2 Overview of the Laser RST
The first Laser RST w a s developed in 1981 by the Arnberg team at the Swedish Road and Traffic Research Institute (VTI*), and the team has continued with considerable research and development since then (see bibliography). In Sweden, part of the main road network is measured every year, some main roads (such as E4) are measured several times each year, and all surfaced roads are measured at least once every three years. Each year, u p to 65,000 km are measured by RST Sweden AB with the Laser RST system.
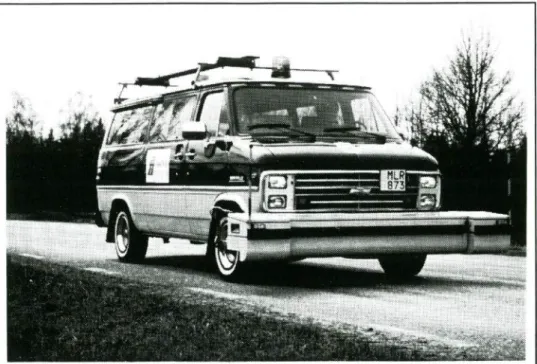
The Laser RST (Figure 2.1) can be defined as a laser-based, computer-automated, non-con-tact road profilometer system with the ability to collect and simultaneously process a wide variety of data about the road surface. Road surface data is collected, analyzed, and stored in real-time at traffic speeds of u p to 90 k m / h . For some variables (e.g., longitudinal and cross profiles, and crossfall), measuring speed can exceed 90 k m / h .
Initially the Laser RST was used only in Sweden but now measures roads in many other countries in Europe, North America, Australia, and the Middle East (Chapter 5). The Laser
Figure 2.1. The Laser RST, an integrated system which uses the same laser rangefinders for all measurement purposes.
RST has become an internationally recognized tool in the cost-effective maintenance and management of roadways. The primary advantages of the Laser RST (Figure 2.2) are that it:
• contains a fully integrated data collection, analysis, and storage system;
• is a completely controlled system with well-established testing procedures on all levels and careful calibrations of all variables;
• is easy to use, requiring minimal operator training;
• measures the surface of the road with an extremely high degree of accuracy (suitable for calibrating other equipment);
• has excellent re-test reliability; • evaluates field data in real-time;
• is flexible and easy to reconfigure for a multitude of data collection tasks, PMS formats, maps, graphs, etc.; and
• is safe in traffic because of its speed independence and width of only 2.5 meters.
The Laser RST is unique w h e n compared to other road measurement systems because of its data collection and processing system. The basis of this system is the laser rangefinder (LRF); 11 of these units, m o u n t e d on a support beam in front of the vehicle, collect data by accurately and rapidly measuring the distance from the beam to the surface of the road (Figure 2.3).
• Rut Depth ^ Cracks ^ C r o s s f a l l IH Roughness • Hilliness/ E^Curve radius E l Texture G r a d e
Figure 2.3. The Laser RST principle.
Vertical motion of the vehicle is removed from these measurements through the use of an accelerometer which measures the beam's vertical acceleration. Wavelengths from as small as 2 m m to as large as 100 m are measured by the LRFs and are the basis of the data collection. Longitudinal distancing information is provided by a pulse transducer mounted on one of the front wheel hubs. Figure 2.4 shows an overview of the measurement system while Figure 2.5 is a schematic description of the processing system.
SPC 1 Cracks SPC 2 Cracks Accelerometer 2 Accelerometer 1 Lasers 0-10 | = £ > RA Cards SPC 3 Macro SPC 4 Macro SPC 5 Roughness SPC 7 Roughness SPC 6 Rut Depth Wheel Pulse Transducer Distance/ Speed N
=>
2E
SPC I/O Card GPIO Supervisory Computer Manual Input DevicesFigure 2.5. Schematic description of the Laser RST processing system.
The Laser RST's fully automated data-analysis system means that accurate, objective, and reliable measurements can be obtained rapidly, safely, and at very low cost. The Laser RST also includes these features:
• Data is displayed continuously inside the vehicle d u r i n g the measurement process, making it possible for the on-board technician to correct any problems should they occur, t h u s avoiding unnecessary delays in measuring.
• Data is analyzed as it is collected, eliminating the costly and time-consuming process of analysis after measurements have been taken; this also minimizes operator error.
• The Laser RST is safe in and non-disruptive to surrounding traffic because the vehicle can allow for normal speed variations in traffic without affecting measure-ment accuracy. For example, Figure 2.6 illustrates the negligible effect of speed on macrotexture measurements. Data from the LRFs are fully compensated for the vertical and forward motions of the vehicle from speeds of 8 to 90 k m / h .
• All road-surface variables are measured simultaneously, in a single pass over the surface, at u p to 90 k m / h . The variables measured by the Laser RST are (Figure 2.7):
» longitudinal profile and unevenness (multiple wavelengths and several calculated indices, SPC 5 and 7)
» cross profile including crossfall (SPC 6)
» rut depth (maximum and for each wheel track individually, SPC 6) » megatexture (SPC 3 and 4)
» rough and fine macrotexture (SPC 3 and 4) » cracking (SPC 1 and 2)
» road geometry (horizontal and vertical curve radius, etc.) » elapsed distance
Data is also collected on variables related directly to serviceability and safety, such as evenness (International Roughness Index using the quarter-car method) and hydroplaning (rut depth in conjunction with crossfall, grade, and macrotexture). In addition, subjective evaluations of the road surface can be recorded when necessary.
Speed Independence (Rough Macrotexture Camera 4)
km/h
Test at VT11989
Figure 2.6. Measurement of macrotexture at six different speeds.
Crossfall
Figure 2.7. Measurement variables.
2.3 Hardware
| ^ H Laser Rangefingers (LRFs)
The LRFs (manufactured by Selcom AB, Sweden) are the most important transducers of the data collection system in the Laser RST. They scan the road with speed, high-resolution sampling (Figure 2.8).
The LRFs emit an invisible beam of infrared energy in a very concentrated ray yielding the small spot-size necessary for precise measurement (0.5 mm in diameter at 30 percent of maximum power). Before the signal is digitized and linearized, proprietary circuits pre-process it to adapt it to different lighting and reflection levels. The output from an LRF is a high-speed serial signal that describes a longitudinal sample line of the road.
Fig u re 2.8. Laser measurement principle. The laser light spot on the road surface is reflected onto a light-sensitive displacement sensor. Electrical signals representing the vertical position of the laser spot are recorded and computer processed.
The LRFs are mounted on a bumper-bar/crossbeam in front of the vehicle; the LRFs and the crossbeam are collectively referred to as the cross profile sampler (CPS). Figure 2.9 illustrates the usage and positioning of the LRFs in the CPS and the n u m b e r i n g scheme used. The LRFs are numbered from 0 (the unit on the left side from the driver's viewpoint) to 10.
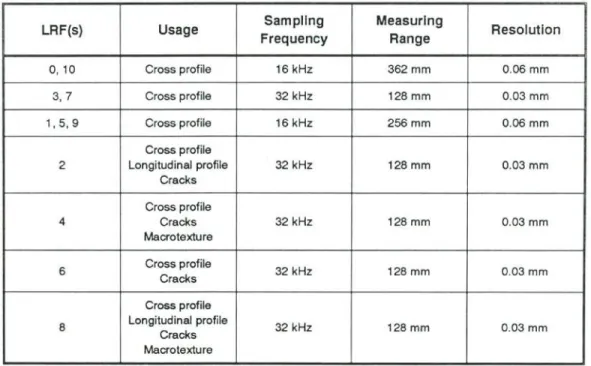
The two outer LRFs (0 and 10) are angled outward, mounted at an angle relative to the straight vertical m o u n t of all the other LRFs. This outward orientation allows these two LRFs to scan the road surface at spots located outside the ends of the CPS. Table 2.1 lists information about usage, sampling frequency, measuring range, and resolution of the LRFs.
Laser Rangefingers (LRFs)
0 1 2 3 4 5 6 7 8 9 10
Angled standard lasers: 0, 10 Standard lasers: 1, 5, 9 High-frequency lasers: 2, 3, 4, 6, 7, 8
Figure 2.9. Laser unit positions for the Laser RST (1987) from the driver's viewpoint. Some Laser RST's use more LRFs, e.g., the Saudi Arabian Laser RST, which uses 13.
A standard configuration of 11 LRFs has been utilized almost exclusively in the Laser RST, but it is relatively easy to modify this configuration to meet specific user needs. Some examples of modifications are:
• When measuring concrete pavements, in which the primary form of cracking is corner cracking near the slab edges, LRFs 1 and 9 (normally 16 kHz) are upgraded to 32 kHz to meet the higher resolution requirements of crack detection beyond the ends of the crossbar.
• To change the lateral position on the road where macrotexture or cracks are measured, LRFs 3 and 7 are used. Macrotexture can still be measured along t w o points of the road surface, but any two of LRFs 2,3,4,6, 7, and 8 m a y then be used. • More LRFs can be added, and all except the angled LRFs can be 32 kHz. If necessary, the angled LRFs can also be u p g r a d e d to 32 kHz, b u t this requires a d d i n g Signal Processing C o m p u t e r (SPC) cards (described below) and the measuring range will be reduced.
Table 2.1. Usage, sampling frequency, measuring range, and resolution of the LRFs.
LRF(s) Usage Sampling Frequency Measuring Range Resolution 0, 10 Cross profile 16 kHz 362 mm 0.06 mm 3, 7 Cross profile 32 kHz 128 mm 0.03 mm 1, 5, 9 Cross profile 16 kHz 256 mm 0.06 mm 2 Cross profile Longitudinal profile Cracks 32 kHz 128 mm 0.03 mm 4 Cross profile Cracks Macrotexture 32 kHz 128 mm 0.03 mm 6 Cross profile Cracks 32 kHz 128 mm 0.03 mm 8 Cross profile Longitudinal profile Cracks Macrotexture 32 kHz 128 mm 0.03 mm \
T^&M Accelerometers
Two high-precision servo accelerometers (manufactured by Sundstrand Data Control Inc., USA) are mounted above LRFs 2 and 8 and are used to determine the vertical acceleration of these LRFs. This information is needed for the longitudinal road profile, which is computed for both wheel tracks. The frequency range of the accelerometers is 0-150 Hz, and the acceleration range in this application is set to ±2 g. The linearity is <0.05% of full range or 0.005 g, whichever is greater. The temperature drift is less than ±0.00005 g / ° C , and the units are completely sealed against humidity. The analog output signal is sampled at a rate of 16 kHz.
£££1 Inclinometers
The inclination of the CPS relative to the horizon ismeasured by an inclinometer (manufac-tured by Schaevitz Engineering, USA). The crossfall of the road surface is calculated from the lateral inclination of the CPS and the position of the cross profile in relation to the CPS. The measurement range is ±14.5° and the frequency range is 0-27 Hz. The linearity is 0.1 % of full range, the temperature sensitivity is 0.005% /°C, and the meter is again fully enclosed within a sealed housing. The analog output signal is sampled at a rate of about 4 kHz.
When the vehicle is negotiating a curve in the road, the inclinometer is influenced by the lateral acceleration of the vehicle. The o u t p u t of the inclinometer is then n o longer the true inclination of the CPS with respect to the local gravity vector b u t is instead the resultant of the lateral acceleration vector and the acceleration of gravity. To correct for this error, the lateral acceleration of the measurement vehicle must b e known. The lateral acceleration is calculated from the measurement of the vehicle yaw velocity and longitudinal velocity, which is then used to correct the inclinometer output.
A second inclinometer is mounted on the vehicle b o d y and is used for measuring extremely long wavelengths of the road profile, sometimes referred to as "hilliness." The hilliness is reported as the slope in milliradians (mrad) of consecutive 20-m sections of the road. Because readings from the inclinometer are also affected by the acceleration of the vehicle, corrections must be made. The acceleration is for this p u r p o s e calculated from the rate of change of the pulse transducer frequency (see below).
WJ&JZM Rate Gyro
Yaw velocity of the measurement vehicle is measured by a rate gyro (manufactured by Saab Aerotech, Sweden). The measurement range is ±30°/s and the frequency range is 0-25 Hz. The linearity is 0.5% in the range of 0 - 7 . 5 ° / s and ±2% at higher angular velocities. The temperature sensitivity is ±1% of full range within a temperature range - 3 5 to +55°C.
Yaw velocity information is used to calculate the lateral acceleration of the vehicle to compensate for the influence of lateral acceleration on the inclinometer signal. Lateral acceleration is the product of vehicular road speed and yaw velocity.
£££1 Pulse Generator
A pulse generator, m o u n t e d on the h u b of the vehicle's right front wheel, emits 2500 pulses per wheel revolution, which works out to approximately 0.9 m m of horizontal travel per pulse. Accuracy, defined as the maximum deviation from the nominal distance between two arbitrary pulse edges, is 0.02°, which corresponds to a length error of 125 (j.m. However, when calculating distance traveled, only every seventh pulse is observed, giving about one pulse per degree of wheel revolution or about 6 mm /pulse. Distance traveled is calculated by the number of pulses from the pulse generator, and speed is calculated by the pulse rate.
It should also perhaps be noted that the accuracy of this measurement is to some extent influenced by tire radius which is affected by inflation pressure, tire temperature, and vertical acceleration of the vehicle.
Electrical Compass
An electrical compass (manufactured by Siemens, Germany) provides information used to draw m a p s on which measurement data are presented. It consists of two perpendicular coils on a low-retentivity magnetic material and is connected to an evaluation module. The inductance of the coils d e p e n d s on their orientation in relation to the direction of the magnetic field of the earth. The purpose of the evaluation module is to provide each coil
with the precise amount of current needed to keep the inductance constant. The current values to the two coils are thus a measure of the direction of the coils in relation to an earth-fixed coordinate system.
££24 Supervisory Computer
All previous Laser RST's used a Hewlett-Packard 68000-based integral computer, but newer generations of the Laser RST will use an 80386-based UNIX computer. The super-visory c o m p u t e r ' s primary function is to control multiple intelligent peripheral data processing units.
The supervisory computer monitors the distancing function from the hub-mounted pulse transducer via the I / O card to keep track of where the vehicle is currently collecting data and to determine w h e n to sequence the next set of tasks by the peripheral signal processors. It stores processed data on 31/2-in microfloppy disks (720 kbytes of storage on each disk), and formats and prints data reports for each section of road using its built-in inkjet printer.
Like the Laser RST's hardware, the software is also modular and is designed for ease of customization. The software for the supervisory computer is stored on microfloppy disks, making it easy to change if a different sequence of operations is needed or a new report format is desired. A standard I / O card interfaces all SPC cards with the supervisory computer via a high-speed GPIO parallel port.
Another extremely important function of the supervisory computer is the information it displays on screen during data collection; this makes it possible for the operator to determine that everything is functioning normally by seeing reasonable values of the parameters. There are four types of information displayed:
• N o d e system information (Chapter 4), indicating location • Values of the variables being measured
• Status of the subjective evaluation devices (see below)
• Size of data files currently being collected and amount of data storage space remaining on a given disk
A complete run-time control system, currently being implemented, will automatically monitor the condition of the entire system, check the integrity of the data being collected, and give the operator a warning if something looks unusual.
Finally, the supervisory computer provides the interface to the operator. The measurement system in the Laser RST is controlled via commands given by the operator. Any information that the system requires is prompted for by the supervisory computer. This allows for a structured environment that has been highly successful in decreasing operator error.
(223 Manual Input
In addition to the data coming from the SPC cards, other data can be fed directly into the supervisory computer by the system operator (Figure 2.10). Some of the data is objective (e.g., type of pavement, weather), some is subjective (e.g., types of cracks), and some data may record incidental occurrences (e.g., very large crack in one section of the road). The
data is entered into the supervisory computer via its keyboard and t w o special-purpose manual-input devices; the current status of all manual inputs is reflected on the computer screen.
Manual Registration
Mistakes in Road Data Bank
Manual Supervision
Examples: Poor drainage, cracks in road edges
Figure 2.10. Manual input to the supervisory computer.
The keyboard has three toggle-button function keys that switch their state each time they are pressed. The keys are activated the first time they are pressed, then deactivated the second time they are pressed.
The first special-purpose manual-input device is a five-button hand-held unit with four momentary contact buttons and one toggle-button. Buttons 1 to 4 are active only w h e n held down. Button 5 is a toggle-button similar to those on the supervisory c o m p u t e r ' s keyboard; a green light gives its current status (the light is on when the button is in the active state). The second device is an eight-switch hand-held unit that provides relatively static categorical information to the computer. This unit has eight toggle switches, each with three positions.
Exceptions to normal or expected conditions can also be noted and are stored with the data. Examples would be dirt or water on the road surface, or actual distances or surfaces that are different from those registered in the Road Data Bank.
I System Power
The system is normally powered by a 1-kW alternator mounted on the engine, but for those situations requiring higher auxiliary power inside the van (e.g., a video system or an extra air conditioner), the system can be powered by a remote-controlled 4-kW generator mounted in the back of the vehicle.
2.4 Signal Processing Computer (SPC) Cards
The values coming from the LRFs are processed in various w a y s before reaching their ultimate destination, the on-board supervisory computer. Most of the processing occurs in the Signal Processing Computer (SPC) cards.
In the standard configuration, there are seven SPC cards (numbered 1-6 and 8; SPC 7 is a special card used for corner cracking) and a special processing card for distance and speed calculations. All SPC cards have the same general h a r d w a r e configuration with the exception of the rut depth SPC card, which processes parallel data from all 11 LRFs. This standardization of the signal processing modules makes maintenance easy and allows for flexibility of function (i.e., simpler customization of the hardware). Specific functions are determined by on-board firmware (programmable read-only m e m o r y or PROMs) that are p r o g r a m m e d to accomplish desired tasks. Although not as flexible as the higher-level processing functions, the SPC card PROMs can be re-programmed relatively easily to accommodate desired modifications in low-level processing.
The software on each SPC card is different, making it possible for cracks, texture, and roughness to be calculated from the same signal, for example. In addition, each SPC card can also act on multiple signal sources. Two examples of this are (1) an SPC card used in detecting cracks receives signals from two LRFs in order to detect transverse cracks, and (2) an unevenness SPC card processes signals from an LRF and an accelerometer. Figure 2.5 shows an additional SPC and accelerometer, which give the Laser RST the capability to measure unevenness in both wheelpaths.
SPC cards 1 and 2, with input from four LRFs (two channels per card), are used for crack detection, while macro- and megatexture measurements are processed by SPC cards 3 and 4 with inputs from t w o LRFs (one channel per card). SPC cards 5 and 8 are used for unevenness. Each uses the input from one LRF together with input from an accelerometer to determine the IRI (quarter-car method), the RMS of various wavelength b a n d s of the longitudinal profile, and the Mays Ride Meter Index.
Rut depth is calculated somewhat differently. Before rut depth measurements are deter-mined by the rut depth SPC card (6), mean values over a specific length of time are calculated by processing modules called Receiving Averaging (RA) cards. This low-pass filtering or averaging prevents cracks, holes, loose stones, etc., from influencing the values that are to used to determine rut depth. Three RA cards are used for all 11 LRFs (maximum of four channels per card), and the value from each unit can be read in parallel format on high-speed data buss by the rut depth SPC card.
The distance pulse transducer (Figure 2.11) feeds pulses proportional to the rate of distance travelled into a special processing card (the distance/speed card) which then derives the total distance travelled and the speed. This device generates interrupts for the supervisory computer at a preset interval length. The supervisory computer can thus determine when it is time to gather information from the SPC cards (this is adjustable but is typically done every 20 meters). The wheel pulse transducer also supplies each SPC card with pulses. The cards need this information about the distance travelled in order to perform various signal processing tasks.
Figure 2.11. Road distance transmitter (pulse transducer).
2.5 The Driver/Operator
An extremely important part of the Laser RST system is the driver/operator. The Laser RST can be driven and operated by only one person, but when the node signalling system (Chapter 4) is used, an additional person is required to listen to the proper n o d e signal and to verify the location; the rest of the data collection is fully automated. This second crew member also operates the supervisory computer. Most of the time, a two-man crew is used, but a third person, a representative of the local road authority w h o is familiar with the road network to be measured, is often added to the crew. Those applications requiring a large amount of subjective data input m a y also need to add a third crew member solely for this function (currently the norm in the United States).
A special training course has been developed to instruct the driver in these areas: • the role of the RST driver, including responsibilities and limitations
• development of the necessary driving skill, involving training in maneuvering on test tracks and video recording the lateral position of the measurement vehicle (from a follower car) to facilitate learning how to drive with respect to ruts (Figure 2.12) • how to drive the Laser RST to obtain an optimal survey
• how to calibrate the LRFs
• how to perform routine maintenance of the measurement system and vehicle • how to determine if a system component is not functioning properly
• where and how to find experts when information on special service questions or problems is needed
Currently, drivers perform a static LRF calibration (using a calibration bar) and infrequent-ly need to verify the dynamic response of the LRFs (using a dynamic calibrator). In the
future, devices for simulating different controls for and data from the processing devices and transducers will be used for active servicing. These will also be a part of the hardware complement of the Laser RST vehicle, supported by the software in the supervisory computer. The driver m a y then use this equipment to diagnose problems in the field and to insure proper equipment functioning. Since the system is highly modular, field repair is also possible, using the spare modules carried in each van.
Figure 2.12. Course for drivers.
2.6 Data Input and Management
WJTWM Data Storage and Analysis
As mentioned previously, all processed data are stored on 31^-in microfloppy disks, each with a storage capacity of 720 Kbytes. The data are saved as ASCII text, without labels, and with spaces as delimiters. This allows one to present the results easily to different customers in their own formats.
After measurements are completed and while the crew is still in the field, software utilities can be run to check for data integrity. Various utility programs are available that allow one to determine if all data is physically present on the disk and if the data seems reasonable. Specifically, these programs:
• check that all mean and object reports are in the data files; • perform correlations between various runs and variables;
• generate line charts of various runs or variables that track changes over time and allow one to see if all values look reasonable; and
• allow information about a single variable in an entire data file to be viewed all at once.
The verified data is already in the form of data statistics, suitable for use in a PMS or statistical database. The format of the data on the disks can be customized to meet most data processing system requirements. The modular nature of the software has proven itself in interfacing to a wide variety of PMS's and databases in many other countries.
For example, in Sweden all processing is done under contract to RST Sweden AB, a company partially owned by the Swedish National Road Administration. The copied disks
from the v a n s are taken to the central RST office for final processing on the main RST computer, and the integrity of the data is checked once again. The results are analyzed together with other traffic data, and a w e e k after measurement, they are sent to the customer, the Swedish Road Administration, for inclusion in the Road Data Bank (Chapter 4).
Because all software is on floppy disk, the presentation of the measured variables can be adapted easily for different purposes including the customer's needs. This is done simply by inserting a different program disk into the supervisory computer. The exact use to which the Laser RST will be put, then, d e p e n d s on the software, which can be changed easily.
It should also be noted that data transfer between various systems is relatively straightfor-w a r d through the use of human-readable ASCII data format. Protocol transfer via serial ports has been implemented successfully. The KERMIT transfer protocol (a public-domain program found on m a n y different machines) is used to control the transfer. It is also possible to convert the HP-IPC 3V2-in UNIX format disks to IBM PC 31/2-in 720-Kbyte MSDOS format disks. The supervisory computer handles this conversion directly.
EE3 Videologging
Videologging and photologging of roadways are oft-mentioned capabilities of integrated measurement devices. The Japanese PASCO and the French GERPHO systems use primari-ly photologging, the videologging PCES system in the U.S. incorporates an image process-ing capability, and the Canadian ARAN system uses videologgprocess-ing.
Pictures are often a very good complement to measured objective data. When videologging is done, an image database of the road and road surface is created. This visual information can then be used to evaluate the quality of road markings, to aid in the placement of road signs where visibility will be optimal, to inspect road surroundings, to detect distresses in the road surface, and to assist in the interpretation of Laser RST data at a time removed from the actual measurement. These different uses of videologging require different image qualities, but all require a good identification system. The video cameras need to be waterproof, built for industrial use, capable of adjusting to low light, and remote control-led. They must also have a high-speed shutter of up to 1 /10,000's, high resolution, and a DC power supply.
The most difficult task is to collect images for surface distress analysis. The camera must be mounted close to the surface for the proper resolution, and this limits the covered area. One solution is to use two or more cameras; another is to repeat the videologging. (See Chapter 6 for more information on surface distress analysis.)
A real-time videologging system has been developed for the Laser RST and is called the Video RST (V-RST); its basic layout is depicted in Figure 2.13. Figure 2.14 shows two cameras used in the system, and Figure 2.15 shows the video equipment inside the Laser RST. The camera for videologging road surroundings is mounted on the roof of the van. The system records the road surface, road, and road environment together with text information such as identification, distance and results from the Laser RST. The pictures are stored in S-VHS format, and each picture consists of four equally sized windows (Figure 2.16). The first window contains text information (e.g, date, time, road number, lane, cross sections, direction, distance) and real-time information from the Laser RST (e.g., rut depth and unevenness). The second w i n d o w shows the road and its surroundings, and the third
and fourth w i n d o w s show parts of the lane surface. In order to record the road surface in w i n d o w s 3 and 4 at high travelling speed, special CCD cameras with high-speed shutters (1/10,000's) are used (Sjogren, 1990).
Road front view Right part of lane Left part of lane : - x r n Laser RST system Text Video Multi-vision box Video Mixer S-VHS video recorder 3 4 1 V- 2 Monitor
Figure 2.13. Layout of the videologging system, V-RST.
Figure 2.14. Two cameras used in the videologging system, mounted on the back of the Laser RST.
Figure 2.15. The video equipment (inside the Laser RST van) used in the videologging system.
Figure 2.16. The output picture (the four windows) from the V-RST.
(221 Report Variables
It is possible to configure the measurement control program in the supervisory computer to meet the needs of specific custom ers. An example printout of a 20-meter section is shown in Figure 2.17.
The software measurement configuration programs allow one to specify exactly how the measurements should be carried out. The system needs to be configured only once; changes m a d e in the configuration remain in effect until they are changed again. Each parameter that is measured has an associated editor that allows the user to configure the
Ml
** Mean Report: e4rut mean
** Measured: Mar. 26, 1991 13:24:19
From Node Point 0854A119.03 Road 0004 Object #1 To Node Point 0854A119.04 Lane 1
Distance past start point 60 m Size of section measured 20 m Amount actually measured 20 m Average speed 81 km/h IRI 1.03 mm/m RMS (0.5 - 1 . 0 m) 0.14 mm RMS (1.0-3.0 m) 0.19 mm RMS (3.0 - 10.0 m) 0.26 mm RMS (10.0-30.0 m) 4.84 mm IRI 1.19 mm/m RMS (0.5 - 1.0 m) 0.18 mm RMS (1.0-3.0 m) 0.23 mm RMS (3.0 -10.0 m) 0.42 mm RMS (10.0-30.0 m) 3.91 mm Hilliness -2.60 Milliradians Crossfall 1.23 % Curve Radius INFINITY Bearing (direction) X = 0.00 Y = 0.00 Left rut depth 13.1 mm Right rut depth 8.0 mm Maximum rut depth 13.3 mm % Max. Rut Depths > 5.0 mm 100 % % Max. Rut Depths > 10.0 mm 87 % % Max. Rut Depths > 20.0 mm 0 % CRACKS 0 % ALLIGATOR 0 % (NOT USED) 0 % (NOT USED) 0 % (NOT USED) 0 % DEBRIS ON ROAD OFF ROAD WORK OFF WET_ROAD OFF Megatexture RMS 0.22 mm Rough Macrotexture RMS 0.37 mm Fine Macrotexture RMS 0.16 mm Bleeding (1st Fine Hist) 55 Megatexture RMS 0.18 mm Rough Macrotexture RMS 0.29 mm Fine Macrotexture RMS 0.12 mm Bleeding (1st Fine Hist) 100 Crack total 7 % 1.0 m samples with > 1 0 25 % 1.0 m samples with > 2 0 0 Crack total 13 % 1.0 m samples with > 1 20 10 % 1.0 m samples with > 2 10 0 \
Figure 2.17. Printout from a survey done in the Linkoping area. Measurements are stored every 20 m on computer disks. The variables measured were cross profile, rut depth, unevenness (IRI and MO), cracks (4 LRFs), and macrotexture (2 LRFs).
parameter to meet the customer's needs. The following measurement variables can be configured by the user:
• unevenness • rut depth • cross profile • cracking • texture • subjective inputs • road geometry
It is also possible to configure other components of the Laser RST such as: • the printer
• which hardware is present in the system • LRFs
• measurement control
In addition to the measurement configurations discussed earlier, it is also possible to select the desired report sizes and the contents of these reports. Figure 2.18 is an illustration of a description of an entire object (e.g., a road section with a homogeneous asphalt surface).
The measurement program allows one to organize data based on specific object n u m b e r s or road-grid node points. If object numbers are used, the numbering can begin at any specified n u m b e r and can either increment or decrement as each object report is generated. If a node system is used, then street names or any other identification label can be attached to reports. If the size of sections to be measured is known, then the program can be instructed to warn the operator that the end of a section is approaching, useful for double checking the execution of the data-collection itinerary. This simple node system is quite flexible and is being used successfully in Spain and Australia. It has to be pre-programmed.
A fully automated node identification system is also available and has been implemented in Denmark, Finland, and England, in addition to the original system in use in Sweden. To s h o w h o w s u c h a s y s t e m w o r k s , a d i s c u s s i o n of t h e S w e d i s h N a t i o n a l Road Administrations' Road Data Bank and node planning network has been included in Chapter 4. This node system allows the use of a central database of road section locations, lengths, types, etc., to specify exactly what needs to be measured. All pre-planning is done with the Road Data Bank, which outputs a detailed data acquisition plan in the form of a microfloppy disk. This disk is read directly by the supervisory computer, which then determines the section distances, measurement parameters, etc., and properly prompts the operator.
2.7 Maintenance and Calibration
WWXW Maintenance
The Laser RST system is an extremely complex measurement system, yet all attempts have been made to make it as reliable as possible. However, if a malfunction does occur, the highly modular nature of the Laser RST system makes it easy to troubleshoot and repair. The capability to simply "swap-out" modules reduces maintenance costs considerably and minimizes system downtime as well.
An analysis of the spare parts needed to maintain the Laser RST has been done, and the spare parts have been divided into two categories: those that should be carried in the Laser RST and those that should be kept in a central location. Because there is some variation in the complexity of the Laser RST components, some can be serviced by a trained RST operator in the field, while some require the help of a maintenance expert.
Example of a printout from the Laser RST
** Object Report: route66.obj Measured: Nov. 16, 1989 11:32:30
From Node Point Maple Street Road Route 66 Object #1 To Node Point Main Street Lane 1
Distance past start point 0 Size of section measured 2158 Amount actually measured 2157
Average speed 49 IRI (Right side of lane) 1.28 RMS (0.5 - 1.0 m) 0.23 RMS (1.0 - 3 . 0 m) 0.33 RMS (3.0-13.0 m) 1.01 RMS (13.0-40.0 m) 4.23 IRI (left side of lane) 1.19 RMS (0.5 - 1.0 m) 0.22 RMS (1.0-3.0 m) 0.29 RMS (3.0-13.0 m) 0.95 RMS (13.0-40.0 m) 4.70 Rut Depth on left of lane 1.4 Rut Depth on right of lane 1.1 Rut Depth across whole lane 2.1 % Rut Depths > 4.0 mm 5 % Rut Depths > 6.0 mm 1 % Flut Depths > 15.0 mm 0 CRACKS 20 ALLIGATOR 10 (N0T_USED) 0 (NOT_USED) 0 (NOT_USED) 0 D E B R I S O N S U R F A C E ON ROAD_WORK OFF WET SURFACE OFF
Mean Profile Dev. Profile 0.0 0.3 0.0 0.0 0.9 0.9 0.7 0.3 0.8 0.9 1.5 1.4 1.0 1.0 1.1 1.2 1.2 1.2 Mean RMS 0.0 0.1 0.1 0.2 0.2 0.4 0 4 0.6 0.6 0.9 0.9 1.3 1.3 2.0 2.0 Mega 0.23 Ftough 0.40 0 18 28 42 10 0 0 0 Fine 0.19 7 68 17 6 0 0 0 0 Mega 0.23 Flough 0 42 0 11 30 49 7 0 0 0 Fine 0 18 4 72 20 2 0 0 0 0 Crack Width (mm) Crack Depth
2.5 6.0 12.0 18.0 Common Density Density 6.0 12.0 18.0 24.0 100 1/1.0 2/1.0 (%) 2 . 0 - 5 . 0 > 5.0 823 97 11 9 10 2 218 A 19 B: 22 2.0 - 5.0 > 5.0 939 99 17 2 14 7 4 1 230 C: 21 D: 20 14 15
Figure 2.18. Example of a printout from the Laser RST.
Measurement section identifica-tion. This feature requires pre-planning of the measurement. Location of this data within the measurement section. The amount measured as well as the size of the report area are given. The frequency with which reports can be generated is ad-justable. A report can also be in-itiated directly by the operator.
Evenness data. An IRI and various RMS values are given for each wheel track. The RMS
wavelengths are adjustable. Rut depth data. The three per-centage values help indicate how many extreme rut depths were present.
Subjective evaluation. The in-formation given is the percent
of the section for which this con-dition occurred.
Measurement qualifiers. These items allow the operator to note measurement anomalies. The mean and standard devia-. tion of the transformed
transverse profile.
Graphic plot of the mean trans-formed transverse profile (inter-polated).
Texture. The RMS for each wavelength is calculated every meter (or 0.5 meter). The mean RMS and a histogram showing the percentages of RMS values in eight classes are given. The top arrow points to the values from the left side of the lane
and the bottom to the values from the right side.
Crack indication. A table of the number of cracks within user-specified widths and depths is given. The top half of the table describes the left of the lane, and the bottom describes the right side. The "common" values a re the number of cracks the cameras on that side of the lane sensed within 100 mil-limeters of each other. The "den-sity" values tell the percentage of 1-meter sections that had more than 1 or 2 cracks. "A:" refers to laser 2, "B:" to laser 4,
"C:" to laser 6, and "D:" to laser 8.
A special-purpose tester has been developed that can simulate all Laser RST measure-ments. This computer, together with special I / O cards, simulates the processing devices that send values to the supervisory computer. With this system, the software and hardware of the supervisory computer can be tested. If controlled signals are p u t into the system at different levels, it is easy to identify specific problems.
H a r d w a r e and software that simulate the LRFs have also been developed, m a k i n g it possible to check the processing devices.
The Laser RST system is easy to calibrate. Since all the on-board equipment is solid-state and designed for minimum drift with temperature variations, the measurements are stable and require practically no w a r m - u p time. There are two types of LRF calibration proce-dures—static and dynamic.
For static calibration of the LRFs, a calibration bar, carried on the vehicle's roof, is h u n g from fixtures on the CPS. This provides a stable, level, and known distance from the LRFs on the CPS to the bar (Figure 2.19). The use of a calibration bar provides much tighter calibration of the LRFs than using the underlying pavement, as is done with m a n y of the other profilometer vehicles. A pavement-based calibration procedure necessitates driving around until a suitable level pavement surface is found. Using the CPS-hung calibration bar means that calibration can take place anywhere in the field.
Figure 2.19. Calibration of the LRFs.
Once the calibration bar is in place, the operator runs a program that automatically calibrates the LRFs with little operator intervention. The calibration procedure involves two different positions of the bar. Thus, not only the accuracy but also the sensitivity is checked. The calibration bar is then removed and stored in its carrier. The complete static LRF calibration task takes approximately 20 minutes and is normally done everyday before measurement begins.
A dynamic LRF test is recommended once every t w o weeks during measurement sessions. In this procedure, the LRFs are tested individually for dynamic performance on a moving surface. The surface is a hand-held, rotating, textured test disk similar to the laboratory device discussed below. This device verifies each LRF's performance using a dynamic surface with known characteristics moving at a k n o w n speed. Both the static calibration bar and the dynamic test device are supplied with each Laser RST vehicle.
The only other type of calibration procedure required by the Laser RST is to verify the accuracy of the wheel-mounted distance transducer. The computer counts the n u m b e r of pulses as the operator drives over a known distance. This distance value is entered into the supervisory computer, which calibrates the distance transducer count.
The LRFs are extremely important to the road-surface measurement process, and they must perform in a well-defined and consistent manner. Measurements are taken at high speeds and require a high degree of accuracy, precision, and reliability. Traditional methods to check LRFs are static and do not provide enough information. A dynamic test environment has been developed at VTI in which the LRFs perform in conditions close to those actually encountered on the road.
When actual road measurements are taken, the LRFs move in a simple linear fashion. However, an apparatus in which the LRF moves in a simple linear motion while the measuring surface remains stationary would be difficult to build and control. Because of the small target spot size of the laser beam, a large-diameter disk rotating at a constant angular velocity gives a good approximation of simple linear motion. The LRF testing unit (Figure 220) uses such a scheme, employing a turntable with controlled rotational speed. Various test disks are mounted on the turntable. The LRF is attached to the testing apparatus, and both the horizontal and vertical locations of the LRF are precisely control-led. The effective tangential velocity of the laser spot relative to the disk surface will vary with the distance of the spot from the center of rotation of the disk. For a constant rotational speed, the farther out the laser spot toward the disk's rim, the higher the effective linear velocity.
The normal test of an LRF requires that a well-known road sample be measured and the RMS value of the macrotexture profile calculated. This is repeated with different distances between the test object and LRF, yielding a calibration chart. The x-axis on the chart is the