GROUND FACILITIES
Analysis of a Concrete Column’s Capacity to
Withstand Extraordinary Fire Loads
STRUCTURES IN
UNDERGROUND
FACILITIES
Analysis of a Concrete Column’s Capacity to
Withstand Extraordinary Fire Loads
teoretiska frågeställningar, genomförda experiment, rapportering från samverkans- eller samproduktionsprojekt eller från externa uppdrag.
Skriftserien omfattar forskningsrap-porter, arbetsrapporter och student-rapporter. Forskningsrapporter är på en högre vetenskaplig nivå och ska därför granskas av behörig forskningsledare eller professor. Arbetsrapporter kan t.ex. utgöras av beskrivningar av delförsök och utredningar som kan ligga till grund för kommande paper eller forskningsrapporter. Studentrapporter kan t.ex. utgöras av examensarbeten med extern uppdragsgivare. Arbets- och studentrapporter ska seminarie-behandlas före publicering.
Manuskript lämnas till redaktören, som ombesörjer slutlig granskning och redigering inför publicering. Varje författare är dock själv ytterst ansvarig för skriftens veten-skapliga kvalitet.
experiments, reports from cooperation or coproduction projects or from external assignments.
The publication series includes research, work and student reports. Research reports are at a higher scientific level and should therefore be examined by a research director or professor within the research field of the study. Work reports may e.g. consist of descriptions of pilot studies or studies as a basis for future papers or research reports. Student reports may e.g. consist of master theses for external principals. Work and student reports should undergo a seminar prior to publication.
Report scripts are to be submitted to the editor for a final review and editing before publication. The author, though, is solely responsible for the scientific quality of the report.
S
TUDIES IN
S
USTAINABLE
T
ECHNOLOGY
Student report: 2012:9
Title: Structures in Underground Facilities
Subtitle: Analysis of a Concrete Column’s Capacity to Withstand Extraordinary Fire Loads
Authors: Anna Andersson & Eva-Sara Carlson
Keywords: Tunnel, Fire, Underground, Metro, Subway, Eurocodes, Train, Fire Load, Concrete, Steel
Language: English
Illustrations: Anna Andersson ISBN: 978-91-7485-103-8
Copy Editor: Mikael Gustafsson, mikael.gustafsson@mdh.se Publisher: Mälardalen University
Print: Mälardalen University Mälardalens högskola
Akademin för hållbar samhälls- och teknikutveckling
Box 883 721 23 Västerås www.mdh.se
Mälardalen University
School of Sustainable Development of Society and Technology
P.O. Box 883 SE-721 23 Västerås Sweden
www.mdh.se © Copyright Mälardalen University and the authors, 2012.
Contents
LIST OF FIGURES ... 5
LIST OF TABLES ... 6
DEFINITIONS AND TERMS ... 7
PREFACE ... 9 ACKNOWLEDGEMENTS ... 10 ABSTRACT ... 11 1 INTRODUCTION ... 13 1.1 Background ... 14 1.2 Problem formulation ... 14 1.3 Aim ... 15 1.4 Purpose ... 15
1.5 Limitations and uncertainties ... 15
2 METHODOLOGY ... 17
3 LITERATURE REVIEW ... 18
3.1 Fires in general ... 18
3.2 Fire in underground facilities ... 21
3.3 Examples of fire accidents in underground facilities ... 23
3.4 Examples of fire tests made in underground facilities ... 25
3.4.1 EUREKA 499, 1990–1992 ... 25 3.4.2 METRO 2009–2012 ... 26 3.5 Concrete structures ... 26 3.6 Regulations ... 27 3.6.1 Boverkets konstruktionsregler (BKR) ... 27 3.6.2 Eurocode ... 27 4 ANALYSIS OF A CARRYING COLUMN EXPOSED TO FIRE AT AN UNDERGROUND SUBWAY
4.1 Comparison between the EUREKA and METRO test ... 29
4.2 Setup of the scenario ... 29
4.3 Calculations ... 31
4.3.1 Analytic calculation of thermal conduction ... 31
4.3.2 Numerical calculation of thermal conduction ... 37
4.3.3 Compilation of the thermal conduction calculations ... 40
4.3.4 Conversion from one-dimensional to two-dimensional values ... 40
4.3.5 FEM-analysis ... 41
4.3.6 Control of column ... 42
4.3.7 Conversion factor ... 42
4.3.8 Designing a new column ... 43
4.4 Results of the study ... 43
5 DISCUSSION AND CONCLUSIONS ... 45
6 PROPOSALS FOR FUTURE WORK ... 47
REFERENCES ... 49
APPENDICES ... 51
Appendix A: Load calculation – a verification of the assumed load... 53
Appendix B: View Factors ... 57
Appendix C: Numerical calculation of thermal conduction ... 58
Appendix D: Conversion factor – a factor to convert a load to Eurocode ... 59
List of figures
Figure 1: 2 zones model for a compartment fire ... 18
Figure 2: Fire growth curve corresponding to a compartment fire ... 19
Figure 3: A solid material breaking up into pyrolysis gases ... 20
Figure 4: Effect and time curve ... 21
Figure 5: A tunnel fire with re-radiation ... 22
Figure 6: A tunnel fire where the smoke cools down by the surroundings and falls down to floor level ... 23
Figure 7: Hötorget’s subway station ... 30
Figure 8: The setup of the scenario ... 31
Figure 9: The original METRO fire growth curve ... 33
Figure 10:Modified METRO fire growth curve ... 33
Figure 11:Fire growth curve for analytical calculation of thermal conduction ... 34
Figure 12:Illustration of the prerequisites when calculating the heat radiation ... 35
Figure 13:Thermal conduction with direct impact, h included ... 37
Figure 14:Thermal conduction with direct impact, h included ... 37
Figure 15:Numerical calculations of thermal conduction in principle ... 38
Figure 16:Fire growth curve for numerical calculations of thermal conduction ... 39
Figure 17:Temperature in the column at distance x at time t ... 40
List of tables
Table 1: Examples of fire accidents in underground facilities and tunnels ... 24
Table 2: Data used in the calculations ... 32
Table 3: Data used in the calculations ... 34
Table 4: Heat radiation ... 36
Table 5: Calculated Heat Transfer Coefficient ... 37
Table 6: Thermal conduction ... 40
Definitions and Terms
tPreface
This report is a product of our thesis at Mälardalens University for a master’s degree in Master Civil Engineering and Urban Development.
The work was performed within the research project METRO, which is a project in fire protection in underground mass transport systems. The work in METRO is divided into different work packages (WPs), and this work is included in WP 5 – Extraordinary Strain on Constructions.
Västerås in December 2012.
Acknowledgements
Our thanks go to…
…Mia Kumm, for taking us up as your personal challenge! You have encouraged us in difficulties, found opportunities when we have only seen problems, guided us on the right track when we got lost and made sure that we finally finished this master thesis.
…Joakim Sandström, for the continuous support with our calculations and for taking time to run the FEM-analysis – twice!
…Jörgen Thor, for guidance in the numerical calculations.
…Anders Lönnermark, for the input data you helped us dig out and for genuine commitment to the problems we encountered.
…Klas Gidlöv, for the nights you stayed up and struggled with encoding our computer programs for calculating thermal conductivity within structures. If it were not for you we would still sit on the floor in your workshop and interpolate erfc “x”-values. Thank you!
…Jens Lind, for taking such good care of us at our site visit at Stockholm Underground. …Jenny Söderström, for taking time and joining us to solve our mathematical problems we came across along the way.
…Gero Meyer, for spending hours reading through and correcting the mistakes we made in the first version of this report. Without you it would not have been as good!
Abstract
More and more road and rail tunnels are in construction as the cities are growing. Tunnels need a special treatment in fire protection since the risks and consequences are far greater than with fires above ground. In a tunnel fire the fire gases cool down and fill up the entire tunnel cross section, which complicates the evacuation and rescue operations.
Within this work the following problem formulation was set:
How much impact has the fire effect and the temperature from a burning train on the carrying structures in a subway system? How does a concrete column at a subway platform located near the tracks stand against the fire load from a burning train burning with a similar effect and the same temperature as in the test carried out within the METRO project?
In order to limit the scope of this study the calculations were made for only one column at Hötorget’s subway station. The fire scenario that has been used is a scenario corresponding to the METRO fire, test 3.
The methods used within this work are a literature review and a case study, where the former formed the basis of the latter.
The METRO project included four full scale tests. In the third test, a carriage of the train type X1 was rebuilt to simulate a train type C20. Luggage was placed inside of the carriage and a minor amount of burnable liquid was used for ignition.
One method to evaluate the load bearing capacity of the column after the impact of a fire is to calculate the area of the column’s cross section that reached a temperature of 500 °C or more, that area is considered to be unusable. The remaining part of the cross section is considered to have full carrying capacity. To determine where the 500 °C border was, the thermal conduction of the column was calculated. This was done analytically, numerically and by making a FEM-analysis. The FEM-analysis gave the most reliable result. When comparing the analytic method and the numerical method with the FEM-analysis it was shown that the numerical calculations gave better result than the analytical calculations.
The idea was to verify a column, comparable to the existing one built according to BABS, and a column built according to BKR. The control contains an analysis of the columns capacity after being exposed to a fire corresponding to the METRO fire. The FEM-analysis showed that the fire only had a negligible effect on the column, so no control was necessary.
A new column was designed according to Eurocodes with the same conditions as for the existing column. The column was calculated in the ultimate stage since the FEM-analysis showed that the fire had a negligible impact on the column. When calculating, it appeared that the concrete quality class had to be increased to match the exposure class. The new column, designed according to Eurocode, got a cross section of 600 x 600 mm.
1
Introduction
This work is a part of METRO, a Swedish research project about infrastructure protection. The focus of the project lays on the protection of underground rail mass transport systems, e.g. tunnels and subway stations, and fire as well as explosion hazards are studied.
METRO is a multidisciplinary project where researchers from different disciplines cooperate with practitioners with the common goal to make underground rail mass transport systems safer in the future. The following nine partners participate in METRO: Mälardalen University, SP Technical Research Institute of Sweden, Lund University, Swedish Defence Research Agency (FOI), Gävle University, Swedish National Defence College, Swedish Fortifications Agency, Greater Stockholm Fire Brigade and Stockholm Public Transport (SL). The total budget of METRO is 14.2 million SEK (ca 1.5 million Euro) and the project runs over a period of three years (December 2009 to December 2012). METRO is funded by the following fire organisations: Stockholm Public Transport (SL), Swedish Civil Contingencies Agency (MSB), the Swedish Transport Administration (Transportverket), the Swedish Fortifications Agency (Fortifikationsverket) and the Swedish Fire Research Board (Brandforsk).
More information about METRO can be found at the project website, www.metroproject.se.
The work in METRO is divided into seven work packages (WPs): WP1 – Design Fire
WP2 – Evacuation
WP3 – Integrated Fire Control WP4 – Smoke Control
WP5 – Extraordinary Strain on Constructions WP6 – Fire and Rescue Operations
WP7 – Project Management
This master thesis is included in WP5. The terrorist attacks on mass transport systems in Madrid, London and Moscow highlighted a new type of threat. During a rescue operation after a deliberate attack in an underground facility, it is imperative that the rescue personnel understand the effect of an explosion on the construction and train. They must be able to interpret signs of a possible cave in or structural collapse. In the WP, previously performed experiments in military facilities will be used to gain knowledge which can be used in civilian
facilities. Additional experiments and simulations will be performed and a tool which aids the decision making for rescue personnel will be developed.
The following four partners participate in WP5: Swedish Defence Research Agency (WP leader), Mälardalen University, Swedish Fortifications Agency and Swedish National Defence College.
1.1
Background
Today it is common that certain traffic is located underground so an efficient flow of traffic can be designed independently of the existing activities above ground. The public transport systems in many major cities are planned after this principle. The subway systems are an efficient way to transport a large amount of people on a limited time (Frantzich, 2000) and since shorter distances can be drawn in transport systems located underground, the travel times can be reduced compare to public transport systems located above ground. Also, by locating transport systems underground valuable land is released and the noise from traffic is reduced (Bengtson & Wahlström, 1997).
Even outside of the cities it can sometimes be easier to locate the traffic below ground compared to letting it go above. If the traffic, for example, have to pass through an area with a lot of mountains, it may be easier to make a tunnel through instead and avoid difficult terrain passages above ground (Frantzich, 2000).
From a safety perspective it is problematic to design transport systems that include tunnel traffic. The consequences of a fire inside a tunnel are likely to be much worse compared to a corresponding fire above ground. Fire fighting and the rescue work are more difficult to deal with for the emergency services, as well as it is more difficult for people to evacuate and put themselves in safety. The limited ability to clear a tunnel from heat and smoke leads to a large impact of the fire and the smoke during the evacuation progress. It is therefore important that tunnels are designed to limit the risk of fire, and if a fire occurs after all the design must make it possible for people to evacuate safely (Frantzich, 2000).
There are many factors to take in consideration when designing rail tunnels or subway systems, but one of the most basic things is to make sure that the tunnels and underground stations are strong enough to resist the loads of the fire long enough for people to evacuate and for the fire brigade to make rescue operations and get safely back out again.
1.2
Problem formulation
In the autumn of 2011 a full-scale test was carried out within the research project METRO (see section 3.4.2 METRO 2009–2012, page 26) which included two fire tests and one explosion test. In these tests it appeared that the effect of a burning train is much higher than what previously was known. This means that the carrying structures of tunnels and subway systems are likely designed with too little fire impact. In order to assess whether the existing carrying structures in our underground facilities are safe, they have to be controlled against the higher fire load.
Stockholm Public Transport (SL) has instructed its drivers to run the train to the next station ahead or out in the open in case of a fire in a subway train. A burning train is not supposed to stop in a tunnel. This method is to prevent a complicated evacuation through
the tunnel (Frantzich, 2000). When using this method it is especially important to control the carrying structures at the platforms in subway stations.
The problem formulation of this work is presented below.
How much impact has the fire effect and the temperature from a burning train on the carrying structures in a subway system? How does a concrete column at a subway platform located near the tracks stand against the fire load from a burning train burning with a similar effect and the same temperature as in the test carried out within the METRO project?
1.3
Aim
The overall objective for METRO WP5 is to produce research results that can be used to ensure safer operations in underground facilities in case of a deliberate attack in mass transport systems. The objective for WP5 is also to estimate the effects of a blast wave from explosions in constructions and complex geometries and to produce relevant information that can be used for contingency planning by first responders, tunnel operations and owners of underground facilities.
The objective with the work presented in this report is to determine if a concrete column placed close to the tracks at a subway station can withstand the effect and temperature of a fire in a burning train comparable to the effects and temperatures that showed at the full scale test carried out within the METRO project.
1.4
Purpose
The purpose of this work is to determine if a carrying column placed near the tracks in a subway station can withstand the strain a burning train standing at the station will cause, even though the full scale tests carried out within the research project METRO showed that a train is burning with a higher effect then the columns are designed for. Since the subway is a central transport system used in bigger cities all over the world, it is important to ensure that the constructions are safe even during intensive fires.
1.5
Limitations and uncertainties
In order to limit the scope of this study the calculations have only been made for columns. Other carrying structures, such as beams and joists, have not been controlled.
In the METRO-test only one train carriage was burned and not a whole train, and since the fire that occurred during the test is the fire that is used as the reference fire in this work the risk of fire spread from one carriage to another has been excluded. In the calculations made within this test it is not a whole train burning, just one train carriage.
Alternative locations of the burning train will not be looked at, nor alternative placement of the column.
In the calculation progress the reality has been simplified to make it easier to calculate. These simplifications are presented continuously during the presentation of the calculations.
The cover and quantum of the reinforcement in the chosen column is not verified on-site or through any design documents or drawings. These values have been estimated based on existing standards from when the column was built.
2
Methodology
The different methods that were used in this work are survey and case study. Within the survey, a literature review was made. The information gathered in the literature review was used in the case study. The aim of the case study was to analyse the problem formulation by performing calculations on a set up scenario.
The first step was to set up the basics for the work, such as the problem formulation, determining the aim of the work, writing the purpose and settling the limitations.
The second step was a site visit at Hötorget’s subway station, where relevant facts about the station were collected. Most interesting was the information about the columns. How are they placed? What dimension and length do they have? What loads are they carrying?
After the site visit a literature review was made, which also has been complemented during the work since more relevant literature was found while working with the case study.
The literature review was followed by a case study. All data that was needed for following calculations in the case study was compiled by adding the temperature and time data from the METRO test 3 to the data that was collected from the site visit and the literature review.
To find the input data that could not be found in the literature, interviews and discussions with people working within the area were made.
Initially the calculations were made by hand. To verify the manual calculations, a FEM-analysis was made with the same input data as used in the handmade calculations.
The final step within this work was to design a new column according to Eurocode. For the calculation, the computer software Concrete Column by Strusoft AB was used.
3
Literature review
3.1
Fires in general
The fire process in compartments can be divided into different phases. The first phase is the start of the fire, which runs from the ignition to the flashover. During this phase, a positive pressure will be built up in the fire room and causes the air to squeeze out through openings as far as available. Fire gases will begin to fill up the room, starting at the ceiling and working its way down towards the floor. First they will fill up the ceiling before they reach down to the openings. The flow conditions will now change and a neutral plane forms. Above the neutral plane the positive pressure under the ceiling is forcing the hot fire gases out of the openings, and under the neutral plane a negative pressure will be built up and cause cold air from outside to be sucked into the fire room (Bengtsson, 2001). Figure 1 illustrates this phenomenon, called 2 zones model.
Figure 1: 2 zones model for a compartment fire
When the fire reaches the next phase, the flashover, this two-zone layer structure will end and everything combustible in the room will contribute to the fire (Bengtson, 2005), which means that all combustible materials in the room will emit pyrolysis (Bengtsson, 2001). During this
phase the fire gases will reach a temperature between 500 and 600 °C and the radiation level, which the floors are subjected to, is in the range of 15 to 20 kW/m2 (Bengtson, 2005).
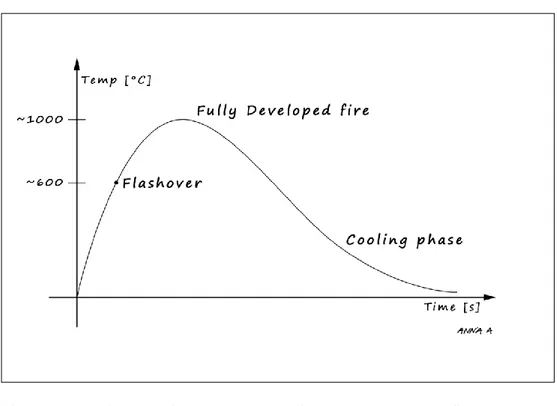
The fully developed fire follows the flashover see Figure 2. During this phase the temperature stays at a constant level between 800 and 900 °C till it decreases with the continuing incinerating of the combustible materials. When this happens, the temperature will drop again and the cooling phase begins (Bengtson, 2005).
Figure 2: Fire growth curve corresponding to a compartment fire
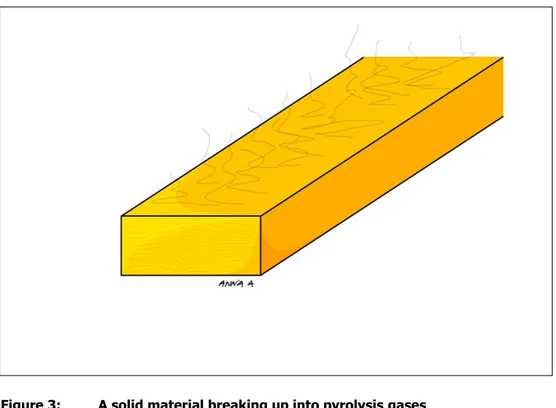
A solid material ignites by pyrolysis. The pyrolysis is a process that describes the breaking up of a fuel. The breaking up happens at a certain temperature and results in pyrolysis gases created at the surface of the material (see Figure 3). How high this temperature needs to be varies between different materials, but usually the surface must be between 300 and 400 °C in order to ignite the material with a pilot flame. A spontaneous ignition requires even higher temperatures. For example, a spontaneous ignition of timber requires a temperature between 500 and 600 °C (Bengtsson, 2001).
Figure 3: A solid material breaking up into pyrolysis gases
The hot gas stream, which is formed above the flame, is called fire plume. The fire plume is formed due to the lower density of the flame and the hot fire gases, compared to the surrounding relatively cold air, and will therefore start to move upward. Air is drawn into the plume and gets mixed with the fire gases. Some of the air will be used for the combustion, but most of it will follow the plume up to the layer of fire gases at the ceiling and dilute the gases (Gojkovic & Delin, 2005). The temperature and the velocity inside the plume are directly depending on how much heat the fire emits and the height of the ceiling above the fire source. Both the temperature and the velocity decreases with the height (Bengtsson, 2001).
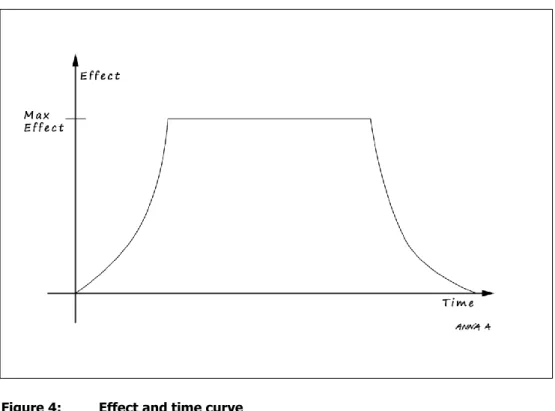
A fire can be either fuel controlled or ventilation controlled. When the fire is fuel controlled, the effect of the fire is controlled by the access of fuel. To increase the effect of the fire, fuel has to be added. When the fire is ventilation controlled, the situation is reversed. The effect is controlled by the availability of oxygen so that an increase of the effect of the fire would be caused by adding more oxygen. During the early phase of the fire it is fuel controlled, but as the fire grows it can eventually turn to be ventilation controlled. This occurs when the available oxygen is no longer enough to burn the pyrolysis gases that the fuel emits (Bengtsson, 2001). Figure 4 shows an example of a time-effect curve for a compartment fire. In the beginning the fire is fuel controlled and the effect is therefore increasing, but after t seconds the fire becomes ventilation controlled and the effect becomes constant until all the fuel is burned and the cooling phase begins.
Figure 4: Effect and time curve
A term often used to describe a fire is Heat Release Rate (HRR). HRR is measured in Joules per second (Watts) and describes the effect of the fire (how much energy in the form of heat that is released from the fire per second). It is a way of measuring the size of the fire.
3.2
Fire in underground facilities
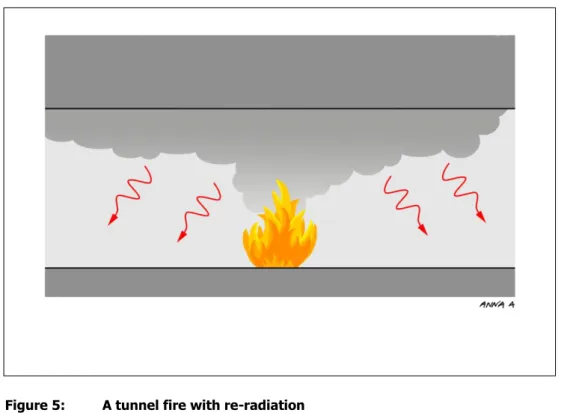
A fire in an underground facility is different compared to an open fire, due to the limited space. The tunnel walls are causing heat reflections that increase the effect of the fire (see Figure 5).
Figure 5: A tunnel fire with re-radiation
The heat reflection increases the temperature so that materials or vehicles that would not have burnt intensely in an open fire turn into a heavy fire inside a tunnel (Ingason, 2005).
At ventilation controlled fires all the oxygen in the combustion zone will be consumed, which leads to that fuel-rich gas will occur and escape to the tunnel exit (Ingason, 2005).
A fire affects the natural ventilation in a tunnel. The natural ventilation may stop or even change direction. Because of this the fire gases can be carried far away from the fire, which will cause a major threat to people evacuating and to the fire fighters during a rescue operation (Ingason, 2005).
Tunnel fires also differ from compartment fires such as e.g. fires in buildings. One difference is the factors that affect the HRR. In a compartment fire the HRR is often dictated by the natural ventilation, i.e. the ventilation factor which in turn depends on the area and the height of the openings. In tunnels the natural ventilation is controlled by more factors such as the size of the fire, the length and slope of the tunnel, the design of the cross section, the tunnel type (concrete or blasted rock) and meteorological conditions at the tunnel exit. The supply of oxygen is usually better for a fire in a tunnel then for a compartment fire and tunnels are often equipped with mechanical ventilation such as exhaust fans and/or jet fans positioned in the tunnel roof. The effect of the ventilation on the HRR is therefore quite different from the effect that the ventilation causes in a compartment fire (Ingason, 2005).
A compartment fire can develop into a flashover within a few minutes, but in a tunnel it is unlikely that a fire will develop into a traditional flashover at all. In a tunnel the heat losses to the surroundings are so large that the sufficient amount of hot combustion fire gases that is needed for a flashover to occur will not be formed. A flashover can however occur in, for example, a vehicle inside the tunnel, but it is unlikely that the whole tunnel will be included in a flashover (Ingason, 2005).
The risk of secondary fire gas explosions at an under ventilated fire is lower in tunnel fires then in compartment fires. This is due to the different conditions of ventilation, the large heat losses that occurs in the tunnels and the differences in geometry. If, however, a powerful
ventilation system is activated in a tunnel during an under ventilated fire, or if big fans start up, the flames can quickly grow and the fire can more easily spread to flammable materials or vehicles located downstream the fire (Ingason, 2005).
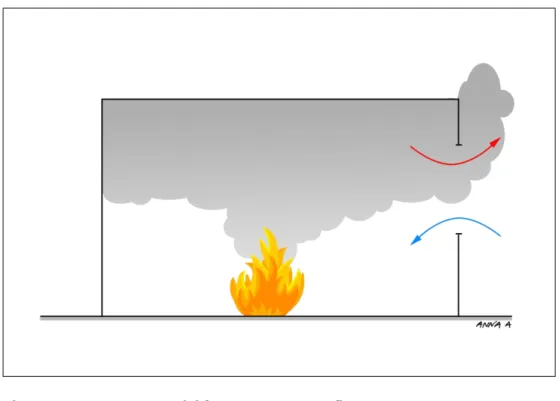
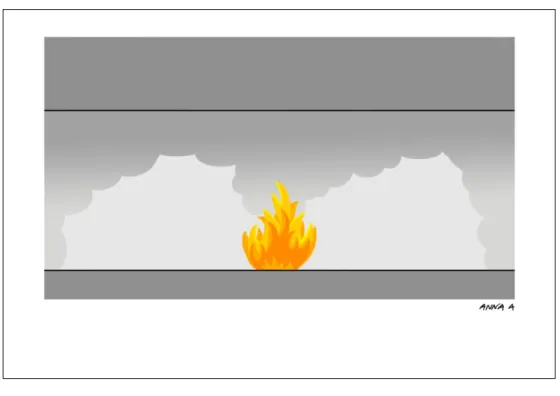
Also the formation of the smoke layers behave differently for tunnel fires compared to compartment fires. At a compartment fire, the smoke lies along the ceiling in the early stage of the fire. Under this hot layer of smoke is a zone of cool, smoke-free air. A similar layer structure can occur close to the fire at a tunnel fire in absence of longitudinal ventilation. Further away from the fire, the smoke will start to fall down as it cools (see Figure 6). How far from the fire this will happen depends on the size of the fire, the section area and height and what type of tunnel it is.
Figure 6: A tunnel fire where the smoke cools down by the surroundings and falls down to floor level
There is no case in the open literature where a tunnel fire has caused such damage to a tunnel so it not been repairable. There is, however, always a certain anxiety about the risk of collapse that a tunnel fire implies. This collapse risk makes an even bigger problem in a submerged tunnel where there is a risk for leakage if the structure gets damaged (Ingason, Bengtson, & Hiort, 1998).
3.3
Examples of fire accidents in underground facilities
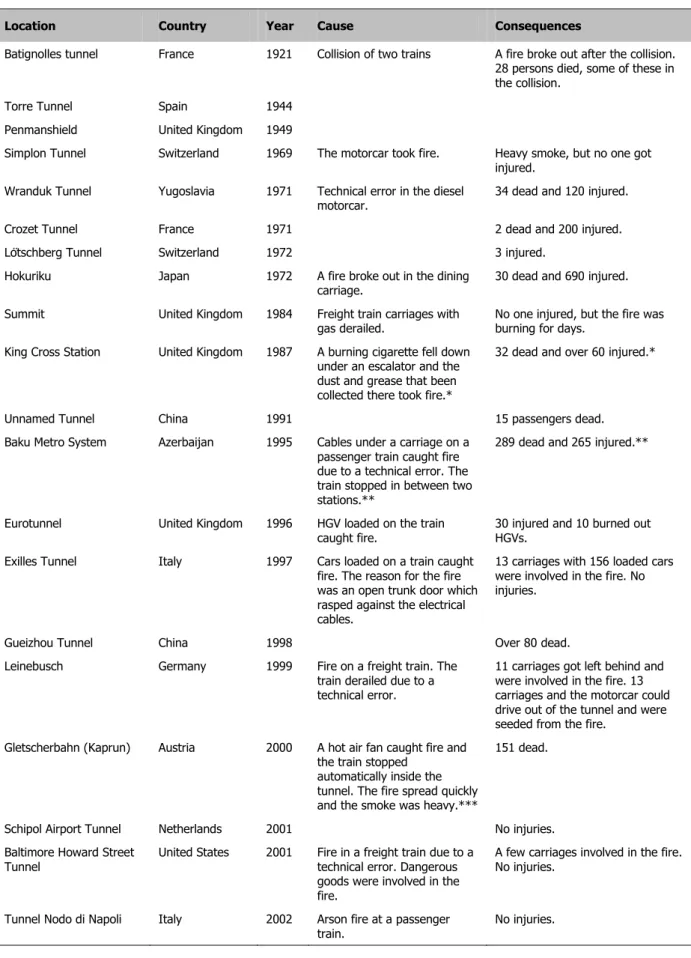
Table 1 below presents a summary of past fires in underground facilities related to rail transport systems. The table is mainly taken from Ingason’s and Lönnermark’s report Brandbelastning och brandscenarier för järnvägstunnlar (2004) but it has been supplemented with more sources. The information that is not taken from Ingason’s and Lönnermark’s report is marked in the table.
Table 1: Examples of fire accidents in underground facilities and tunnels
Location Country Year Cause Consequences
Batignolles tunnel France 1921 Collision of two trains A fire broke out after the collision. 28 persons died, some of these in the collision.
Torre Tunnel Spain 1944 Penmanshield United Kingdom 1949
Simplon Tunnel Switzerland 1969 The motorcar took fire. Heavy smoke, but no one got injured.
Wranduk Tunnel Yugoslavia 1971 Technical error in the diesel
motorcar. 34 dead and 120 injured. Crozet Tunnel France 1971 2 dead and 200 injured. Lötschberg Tunnel Switzerland 1972 3 injured.
Hokuriku Japan 1972 A fire broke out in the dining
carriage. 30 dead and 690 injured. Summit United Kingdom 1984 Freight train carriages with
gas derailed. No one injured, but the fire was burning for days. King Cross Station United Kingdom 1987 A burning cigarette fell down
under an escalator and the dust and grease that been collected there took fire.*
32 dead and over 60 injured.*
Unnamed Tunnel China 1991 15 passengers dead. Baku Metro System Azerbaijan 1995 Cables under a carriage on a
passenger train caught fire due to a technical error. The train stopped in between two stations.**
289 dead and 265 injured.**
Eurotunnel United Kingdom 1996 HGV loaded on the train
caught fire. 30 injured and 10 burned out HGVs. Exilles Tunnel Italy 1997 Cars loaded on a train caught
fire. The reason for the fire was an open trunk door which rasped against the electrical cables.
13 carriages with 156 loaded cars were involved in the fire. No injuries.
Gueizhou Tunnel China 1998 Over 80 dead. Leinebusch Germany 1999 Fire on a freight train. The
train derailed due to a technical error.
11 carriages got left behind and were involved in the fire. 13 carriages and the motorcar could drive out of the tunnel and were seeded from the fire.
Gletscherbahn (Kaprun) Austria 2000 A hot air fan caught fire and the train stopped
automatically inside the tunnel. The fire spread quickly and the smoke was heavy.***
151 dead.
Schipol Airport Tunnel Netherlands 2001 No injuries. Baltimore Howard Street
Tunnel United States 2001 Fire in a freight train due to a technical error. Dangerous goods were involved in the fire.
A few carriages involved in the fire. No injuries.
Tunnel Nodo di Napoli Italy 2002 Arson fire at a passenger
Location Country Year Cause Consequences
Genova Nervi-Pisa
Centrale – Genova Nervi France 2002 A motorcar in a passenger train caught fire due to a technical error.
No injuries. The fire was put out with a fire extinguisher. Mornay Tunnel France 2003 No injuries.
Jungangno Station, Daegu Metropolitan Subway
South Korea 2003 Arson fire on a subway train. 198 dead and many people got injured.*****
Simplon Tunnel Switzerland/Italy 2011 A fire broke out a carriage carrying household goods. The flames spread to the following nine wagons due to the heat inside of the tunnel.****
A few people suffered from minor smoke inhalation.
* (SoS-rapport 1990:30, 1990) ** (Rohlén & Wahlström, 1996) *** (Larsson, 2004)
**** (Swiss Info, 2011) ***** (Lönnermark, 2012)
3.4
Examples of fire tests made in underground facilities
In this section are two full scale fire tests, made in the 1990’s and 2010’s, presented.
3.4.1 EUREKA 499, 1990–1992
One of the larger fire tests carried out is the EUREKA test that was made between 1990 and 1992. Researchers from Austria, Finland, Germany, Italy, Norway, Sweden, Switzerland and the United Kingdom were involved.
Most of the fire tests in EUREKA were carried out in an abandoned tunnel near Hammerfest in Norway. Different kind of tests were made; e.g. car fires, train carriage fires, wooden crib fires, heptane pool fires, a fire with a simulated truck load and a HGV fully loaded with a cargo of furniture. Before these bigger tests in Norway, a laboratory test and smaller tests in tunnels in Germany and Finland were made. In the laboratory test, samples of tunnel lining were tested and in the tunnel tests in Germany and Finland were fire tests with wooden cribs made.
The objectives with EUREKA were to gather information about: fire phenomena
escape, rescue and firefighting possibilities how the surrounding structure effects the fire the reusing of the structure
formation, distribution and precipitations of contaminants.
3.4.2 METRO 2009–2012
Within the METRO project full scale fire and explosion tests were carried out in the Brunsbergs Tunnel in Värmland, Sweden. These tests were included in WP1 – Design Fires and WP5 – Extraordinary Strain on Constructions.
In the first test, the ignition and further fire spread under the carriage was investigated. The initial fire source was a 500 kW heptane pool fire placed under the train. The fire ignited some cables at the train ATC unit, but self-extinguished after approximately 13.5 minutes. The wind speed inside the tunnel before the ignition was 2.0 to 2.5 m/s. The train model used in this test was an X1.
In the second test the same train carriage as in the first test was used. Baggage was placed in the train on the seats and in the corridors in the same way as it is expected that people would leave their bags at a rapid evacuation of a subway carriage. The amount of baggage was chosen so that it would correspond to that all seats in the carriage were occupied, but no standing passengers. It was assumed that 82 percent of the passengers have baggage with them that they would leave behind if they had to evacuate the subway carriage and the average weight of the bags were set to 5 kg. These assumptions come from a pre-study within METRO presented in the report Large-scale Commuter Train Fire Tests – Results from the METRO Project (Lönnermark, Lindström, Zhen Li, Ingason, & Kumm, 2012). The fire in the carriage was started by a small amount of burnable liquid that was poured over one of the seats and ignited. In this test the fire increased into a fully developed fire.
Also in the third test a train carriage of the model X1 was used, but this time it was internally re-built to the model C20. The insulation in the walls and the surface layer of the walls and the ceiling were changed from Isoflex 36 mm and a burnable board to aluminium, and the old seats were replaced. Baggage was placed in the same way as in the second test and the ignition of the carriage was also performed in the same way. The fire turned into a fully developed fire as well but thanks to the improved interior design it took over an hour before it reached that state.
3.5
Concrete structures
During fire the increased temperature cracks and loosens the connections between the cement paste and the ballast. This is because cement paste and ballast have different thermal dilation characteristics. This means that with increasing temperature the cement paste will first get a larger volume and then shrink significantly, while the ballast volume grows continuously with the temperature (Anderberg & Pettersson, 1991).
Normally concrete contains a larger percentage of ballast than cement paste. This means that when the temperature in the concrete raises the cement paste will get heavily deformed resulting in a structural degradation of the concrete. The degradation of the concrete increases with the thermal dilation of the ballast (Anderberg & Pettersson, 1991).
When calculating the strength of concrete subjected to fire, all concrete with a temperature over 500 °C is disregarded while the concrete with a temperature lower than 500 °C is assumed to have its full strength left (Thor, 2012). It is mainly the flexural and tensile strength that decreases when the temperature in the concrete raises. The compressive strength of the concrete is not affected as much as the flexural and tensile strength (Anderberg & Pettersson, 1991).
Explosive spalling means that large parts of the concrete are pushed out, which can result in that the reinforcement gets laid bare and the strength of the structure therefore gets reduced dramatically. The explosive spalling is caused by the vapour pressure that is built up when the moisture in the concrete heats up. When the vapour pressure gets to high the concrete breaks and explosive spalling can occur. Explosive spalling is mainly observed when newer, high-strength concrete is used. The reason why explosive spalling is more common with this kind of concrete is that this type of concrete is denser, making it more difficult for moisture to diffuse through the concrete surface. The moister content of the concrete has an obvious impact on the risk of spalling, but the fire itself also got an impact on the spalling risk. A fire spreading rapidly gives a greater temperature gradient in the concrete which increases the spalling risk (Thor, 2012).
An example of a structure where the surrounding environment causes a higher risk of spalling is a construction placed in a tunnel. Often high-strength concrete is used in this kind of environments, and the moisture content is usually higher than in an above-ground structure. The risk of an intense fire is also bigger in a tunnel then in an ordinary compartment fire (Thor, 2012).
The strength of steel decreases with increasing temperature. It is often the temperature increase in the reinforcement that decides a concrete structure’s strength during a fire (Anderberg & Pettersson, 1991).
3.6
Regulations
In this section the building regulations applied in Sweden today are presented – Eurocodes – but also the regulations that were used before the introduction of Eurocodes – Boverkets konstruktionsregler. These regulations apply to construction and alteration of buildings, but not for construction and alternation of structures such as tunnels. If subway stations are buildings or structures may be a matter of interpretation, but in the case study of this work have subway station been categorized as a building and the track tunnels have been categorized as structures. This means that the building codes have been used when calculation on the structures of the subway station.
3.6.1 Boverkets konstruktionsregler (BKR)
On 1 January 1994 Nybyggnadsreglerna ceased to apply and Boverkets byggregler (BBR) and Boverkets konstruktionsregler (BKR) became effective. With this shift of regulations the requirements changed from being detail steering to functional steering. Thus, instead of specifying regulations of how to build to meet the requirements, the demands in BKR were written to control the function of the chosen solution. The selected solution was less important as long as the function of the solution lived up to the required function. On 1 January 2010 BKR was replaced by Eurocodes.
3.6.2 Eurocode
In 1975 the European Commission (EC) adopted a work program for the field of construction with the intention to reduce technical barriers for trading and to harmonize the
structures. In a first approach the rules were meant to be an option to the member states’ national regulations in order to later replace them (SS-EN 1992-1-2:2004).
With help from a leading committee with representatives from various member states, EC for fifteen years led the implementation of the Eurocode program, which in 1980 led to the first generation of the European calculation rules (SS-EN 1992-1-2:2004).
The EC and the European Free Trade Association (EFTA) decided in 1989, by an agreement between EC and the European Committee for Standardization (CEN), to transfer the preparation and publication of the Eurocodes to CEN through a series mandate to give them a future European Standard (EN). This meant that the Eurocodes were connected with all EU directives and commission decisions relating to the European standards (SS-EN 1992-1-2:2004).
Member states of EC and EFTA agree that the Eurocodes shall be used as a reference document with following purpose (SS-EN 1992-1-2:2004):
As a way to validate that facilities and buildings comply with the essential requirements of EU directive 89/106/EEC.
As a basis for drawing up contracts for construction and related engineering services.
As a basis for drawing up harmonized technical specifications for construction products.
The Eurocodes contains common rules for the design of carrying structures, parts in carrying structures and elements in both traditional and innovative nature. More unusual conditions for the construction and design are not covered. Such cases require special expert investigations (ibid.)
National standards have been introduced, containing information about the parameters that have been left open in the Eurocodes for national selections. The national selected parameters shall be applied in the design of facilities and buildings within the state (ibid.).
4
Analysis of a carrying column exposed to fire at an
underground subway station
In this case study a carrying column corresponding to a column placed at Hötorget’s subway station was analysed. The bearing capacity of the column when exposed to fire was determined. The column was analysed in its current condition and in the condition it would have been in if it were built between 1994 and 2010, i.e. according to Boverkets konstruktionsregler.
As a final step in this case study, a new column was designed. The new column corresponds to the columns at the platform of the current subway station, like the station built after today’s regulations.
4.1
Comparison between the EUREKA and METRO test
When comparing the fire processes in the EUREKA F2St and METRO (test 3) tests, it is clear that the METRO fire was larger than the EUREKA fire. The temperatures in the METRO fire were also much higher than the temperatures in the EUREKA test.
What distinguish the EUREKA test from the METRO test are the sizes and numbers of ventilation openings and the amount of burnable material in the carriages. The METRO test carriage was loaded with baggage and therefore had a higher fire load. The higher fire load influenced the initial fire state, but not after the flashover inside the carriage. When the fire reaches the flashover state, the effects and temperatures are more or less the same independent of the fire load. Since the fire in the carriage is ventilation controlled, the fire load just controls for how long the fire is going to burn.
Choosing the METRO fire as the reference fire, an assumption is made that the train passengers were carrying luggage on to the train, and left it in the train when evacuating.
4.2
Setup of the scenario
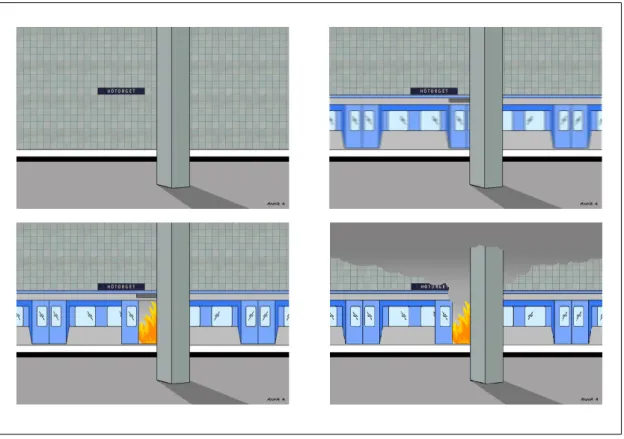
The subway station that was chosen as a reference station for this work was Hötorget’s subway station. The reason for this choice is that at this station the carrying columns at the platform are located close to the tracks. It is just 1.5 m from the columns to the platform edge. This means that if a burning train rolls into the station, these columns will be highly
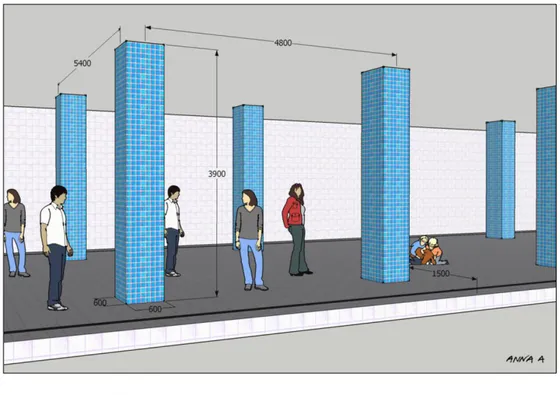
The columns at the platform of Hötorget’s subway station are concrete columns clad with tiles. The columns have the dimensions of 600 x 600 mm and they are 3 900 mm high (see Figure 7). The tiles are assumed to be 10 mm thick, but the calculations have been made for a concrete section of 600 x 600 mm anyway, since tiles can be considered having the same character as concrete.
Figure 7: Hötorget’s subway station
No construction drawings of the columns have been found, so the exact design of the columns have not been established. To get an idea of what the columns could look like inside, a construction engineer with many years of experience in the business was consulted, Åke Bjurholm at the Grontmijr company. Bjurholm considers it likely that a concrete of the quality K30 was used when making the columns, and according to him the concrete growth over the years to a concrete quality equivalent to K50. Bjurholm also estimates that the load capacity of the columns is about 4 000 kN, which is supported by our own calculations (see Appendix A).
In the calculations made within this work the concrete cover layer of the column is set to 40 mm. This assumption was made with the report Betongkonstruktioners beständighet – En genomgång av officiella svenska regler 1926 – 2010 (Fagerlund, 2010) as a base.
The setup of the scenario describes a burning train driving into Hötorget’s subway station, where it stops. The doors open for travellers to evacuate, and stay open. The evacuees are assumed to leave most of their luggage behind when leaving the train.
One of the carrying columns is placed in front of an opened door section. This column is the reference column in the calculations made within this work. The fire is not extinguished, but left to develop into a fully developed fire. The fire does not spread to any of the other carriages. Figure 8 below shows the setup of the scenario.
Figure 8: The setup of the scenario
A burning train comes in to an underground subway station. The doors open and people evacuate. The doors stay open and the smoke starts to fill up the station.
4.3
Calculations
In this section the calculations made within this work are presented. As a first step, the thermal conduction was calculated, both analytically and numerically. The results of these calculations were compiled and converted from one-dimensional values to two-dimensional values. After the conversion, the values were compared with the results from a FEM-analysis made with the same input data as for the handmade calculations. As a final step, the controls of the columns were made and a new column was designed according to Eurocode.
4.3.1 Analytic calculation of thermal conduction
To study the columns’ bearing capacity when exposed to fire, the thermal conduction equations with error functions from compendium Analytisk lösning av värmelednings– ekvationen (Lund University, 1990) was used. These equations are widely spread within fire physics and have a significant role when studying various processes like ignition, flame spread and – like in this case – a structure’s bearing capacity when exposed to fire.
The thermal conduction equations were used to calculate how the heat is transported into the material, thereby finding out at what depth in the column the concrete is heated to 500 °C. With this knowledge it was possible to estimate how much of the concrete cross section is still carrying after being exposed to the fire, and how much should be regarded as
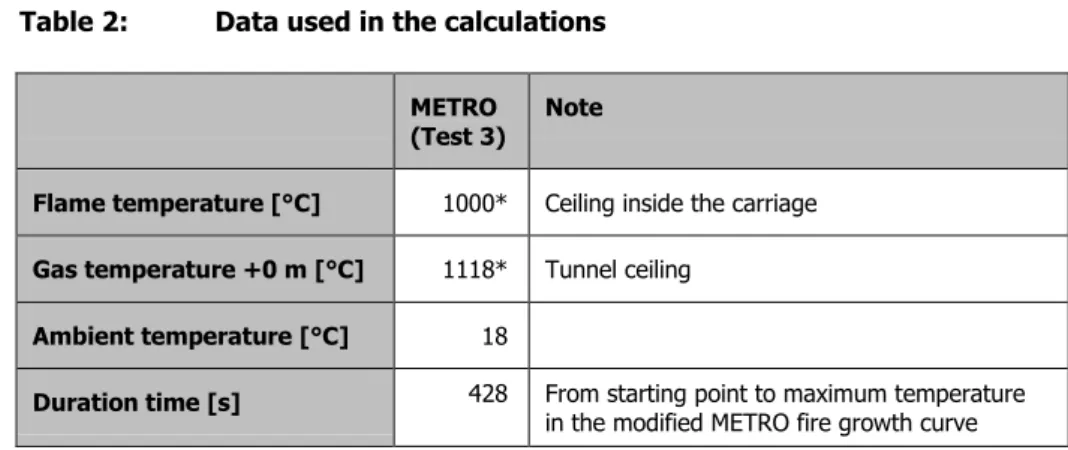
In Table 2 and 3 below are the input data used in the calculations presented. Table 2: Data used in the calculations
METRO
(Test 3) Note
Flame temperature [°C] 1000* Ceiling inside the carriage
Gas temperature +0 m [°C] 1118* Tunnel ceiling
Ambient temperature [°C] 18
Duration time [s] 428 From starting point to maximum temperature
in the modified METRO fire growth curve
* (Lönnermark, Lindström, Zhen Li, Ingason, & Kumm, 2012)
The FEM-analysis carried out within this work (see section 4.3.5 FEM-analysis, page 41) showed that the 500 °C boarder gets deepest into the column when the fire temperature is at its highest. Before using the METRO fire growth curve in the FEM-analysis, it was modified to reduce the amount of data for the software. The slow start of the fire growth curve were cut off and thereby only the end of the fire growth curve, were the fire grows bigger, was used in the model. In order to make the handmade calculations comparable with the results of the FEM-analysis, the same modified METRO fire growth curve was used as basis. The duration time in the handmade calculations is therefore set to the time it took for the fire to reach its maximum temperature in the modified fire growth curve for the METRO fire.
Figure 9 below shows the original METRO fire growth curve and Figure 10 shows the modified fire growth curve.
Figure 9: The original METRO fire growth curve
Figure 10: Modified METRO fire growth curve
The first 6 639 seconds of the original METRO fire growth curve have been excluded. Except from this modification the fire growth curves are identical.
When calculating the thermal conduction analytically, a simplification is made in which the temperature is constant. This means that in these calculations the column is assumed to be exposed to a fire with a fire growth curve corresponding to the fire growth curve presented in Figure 11 below.
Figure 11: Fire growth curve for analytical calculation of thermal conduction Table 3: Data used in the calculations
Material values Concrete Note
Thermal conductivity [W/mK] 1,7
Density [kg/m3] 2300 Heaviness of concrete.
Specific heat capacity [J/kgK] 800
When using the thermal conduction equations, two cases can be chosen; direct impact or radiation impact. Direct impact means that the studied object is subjected to a direct effect of the fire gases rubbing against the structure. Heat is thereby transferred to the structure by convection and radiation. Radiation impact means that the studied object is heated by radiation from a radiating source located at a certain distance from the structure. Both of these cases were calculated.
To calculate the thermal conduction with direct impact without h, Equation 1 was used.
( ) ( √ ) (1)
Since the fire gases are assumed to be rubbing against the column when calculating thermal conduction with direct impact, the temperature of the column’s surface was equalized with the temperature of the fire gases. This assumption can be made since the concrete has slow heat inertia. The surface of the concrete therefore quickly gets the same temperature as the fire gases. The heat will not penetrate the material, but remain at the surface and thereby heat it up instead of directly being led into the material.
(2)
To calculate the thermal conduction with radiation impact without h, Equation 3 was used.
̇
* √ (
√ )+ (3)
The -value was calculated according to Equation 2 above. But to use Equation 3, the heat radiation was also required. Heat radiation is transmission of thermal energy through electromagnetic waves. Energy from a body with a certain temperature propagates in the space as electromagnetic waves and gets absorbed by a receiving media. In other words, heat radiation is an energy exchange between two or more media with different temperatures (Jönsson & Lundqvist, 2005).
Since the radiation source in this case was rectangular (see Figure 12), the incident radiation could be calculated by using view factors.
Figure 12: Illustration of the prerequisites when calculating the heat radiation
The view factor was collected from the table in Appendix B, after calculating the -value and the S-value according to Equation 4 and 5 below. To get the most representative value for the view factor interpolation was used for non-represented values that are in between two values in the table.
(4)
To get the total view factor for the radiating surface the addition law (see Equation 6) was used. In this case it meant that the calculated view factor for area 1 was multiplied with four since surface 1, 2, 3 and 4 were equal.
(6)
The maximum incident heat radiation of a point P was calculated from Equation 7 below. In the calculation within this work, P was corresponding to a point on the column at 90 degrees angle from the radiating surface at a distance D corresponding to the orthogonal distance between the column and the train.
The value of the emissivity was set to 1.0 in the calculations. This value was chosen because the door was assumed to be open, so the heat radiation came directly from the flame. Since the carriage is assumed to be burning flames will fill up the whole door cross-section area. Therefore the radiating area is set to the door opening area. Making this assumption means that the calculation was made for a worst case scenario.
(7)
The heat radiation values that were calculated by using above presented equations are presented in Table 4 below.
Table 4: Heat radiation
Heat Radiation
[kW/m2] Note
METRO test 3 48 Equation 7
To calculate the thermal conduction without the heat transfer coefficient h is a simplification. By leaving out h meant that no account was taken of the experimental geometry, fluid properties, flow characteristics and temperature differences. To obtain values more in line with reality new calculations were supposed to be made where the thermal conduction was calculated with respect to h. Thermal conduction with radiation impact with h cannot be calculated analytically though, and when calculations were made for thermal conduction with direct impact with h the equation did not work for the current scenario.
The equations used to calculate the thermal conduction with direct impact with h was Equation 8 below. ( √ ) ( ) ( ( √ √ )) (8) The heat transfer coefficient was calculated as follows.
(9)
where the heat transfer coefficient for the radiation part is
[( ) (
In Equation 10 the temperature of the surface of the column (Tsc) is assumed to be the same
as the ambient temperature (see Table 2 above).
According to Eurocodes (SS-EN 1991-1-2) the heat transfer coefficient for the convective part ( ) can be set to 25 W/m2K for a standard fire or 35 W/m2K for a natural fire. There
are equations that can be used to calculate the exact value of the heat transfer coefficient for the convective part, but when using the equations the effect of the value is very small. Therefore a fixed value was used here and the heat transfer coefficient for the convective part is therefor set to 35 W/m2K.
In Table 5 below is the calculated total heat transfer coefficient METRO presented. Table 5: Calculated Heat Transfer Coefficient
Heat Transfer Coefficient
[W/m2K] Note
METRO test 3 79 Equation 9
When the values were used in Equation 8 and the depth into the column at 500 °C should be collected, it appeared that this equation did not work for the purpose of this scenario. The marked part of the equation (see Figure 13 below) became so large that the depth into the column resulted in negative figures.
To get a positive number out of the equation, the marked parts of the equation (see Figure 14 below) should be less than 1.
4.3.2 Numerical calculation of thermal conduction
Another way to estimate the thermal conduction is to make numerical calculations. These calculations involve fewer simplifications than the analytical method and therefore give a result which is closer to reality.
To make the numerical calculations, the structure is divided into parallel layers. On one 𝑇 𝑥 𝑡 𝑇 𝑇𝑔 𝑇 𝑒𝑟𝑓 ( 𝑥 √𝛼 𝑡) 𝑒 ( 𝑥𝑘 𝛼 𝑡𝑘 ) 𝑒𝑟𝑓 ( 𝑥 √𝛼 𝑡 √𝛼 𝑡 𝑘 ) 𝑇 𝑥 𝑡 𝑇 𝑇𝑔 𝑇 𝑒𝑟𝑓 ( 𝑥 √𝛼 𝑡) 𝑒 ( 𝑥𝑘 𝛼 𝑡𝑘 ) 𝑒𝑟𝑓 ( 𝑥 √𝛼 𝑡 √𝛼 𝑡 𝑘 )
Figure 13: Thermal conduction with direct impact, h included
on the other side of the structure is the cooler temperature (see Figure 15). The cooler temperature is in this case represented by the initial temperature at Hötorget’s subway station.
Figure 15: Numerical calculations of thermal conduction in principle
The thermal conduction through the structure is then calculated for each layer at different time steps. To calculate a time step, the layer’s temperature calculated in the previous time step is used.
The temperature of the fire side was adjusted to the time steps by using the temperature of the current time read out from the modified METRO fire growth curve (see section 4.3.1 Analytic calculation of thermal conduction, page 31). In other words, at e.g. time step t = 150 s the temperature from the modified METRO fire growth curve at the time 150 s was used.
Since the fire temperature is not set to constant in the numerical calculations the simplification made in the analytic calculations, where the temperature is set to constant, is not needed here. Therefore the numerical calculations are assumed to correspond to the fire growth curve presented in Figure 16 below.
Figure 16: Fire growth curve for numerical calculations of thermal conduction
For the numerical calculations Equation 11 and 12 below were used. To calculate the first layer in every time step Equation 11 has been used and was excluded and thereby calculated for the layers in the different time steps. The rest of the layers have been calculated with Equation 12. The values used in the calculations can be seen in Table C1 in Appendix C.
( ) (11) ( ) (12) The results from the numerical calculations are presented in Figure17 below.
Figure 17: Temperature in the column at distance x at time t
4.3.3 Compilation of the thermal conduction calculations
Table 6 below shows an overview of the results of the thermal conduction calculations made within this work.
Table 6: Thermal conduction
Thermal conduction equations describing the
distance into the material for a 500°C isotope Distance [mm] Note
Thermal conduction with direct impact, h excluded 22 Thermal conduction with direct impact, h included Error Thermal conduction with radiation impact, h
excluded 5
Numerical calculation < 1 Equations 11 & 12
4.3.4 Conversion from one-dimensional to two-dimensional values
The calculated values of the thermal conduction are one-dimensional, which means they are calculated for one-sided fire impact. To convert them from one-dimensional to two-dimensional values, representing a corner with fire on both sides requires that the fire from the METRO test is set in relation to the standard fire growth curve. The reason for this conversion is that both graphs in SS EN 1992-1-2 Annex A and Ulf Wickström’s equations, which can be used to convert a one-dimensional case into a two-dimensional case, are based on the standard fire growth curve.
Within this work, Ulf Wickström’s equations have been used. Equations 13, 14, 15 and 16 are taken from Methods for Predicting Temperatures in Fire-exposed Structures (Wicksröm,
2008) and Application of the Standard Fire Curve for Expressing Natural Fires for design Purposes (Wickström, 1986).
A first step was to (by using Equation 13) calculate at what temperature in the standard fire growth curve it gets 500 °C in the column at the depths calculated for the METRO fire.
(13)
where
(14)
( ) (15)
When the METRO fire growth curve was set in relation to the standard fire growth curve the one-dimensional values could be converted into two-dimensional values. Equation 16 below were used, and by trying with different depths it could be estimated at what depth inside the column it gets 500 °C when the structure is affected from two-dimensional impact. In other words, different depths were tested until got 500 °C.
(16)
Table 7 below presents the depths into the column were it is 500 °C after conversion from one-dimensional values to two-dimensional values.
Table 7: Thermal conduction, two-dimensional values
Thermal conduction equations describing the
distance into the material for a 500°C isotope Depth [mm]
Thermal conduction with direct impact without h 29 Thermal conduction with direct impact with h Error Thermal conduction with radiation impact without h 13 Numerical calculation 5
4.3.5 FEM-analysis
To have something to verify the hand-calculated values with, a Finite Element Method (FEM) analysis was made. Since the Mälardalen’s University could not offer the computer software that was needed, the FEM-analysis was made by Joakim Sandström (Brandskyddslaget). The computer software that was used is Safir 2007a. The analysis was made with the same input data as used in the hand-calculations.
The results of the analysis are presented in Figure 18 below. The figure does not show the whole cross section of the column, but only one of four corners, i.e. one quarter of the column cross section. The frame is taken 450 seconds into the modeling, which was the time that the temperature reached its peak in the FEM-analysis and the 500 °C boarder went deepest into the column.
Figure 18: Screen-shot from the FEM-analysis, 450 seconds into the simulation
The figure shows a quarter of the column’s cross-section.
Figure 18 shows that only a few millimeters of the column’s cross section shall be considered as unusable due to a fire corresponding to the METRO fire.
4.3.6 Control of column
As both the numerical calculations, which are considered more precise than the analytical calculations, and the FEM-analysis show that only a few millimetres of the column’s cross section must be considered unusable, the control of the columns gets unnecessary. Thus, a fire corresponding to the METRO fire will only have a negligible impact on the column.
4.3.7 Conversion factor
The calculation process to design a column according to Eurocodes differs compared to the calculation process to design a column according to BKR. The difference concerns the influence of the selected safety class, and shows as a coefficient in the equations used for calculating the loads when using Eurocodes. When using BKR the effect of the safety class is included in the equations used to calculate the strength of the material.
To be able to use the loads, which were generated by the BKR-calculations when calculating the new column according to Eurocodes, the loads had to be translated from BKR proportions to Eurocode proportions. This was done by developing a conversion factor that translates BKR loads to Eurocode loads. How this factor has been calculated can be seen in Appendix D.
4.3.8 Designing a new column
A new column was designed after today’s regulations, Eurocode (Swedish Annex). The idea was to design the column so it could withstand the damage caused by a fire corresponding to the fire that occurred in the full scale test within METRO tests. But since it was shown in the previous calculations that the impact of the fire was so low the column was designed ultimate limit state instead. The aim of this calculation was now to try to slim down the column’s cross section.
The column was designed with the same prerequisites as the existing columns are assumed to be designed after. During the calculations it turned out that the concrete quality class used in the previous calculations were too poor to cope with the exposure class, so in the second and the third run a better concrete class were used. For the fourth run the utilization ratio was set to 60 percent, same as the column in the verification calculation in Appendix A.
The calculations done to designing the new column was made with the computer software Concrete Column 6.3.001 by Strusoft AB. The calculations can be seen in Appendix E.
4.4
Results of the study
A carrying column corresponding to a column placed at Hötorget’s subway station can withstand the effect and temperature of a fire corresponding to the effects and temperatures that showed at the full scale tests carried out within the METRO project.
The column calculated according to Eurocode needs a cross section of 600 x 600 mm with required reinforcement of 36 ф 20 with stirrups ф 10 s 400.