Software-as-a-Service Business Intelligence:
Adoption Criteria and Business Value
thesis within Informatics
Author: Olawale Adelakun
Thomas Kemper
Tutor: Klas Gäre; Jörgen Lindh Jönköping May 2010
i
Title: Software-as-a-Service Business Intelligence: Adoption Criteria and Busi-ness Value
Author: Olawale Adelakun; Thomas Kemper Tutor: Klas Gäre; Jörgen Lindh
Date: 2010-05-25
Subject terms: Business Intelligence; Software-as-a-Service; cloud computing; in-vestment decision factors
Abstract
The area of Business Intelligence (BI) is both broad and multifaceted and is becoming an increasingly pervasive tool utilized within organizations allowing them to gain greater in-sight into their business operations as well as well as the way in which their customers inte-ract with them. By enabling businesses to perform powerful, effective analytics and report-ing, BI tools allow them to maximize use of their data and facilitate better plannreport-ing, fore-casting and the ability to have a more targeted and efficient value chain. Usage of BI tools allow organizations to not only achieve but leverage their competitive advantage. SMEs are no different in their pursuit for competitive advantage and market share but often is the case that they lack the resources in order to make the substantial investments into the soft-ware and infrastructure required to host a solution on-premise. The Softsoft-ware-as-a-Service (SaaS) model of allowing users to have access to powerful tools and services without having to purchase the solutions or the infrastructure needed to host it on-premise allows SMEs an ideal opportunity to perform many or all of the functionalities that on-premise BI provides. SaaS BI is a relatively new concept only a few years old, but improvements in functionality and features, reliability of service levels and lower costs are allowing it to gain traction and it is projected to increase its momentum in the next few years. The aim of this paper is to investigate the factors that lead to adoption/non-adoption, assigned importance and per-ceived business value of SaaS BI within SMEs. These issues will be addressed through iden-tification of the key decision criteria that influence SMEs to adopt SaaS BI solutions over an on-premise solution and vice versa. Greater insight into the decision making process, usage and value will be investigated with the cooperation of two vendors within the BI field. A two pronged approach targeting both SaaS and on-premise BI vendors and the us-ers is adopted in order to find out the pus-erspective on either end and whether or not they are incongruent. Semi-structured interviews were targeted at both an on-premise vendor and a SaaS vendor and their customers. A questionnaire was deployed to clients of both these vendors. Analysis was then conducted on the findings using an integrated selection model encompassing BI and SaaS theories and concepts outlined in the paper.
ii
Acknowledgement
The completion of this thesis was by no means the solitary effort of the two authors and we would like to show our heartfelt appreciation to the individuals without whom this thesis would not be possible. Special thanks to our supervisors Jörgen Lindh and Klas Gäre for their inspiration and guidance throughout the process of writing this thesis and showing us that our preconceived limits were nothing more than meaningless milestones. Many thanks to Rasmus Madsen of YouCalc and Mathias Carnemark of QlikTech for their time, sup-port and willingness to cooperate with us in this paper. To Jenny Claesson of Jönköpings Kommun, thank you for your interest and enthusiasm in helping us reach our goals. Our colleagues and peers also deserve mention for their constructive critique and providing us with the motivation to do better. Last but by no means least we would like to thank our parents and family and friends for their indefatigable support and unconditional love.
Ipsa scientia potestas est.
Jönköping May 2010
iii
Table of Contents
Abbreviations: ... vi
1
Introduction ... 1
1.1 Background ... 1
1.2 Definition of Key Concepts ... 2
1.3 Problem statement ... 3 1.4 Research questions... 4 1.5 Purpose ... 4 1.6 Disposition ... 5 1.7 Time Plan ... 5 1.8 Delimitations ... 6 1.9 Research decomposition ... 6
2
Literature Review ... 8
2.1 Introduction ... 8 2.2 An overview of BI ... 9 2.2.1 Evolution of BI... 102.2.2 Structure and composition of BI ... 11
2.2.3 Other related concepts ... 13
2.3 SaaS concept ... 14
2.3.1 Evolution of SaaS ... 15
2.3.2 SaaS BI ... 15
2.3.3 Comparison between SaaS and on-premise concepts ... 16
2.3.4 Special SaaS investment considerations ... 17
2.4 SME ... 17
3
Research Methodology ... 18
3.1 Research Approach... 18
3.2 Data Sources and Data Collection Methodology ... 18
3.2.1 Interview Approach ... 20 3.2.2 Survey Procedure ... 20 3.2.3 Survey Design ... 20 3.3 Data analysis ... 21 3.4 Research Quality ... 21
4
Frame of reference ... 23
4.1.1 Analytic Hierarchy Process ... 23
4.1.2 Transaction Cost Theory ... 26
4.1.3 Resource Based Theory ... 27
4.1.4 Resource Dependency Theory ... 27
4.1.5 Knowledge Based Theory ... 28
4.1.6 Agency Cost Theory ... 28
4.1.7 Business Value Measurement ... 29
4.1.8 Integrated Model ... 31
4.1.9 Technology Acceptance Model ... 32
4.1.10 Theory Critique ... 33
iv
5
Empirical Results & Analysis ... 35
5.1 Company Overview ... 35 5.1.1 QlikTech ... 35 5.1.2 YouCalc ... 35 5.2 Interview Results ... 35 5.3 Survey Results ... 38 5.3.1 QlikTech ... 38 5.3.2 YouCalc ... 39 5.4 Theoretical Analysis ... 39
6
Conclusion ... 44
6.1 Discussion / Implications ... 456.2 Limitations & Reflection ... 45
6.3 Future Research... 46
v
Figures
Figure 1: Research Decomposition ... 7
Figure 2: BI architecture (Kemper & Baars, 2006) ... 12
Figure 3: BI Technology levels (Eckerson, 2007) ... 13
Figure 4: Two Step sampling... 19
Figure 5: Analytic Hierarchy Process (Saaty, 2008) ... 23
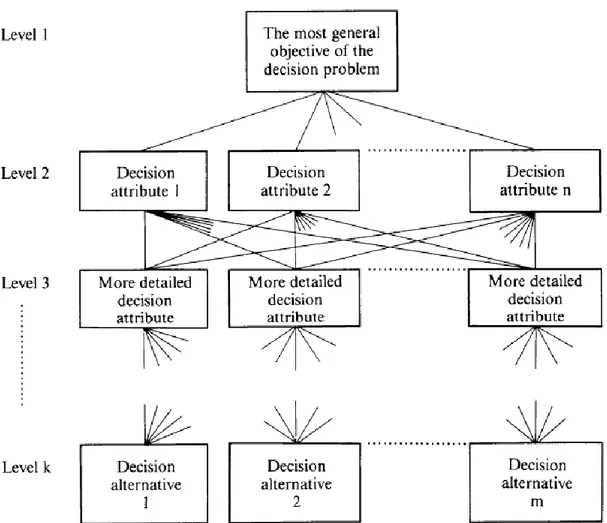
Figure 6: Standard format of decision schema in the analytic hierarchy process (Zahedí, 1982) ... 24
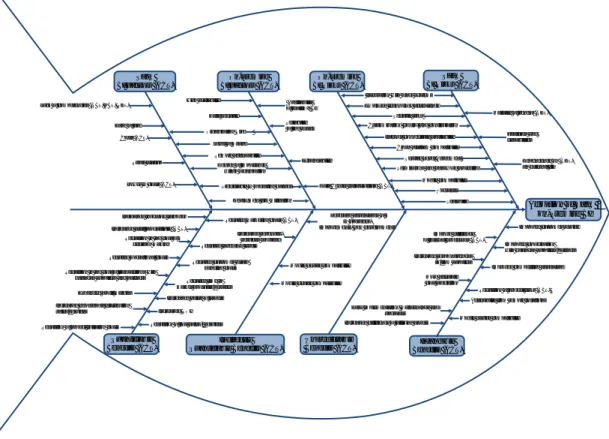
Figure 7: The Adelakun-Kemper Functional Integrated Selection Hierarchy (F.I.S.H.) ... 32
Figure 8: Technology Acceptance Model (Davis, 1989) ... 33
Tables
Table 1: Top Roadblocks to BI success (Henschen, 2009) ... 10Table 2: Differences between on-premise and SaaS (Weston & Kaviani, 2009) ... 16
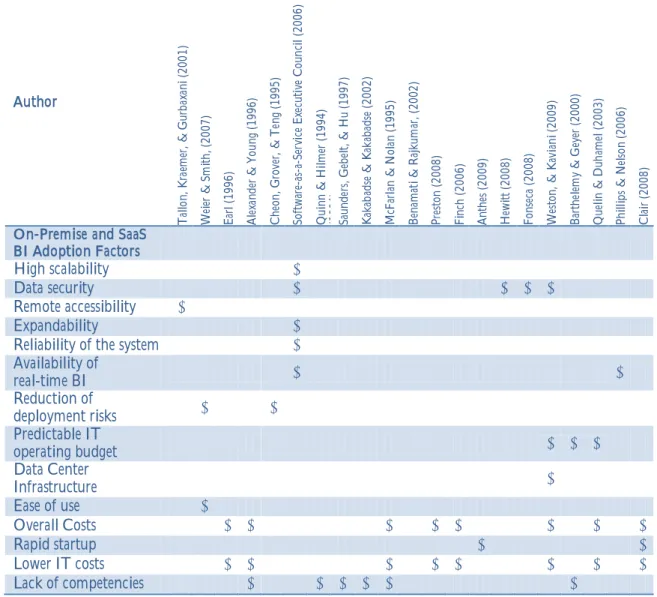
Table 3: On-premise and SaaS adoption factors ... 25
Table 4: On-premise and SaaS BI concerns ... 26
Table 5: Measurement of BI (Pirttimäki et al., 2006) ... 29
Table 6: Benefits of BI activities ... 31
Appendix
Appendix 1 - Interview with QlikTech ... 56Appendix 2 - Interview with Jönköpings Kommun ... 61
Appendix 3 - Interview with Jack Bauer ... 64
Appendix 4 - Interview with YouCalc ... 66
vi
Abbreviations:
Abbreviation / Acronym Meaning
ACT Agency Cost Theory
AI Artificial Intelligence
ASP Application Service Provider
BI Business Intelligence
CI Competitive Intelligence
CRM Customer Relationship Management
DSS Decision Support System
DW Data Warehouse
EIS Executive Information System
ETL Extract Transform Load
EU European Union
F.I.S.H. Functional Integrated Selection Hierarchy
IDC International Data Cooperation
IT Information Technology
KBT Knowledge Based Theory
MIS Management Information System
OLAP On-line Analytical Processing
PEU Perceived Ease of Use
PU Perceived Usefulness
RBT Resource Based Theory
RDT Resource Dependency Theory
ROI Return on Investment
SaaS Software-as-a-Service
SLA Service Level Agreements
SME Small and Medium Enterprise
SQL Structured Query Language
TAM Technology Acceptance Model
1
1 Introduction
This introductory chapter aims to outline the background of the study. Key concepts pertinent to Business Intelligence (BI) and Software-as-a-Service (SaaS) are defined. The research questions derived from the stated problem are also briefly discussed. Additionally, the purpose of the study and a schematic of the research process are also introduced in this chapter.
1.1
Background
Recent technological advancements have caused a resurgence to an idea that has been popu-lar for over a decade known as Application Service Provider (ASP) and is now about to change the application software market. Adjustments have been made to the business mod-el, a new and catchy name was coined and previous technical challenges have been over-come. High-speed internet and more computing power than ever before make it now poss-ible to run applications on a remote server and rent software instead of purchasing it. SaaS as a modern way of distributing and using software is becoming increasingly popular in var-ious fields. Much of the success of this business model can be traced back to the penetra-tion of the online platform salesforce.com within the Customer Relapenetra-tionship Management (CRM) market. Salesforce was founded in 1999 and has been successful for over ten years which can be seen in constant growth rates and by a customer base of more than 72,000 clients across all industries and markets (CRM
available in 16 languages and global players like Siemens, Dell and Starbucks are among their clientele. This indicates that SaaS is not just a fad which will disappear after a short time period but has to be considered as a serious alternative to on-premise software. A study by the Cutter consortium (Kaplan, 2005) shows that 31% of the respondents are al-ready using SaaS and another 34% are currently considering doing so. 82% of the compa-nies currently considering expect to adopt a SaaS solution within the next 6 12 months which lead the researcher to conclude that as of 2006 more than 50% of their respondents would be using SaaS. Despite CRM being the most popular SaaS application there are many other functions that can be supported by SaaS applications. Besides CRM, SaaS pro-viders are pushing for the development of applications utilized in other business areas such as Human resources and more recently BI.
2007 has been a year in which the BI market was majorly reorganized and some of the lead-ing BI vendors changed ownership. The market was consolidated through big acquisitions from SAP, Oracle and IBM who acquired Business Objects, Hyperion and Cognos respec-tively (Daniel, 2007). This pioneered the way for a market concentration and led to the top 5 vendors controlling 75% of the market by 2010 (Feiman & MacDonald, 2010). While the market for on-premise BI is now saturated and major players have established their market position, the novelty of BI offerings in the SaaS market has brought along new op-portunities and is expanding the available market. As Negash and Gray (2008) state the implementation of an on-premise BI solution usually lasts at least six months which is not only lengthy but with an investment of US$ 2 3 million also very expensive. This is due to various challenges that come along with the BI implementation process ranging from high data volumes to several different data source systems. Data quality, data security, network stability and governance issues are only a few aspects that need to be taken into considera-tion when implementing a BI soluconsidera-tion. Having ubiquitous technologies available anytime
2
for SMEs which have been previously only available to multinational companies is termed n-sideration indicates that SaaS technology has brought about an era where companies can rent software on a monthly basis without overwhelming costs. The setup time is considera-bly shorter, the money paid can be accounted into operational expenses rather than capital expenditures and companies can more commonly test the software before making a final decision in demos or on a free trial basis.
The recent financial crisis has played well in favor of SaaS vendors which noticed an in-creased demand in their offerings due to reduced company budgets and the ongoing need to drive efficiency (Sallam & Schlegel, 2009). Hostmann (2009) sees a strong market grow
specific analytic application delivered via SaaS as a standard component of their BI portfo-2007 Hype cycle for Business Intelligence and Performance Management, SaaS BI was found to be 2-5 years away from being on top of the hype curve indicating that it will reach the highest attention during 2009 2012 before waning (Bitterer, Schlegel, Hostmann, Gass-man, Rayner, Chandler, Beyer, Herschel, Radcliffe, White, Payne, Andrews, NewGass-man, 2007). DeSisto (2009) in a recent report stated that the 2009 Hype Cycle still has SaaS BI indicated as 2-5 years away from mainstream adoption showing that, although the SaaS BI industry has been growing, it still has some way to go before it will reach its peak in popu-larity. However, due to the novelty of SaaS BI it does not yet account for a significant turnover compared to the overall BI platform market which is the reason why it has been mostly left out of sight by the major BI vendors (Hostmann, 2009). This leaves opportuni-ties to a high amount of new start-ups in the market which are trying to make a good case for SaaS and clearly focus on SMEs and local initiatives of bigger enterprises as their target group. The promised advantages are numerous and can as well be reasons to decide for a SaaS solution over an on-premise one. The novelty of this services offerings and its market spurs entrepreneurial actions and many new start-ups are competing for market share. While some are rather successful others have not been as fortunate as can be seen with the example of LucidEra and BlinkLogic in 2009.
1.2 Definition of Key Concepts
On-Premise
As opposed to SaaS, the term on-premise is used to describe purchased or licensed software on which the company holds ownership and which is usually operated on the own Infor-mation Technology infrastructure.
Software-as-a-Service (SaaS)
than purchased. Instead of buying software and paying for periodic upgrades, SaaS is subscription based, and all upgrades are provided during the term of the subscription. When the subscription period expires, the software is no longer
2010a).
Application Service Provider (ASP) ASPs
the same as SaaS does today. The difference lies in the approach of trying to cater to every
fol-3
low a one solution fits all approach and make sure that all customers are using the same software. Different models are always accessible for all customers and customization is not necessarily a feature of the service (Levinson, 2010).
Small and Medium Enterprises (SME)
According to the European commission an enterprise is considered to be of small or me-dium size if it falls into certain thresholds in terms of headcount, annual turnover, and an-nual balance sheet total. The borderlines for headcount lie between 11 and 249 (measured in
Enterprises below these measures are considered to be micro- and those that are above large enterprises (European Commission, 2003).
Cloud computing
store, deploy and run applications. Cloud computing takes two for
i-the business applications as well. Regardless of whei-ther i-the cloud is infrastructure only or includes applications, major features are self service, scalability a
2010b).
Information Technology
hardware, software, telecommunications, the myriad devices for collecting and representing data (such as supermarket point-of-sale and bank automatic teller machines), all electroni-cally stored data, and the people dedicated to providing these services. It includes the in-formation technology investments implemented by internal groups (in-sourced) and those outsourced by other providers, such as IBM Global Services or EDS
1998, p. 6).
1.3 Problem statement
Obtaining two different perspectives on one common idea or issue helps to broaden the knowledge within that specific domain and in turn enhance ways of thinking on that sub-ject matter. This becomes clear when thinking about the existing information gap between vendors and customers prior to a buying decision. Before the purchase of a system, the ex-pectations have to be discussed as well as responsibilities for both vendor and customer side
to misleading judgments on both sides due to assumptions and estimates based on little know-ledge about the other side. This can be seen as a knowknow-ledge gap between the involved par-ties which for new and evolving technologies, such as SaaS BI, even more substantial. Fill-ing this knowledge gap becomes increasFill-ingly important to guarantee the success of the im-plemented system and to ensure the expectations before the implementation meet the ac-tual outcome after the implementation. Many companies are not yet aware of BI SaaS which in turn means that vendors have to educate their potential customers about the costs and benefits. Moreover, the novelty of SaaS BI raises previously non-existent chances for SMEs if they manage to implement not only the system but also new business processes. Projects often fail due to a lack of understanding of the real customer needs on the vendor side and an overestimation of the offered solution on the customer side. Due to the novelty
4
of SaaS BI and the cloud computing environment, many companies exaggerate the use of such systems which leaves potential customers with the belief that these tools will change their businesses dramatically. Gartner identifies cloud computing as one of the technologies at the peak of the hype level (MacManus, 2009).
1.4 Research questions
Focusing and comparing two contrary perspectives will allow for an in-depth investigation of the market, its players and potential customers. Working closely together with BI ven-dors and SMEs which are already using BI as well as potential customers will lead to a comprehensive understanding of the opportunities and competitive advantages that SaaS BI promises to deliver. Special interest will be paid to the comparison between traditional on-premise BI solutions on the one hand and the rapidly evolving SaaS BI solutions on the other. Due to their differences in many factors, such as pricing, implementation time, secu-rity issues, etc., it becomes even more important to identify the suitability of one or the other solution for different enterprise characteristics. This research concentrates on the de-cision factors every company investing into a BI system has to address and furthermore takes the business impact of the BI system into account.
This leads to the following research questions:
What factors influence an SME to invest in a SaaS BI solution over an on-premise solution and vice versa?
Is SaaS BI used in the same way as an on-premise system?
o Were companies able to achieve the desired business value?
1.5 Purpose
The International Data Corporation (IDC - Press Release, 2010), in a recent report states that in 2010 SaaS BI will be the hottest segment in BI and that it will experience triple the growth of the market overall. Since Business Intelligence has been a growing sector for sev-eral years and is expected to become more and more important for all types of companies regardless of the industry, size or region they act in, this is an extremely young and exciting field to conduct research in. SaaS as a relatively new technology is expected to change the market allowing smaller players to incorporate advanced analytics and reporting in their SMEs) perspectives to investigate the impact of SaaS BI. The new offering of SaaS BI will be compared to the established and prevalent on-premise solutions which have been around for decades evolving from the domain of Decision Support, Executive and Management In-formation Systems (DSS / EIS / MIS). Special interest will be paid to factors in the soft-ware purchasing process which are decisive in helping organizations determine whether to invest into SaaS BI rather than an on-premise system or vice versa. Interest will also be paid to investigating the perceived benefits (tangible or intangible) that were realized as a result of utilizing the system.
The aim is to provide a model for SME adoption of BI with respect to important decision factors they considered and the business value achieved as a result of utilizing their chosen BI solution.
5
1.6 Disposition
Introduction This section will introduce the concepts of Business Intelligence and SaaS BI. Also included will be the problem definition and the chosen research questions, purpose of study, delimitations and background.
Literature Research Research from articles, books, journals and white papers into differ-ent BI and SaaS BI concepts such as real-time BI, Competitive Intelligence (CI), Artificial Intelligence (AI), operational BI, real time BI and open source BI. Existing research on is-sues, challenges and opportunities experienced as a result of BI usage will be reviewed. Methodology This section includes a description of the techniques employed to acquire data from the SMEs and the BI vendors and suppliers.
Frame of Reference Theories and models used to be utilized in the analysis section of the paper will be discussed at length.
Empirical Findings A presentation of the data obtained by previously discussed methods from the BI vendors as well as their clients.
Analysis An analysis of the empirical data to investigate trends, patterns and expectations from different perspectives depending on their role within the customer-vendor relation-ship.
Conclusion A conclusion derived from the analysis to reveal any possible consistencies and or incongruent trends realized.
Future Work Recommendations of possible ways in which to build on the existing find-ings and ideas for further research will be offered.
1.7 Time Plan
The following timeline outlines a schedule for the planned tasks, objectives and activities. The seminars can be seen as milestones to which individual chapters will be completed and previously completed chapters can be revised.
1/21/2010 6/30/2010
1/28/2010 Start of the thesis work
6/11/2010 Thesis Defense 4/27/2010
Interview youcalc 2/28/2010
Acquired Qlicktech & youcalc as partners
4/19/2010 Interview Qliktech
4/22/2010 Survey send out
5/6/2010 Interview J. Claesson 4/29/2010 Seminar IV 3/25/2010 Seminar III 2/25/2010 Seminar II 1/21/2010 Seminar I 2/8/2010 Search for partners
5/24/2010 Submission 3/21/2010 Development of the questionnaire 3/27/2010 Development of the interviewguide 3/2/2010 Methodology 2/1/2010 Determining Scope of the thesis
2/5/2010 Literature review 4/1/2010 Data collection 5/13/2010 Review 5/1/2010 Analysis 5/10/2010 Interview J. Bauer
6
1.8 Delimitations
This research does not aim to give a comprehensive overview of the market in terms of available BI solutions. Rather, it is focused on SaaS BI solutions and touches only marginal-ly related research fields within BI such as competitive BI, real time BI and artificial BI. Moreover, existing research about IT purchasing processes will be used to analyze the in-vestment process into one or the other BI solution. However these concepts are only par-tially applicable since SaaS is a rather new phenomenon and does not compare to a software or system purchase.
1.9 Research decomposition
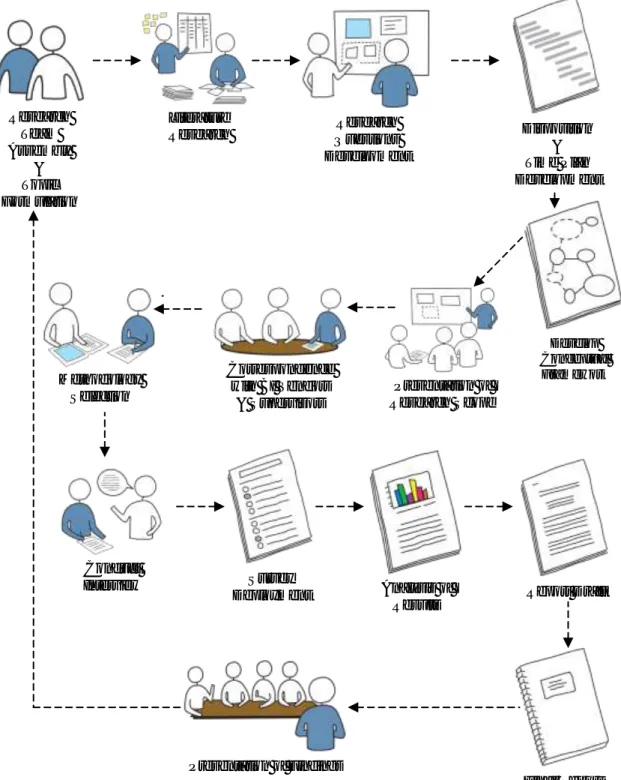
Figure 1 below explicates the blueprint of thesis. The initial stage consisted of the authors teaming up and determining appropriate topics that would be of interest. Many areas were initially proposed but reflection and deliberation produced a focus which transformed into a title formulation. Exhaustive literature research was conducted in the subsequent stage in order to acquire further knowledge about the field and find out what conclusions had been made within the existing literature. This enabled the authors to identify knowledge gaps within the literature and therefore formulate a problem statement. Research questions were therefore developed based on areas that the authors found to be inadequately addressed. A disposition was developed to create an outline of the thesis as well as a time plan to help to peg the objectives and milestones of the project to the timeframe which would help to easi-ly identify whether the project was on or off track. After review of the theories pertinent to the research objectives, a conceptual framework was developed to help provide a holistic schematic of the concepts to be utilized. The research title, scope and questions were then presented to supervisors and peers to receive comments and constructive critique on the work presented. BI vendors (SaaS and on-premise) were approached and informed on the i-litate our research endeavors. Once the authors solicited the cooperation of QlikTech and YouCalc the thesis gained a practical dimension. The methodology on how best to solicit data from the targeted respondents was determined as well as quality issues such as validity and reliability. Interviews were conducted with key members within QlikTech and You-Calc as representatives of the vendor side and also with a SaaS and an on-premise user to be representative of the client side. A questionnaire was developed to address key factors, con-cerns and to evaluate the way in which users perceived the impact of the BI solutions. The aim of the survey would be to help identify the reasons in which users adopted SaaS solu-tions over on-premise BI and vice versa and was deployed to both QlikView
You-Calc dissimilarities
in the respondents data and helped to construct our conclusions. A report draft containing
a near- eminated to
su-pervisors and peers to once again receive critique and comments on the development hi- d-ings before a panel of supervisors and peers.
7 Research Team Assembly & Topic Formulation Develop Conceptual Framework Report Draft Survey Deployment Literature Research Correspondence with BI Vendors & Supervisors Conduct Interview Research Questions Develpoment Final Report Presentation of Findings Disposition & Time Plan Development Methodology Selection Analysis of Results Presentation of Research Scope
8
2 Literature Review
This chapter aims to introduce and discuss key concepts and terms pertinent to the area of BI and SaaS which have been elicited from the body of literature researched during the process of devel-oping this thesis. An overview of BI, its evolution, differences between SaaS and on-premise con-cepts as well as SMEs are addressed within the chapter.
2.1 Introduction
In an increasingly globalized world, competition on the markets becomes harder for all in-volved players and thus boosts the individual need for higher efficiencies and a clearer diffe- g-nificant due to a higher need for accuracy on the one hand and the opportunities made possible by the introduction of modern technologies such as DSS and BI on the other. Le-veraging these technologies in the right way will lead to smarter decision making and hence to an advantage over the competitors.
BI software arose from ongoing development of DSS as well as EIS which have been very a more comprehensive manner as well as applying simple sensitivity analysis. Many research papers cover the various fields of BI and Competitive Intelligence (CI) which indicates that this research topic is well exploited and well understood. The next step in the BI develop-ment is both functional and distributional. As Zaman (2005) proclaims BI is likely to merge with the field of artificial intelligence in the upcoming years adopting the new name of artificial business intelligence and thus will enhance usage, forecasting accuracy, and ana-lytical methods. Besides this functional integration with AI, BI has already ventured into the realm of the cloud and for several years now has been available as SaaS. However, going from DSS to SaaS BI has been a piecemeal journey with SaaS BI just recently being lauded as a serious software solution for companies. Due to various benefits that SaaS offers, it is particularly interesting for SMEs which are looking into BI for the very first time.
Due to the hype BI has experienced in the last 10 to 15 years (Bitterer et al., 2007), there are many different definitions, buzz words and circumscriptions in the literature which led to various conceptions about BI (Turban, Sharda, Aronson, & King, 2008). This research focuses on the most common definitions to make it as universally applicable as possible. Golfarelli, Rizzi, and Cella (2004) in their article
Business Intelligence? define Business Intelligence as the process of turning data into infor-mation and then into knowledge. Negash and Gray (2003) in their article Business Intelli-gence, go further on to explain Business Intelligence systems as being responsible for data gathering, data storage and knowledge management with analytical tools to present com-plex and competitive information to planners and decision makers. Both definitions point to the fact that Business Intelligence is a tool used within organizations to gather precise in-formation about business operations, customers and also competitors which will enable de-cision makers to make more fact based dede-cisions and leverage their competitive advantage.
x-om, 2007). Since then it has become an increasingly pervasive tool being used by compa-nies and has taken many variations.
9
Walters (2009), defines SaaS BI as a model of software deployment that is provided to cus-tomers across the Internet. He discusses that this model frees cuscus-tomers from having to in-stall the application software on their own computers, reducing the burden of software maintenance, installation, configuration, and ongoing operations and support.
Bitterer et al. (2007) describes SaaS BI as BI functions and applications that are supported by a vendor as a service, accessed over the Internet, without the need to deploy and main-tain an on-premise solution. SaaS-based BI enables customers to quickly deploy one or more of the prime components of BI without significant IT involvement, These prime components are:
Analytic Applications BI Platform
Information Management Infrastructure
Hostmann (2009) in a recent Gartner report identified midsized businesses or business units within departments as one of the main patrons of SaaS BI. These enterprises generally have limited resources, less access to IT staff, competencies and BI technology and have a need for rapid deployment of BI capabilities (Weston & Kaviani, 2009).
2.2 An overview of BI
Classic BI suites delivered from established vendors are usually on-premise solutions and require the company implementing this solution to fully integrate the new system into the existing IT environment. Contrary to SaaS, the implementation process is more complex and calls for more resources making sophisticated project management crucial. Reliance on the desired functionalities, underlying IT infrastructure of the company and the business processes the system is designed to support, make this a project many IT departments can-not handle on their own. As mentioned earlier, most implementation processes take at least six months and require an investment of US$ 2-3 million as up-front costs (Solomon & Gray, 2008). This must be seen as an investment with capital expenditures which means that many guidelines of various investment theories apply. Additional maintenance, up-grades and staff training are operational expenses that further burden the IT budget in sub-sequent periods.
The market is well defined and organized, leaving only a few major vendors to take the largest market share. Niche players focusing on industry specific solutions are struggling with advanced generic and highly adaptable products from the industry leaders. Big IT companies such as SAP, Oracle and IBM all offer their own solutions and expertise to mainly large enterprise customers. These solutions penetrate the whole enterprise and offer superior analytics in every domain. They are not intended as departmental solutions com-ing from local initiatives. This is when smaller vendors, usually catercom-ing to medium sized businesses, come into play and can score with a short return-on-investment period and very flexible solutions.
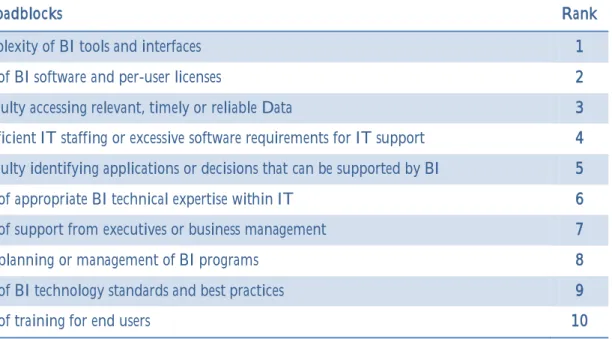
The obstacles in each BI investment decision are well described by Henschen (2009) who identified complexity and costs as the two most important points that hinder an investment into a BI solution. Table 2 gives an overview of the top ten BI roadblocks in accordance to their rank.
10
BI Roadblocks Rank
Complexity of BI tools and interfaces 1
Cost of BI software and per-user licenses 2
Difficulty accessing relevant, timely or reliable Data 3
Insufficient IT staffing or excessive software requirements for IT support 4
Difficulty identifying applications or decisions that can be supported by BI 5
Lack of appropriate BI technical expertise within IT 6
Lack of support from executives or business management 7
Poor planning or management of BI programs 8
Lack of BI technology standards and best practices 9
Lack of training for end users 10
Table 1: Top Roadblocks to BI success (Henschen, 2009)
2.2.1 Evolution of BI
Generating information out of data for smarter decision making describes BI in its purest form. Although the term BI was coined in the mid 20th
century the idea behind it has been in existence for centuries prior and only the IT support in this process is an achievement of
modern times (Luhn, 1958). Luhn (1958, p. 314
p-prehend the interrelationships of presented facts in such a way as to guide action towards a on sup-port and, before BI systems became popular, DSS were fulfilling mainly the same func-tions. Taking a closer look at the development steps of computer systems aiming at infor-mation provision will outline the important differences between the five concepts of MIS, DSS, EIS, Data Warehousing (DW), and finally BI.
MIS were developed during the 1960s and their major goal was to utilize computer power for managers in order gain faster and more accurate information about their businesses. Ef-ficient data handling and first report functions could be found in these systems. Computer based information storage made it easier to store data and faster to retrieve it when needed. Despite the advantages it delivered, these systems were not really successful which can be
traced back to
n-troduced. The novelty of these systems was a higher focus on decision support with ma-thematical and statistical models interpreting data and not just giving out standard reports. It was now possible for managers to gain more useful information out of the database and not just export data about previous periods. A higher degree of usability for the top man-agement was achieved with EIS systems during the 1980s allowing for customized reports and data presentation. Also, the user interfaces got more intuitive so that a broader range of people and managers directly could work with the system. DW are the direct predecessor of BI systems and already encompass the underlying data infrastructure. Inmon (2010)
de--oriented, integrated, time-variant and non-volatile collection of da-data handling can be found in this definition requiring da-data to be more consistent and inte-grated into one common system. DW consist, in a narrow sense, only of a database
orga-11
nizing data in an efficient way. In a broader sense, analytical and report components can be part of DW as well. Due to an increased process oriented way of thinking in the past dec-ades BI describes the whole approach of gathering, manipulating and presenting data. It starts with the integration of various systems that can be used to extract data which is then often (but not necessarily) loaded into DW or Datamarts and later on accessed with analyt-ical tools in order to evaluate the data. BI is thus not a completely new system but compris-es of techniqucompris-es and tools of earlier development stagcompris-es as outlined above augmented with new analytical capabilities. This is also the reason why terms like MIS, DSS, and others are sometimes used interchangeably (Uni Hannover, 2010).
2.2.2 Structure and composition of BI
A BI system usually contains of several different subsystems each specifically designed for crucial tasks in order for the BI system to function adequately and according to the specifi-cations. These subsystems handle tasks such as data provision, data analysis or data presen-tation. Whenever systems have to work together for a common goal, high interoperability is required and the setup should be carefully adjusted so that the whole system can achieve optimal results.
As can be seen by Kemper and Baars (2006) in Figure 2, every BI system consists of three layers and is based on multiple data sources which can be found in both relevant operation-al systems as well as externoperation-al data sources. These systems provide the raw data which is ab-solutely vital for further information retrieval. High precision and accuracy are essential for the outcome of later analyses. Most often the data retrieval from various different systems is a lengthy and difficult process due to discrepancies in the data quality and different data saving conventions. This brings the need for first data manipulation to ensure a high data quality in the data warehouse. The DW is designed to have data ready for fast access and therefore it is often organized as a cube allowing for Structured Query Language (SQL) queries and various On-line Analytical Procession (OLAP) techniques. On top of data sources containing the raw data stand three layers with the task of extracting the data from the source systems, associating numbers with each other and according to preset values, in-terpreting this data which is then appropriately prepared to be shown in easily compre-hendible reports, dashboards and the like. This is where data is turned into information and through this conversion reaches a higher value. The first layer is the data layer handling the data in its purest form and extracting it from various systems along the value chain, or-ganizing it in a uniform storing convention and providing it for further manipulation. Get-ting the data into a usable format is one of the most challenging and time consuming tasks in the implementation of a BI system. The subsequent analytical tools are consistently de-veloped and well tested but the data comes from systems that have been in use for several years and are often run independently without a major need for integration.
The following logic layer runs first analyses and creates meta data in interpreting the raw data in certain ways. This is where information is generated out of the raw data according to predefined mathematical models and algorithms. Most value is added in this layer and just needs to be properly presented to the right audience which then happens in the access layer. The BI portal consisting of dashboards, fully customizable reports, functionalities for queries, and depending on the BI suite further analytical and graphical tools. The use of a BI system to the company varies with the demands the users have and the solutions, tools, and modules offered by the selected vendor.
12
Figure 2: BI architecture (Kemper & Baars, 2006)
What appears simple and easily comprehendible here is a very complex concept in reality. A BI system is usually set on top of other already existing systems that were implemented while the company was growing and whenever new needs were realized. This behavior re-sults today in many companies having a very diversified IT landscape and often is the case that many systems are loosely connected and integration becomes a formidable challenge. This may be due to the fact that earlier stages
have required the systems to be interconnected but then problems arise with the introduc-tion of a BI system that tries to consolidate the disparate systems. The connecintroduc-tion of several different operational systems postulates integration strategies and techniques to unify data structures. After a successful integration of the systems and the Extract-Transform-Load (ETL) process, all the data is stored and ready for access at a data warehouse which makes it possible for the BI program to run its analytics. However system integration and data clean-sing remain as the two big problematic fields within on-premise BI solutions.
The amount of information a user generates out of the BI systems is dependent on the us-ers and systems capabilities. According to Eckus-erson (2007) BI technologies can be catego-rized into four different types according to the information value they provide (Figure 3). The very basic technologies only encompass a reporting function giving the user the oppor-tunity to see basic figures and status quo data. This will only show a static image of the data within the system and not allow for any further insights into how past and future events depend on each other. With growing complexity of the technologies the business value ris-es, allowing for analysis and of using OLAP and other visu-alization tools. The third type of BI technologies is Monitoring including dashboards and scorecards which aim to provide the user with the information from the underlying catego-ries turned into knowledge in relating it to reference-values. At this point it is possible to
13
see whether a project or company is on track to reach the preset goals or off track and ac-tion needs to be taken. The most complex systems even encompass a fourth category which uses the data to draw prediction and estimate future developments. With increasing com-plexity the demand on the user s experience and capabilities rises as s/he has to manage more data in order to turn it into accurate information.
Figure 3: BI Technology levels (Eckerson, 2007)
2.2.3 Other related concepts
The open and very broad definition of what BI actually is allows for it to coincide with other intelligence related concepts. Since the term BI was coined before other technologies merged into the BI field it does not necessarily incorporate newer features that come along with technological advancements. Among these are the combination of internal and exter-nal data sources, access to information in real time rather than a system that is updated in cycles as well as improved features and algorithms for the predictive analytics. Some of these terms will be explained for the better understanding of the reader.
Competitive Intelligence
As McGonagle and Vella (2002, p. 3 itive Intelligence involves the use of This shows a BI approach towards an external environment directed at gathering as much data as possible on competitors' business
data into information. Public, in CI, means all information you can legally and ethically (McGonagle and Vella, 2002, p. 40). The use of such data and the information derived from it can be used to strategically position the enterprise in question better against competitors in local and global markets. This is underlined by Ne-gash and Gray (2003) who define CI as a systematic and ethical program for gathering,
analyzing a
i-sions and operations.
Similarities and differences to BI can be seen in the data gathering and information processing phases. While BI utilizes mostly internal data collected from various systems in
14
the respective field in order to strengthen the own business organically, CI concentrates on external data on external players in order to orientate the company on the competition. It becomes overt that CI has a clear focus on competitiveness as opposed to the general BI idea of leveraging
BI, it is valid to say that CI is merely a subcategory and is hence integrated in a broader un-derstanding of BI.
Operational BI
Moving away from the very strategic approach BI had in the past when mostly tech aficio-nados were utilizing the analytical tools operational BI aims at short-term operational rather than long-term strategic decision making. In doing so it heavily increases the amount of de-cisions made and furthermore limits the importance of single dede-cisions. Operational BI is used by a broader user base in their daily work and not as relevant to the top management. Real time BI
Timely information is considered to be a big advantage in many industries. Regular update cycles that run during the night in order not to stress the IT infrastructure during the daily usage are quite common in many companies. This is mainly due to an overburdened IT in-frastructure that would be challenged with the workload of intensive data updates from many operational systems into a shared data warehouse during the day. Besides that there might have been no need for real time data at the time of the implementation of the sys-tem. However, increasing competition makes a fast information flow indispensable and real time BI becomes a competitive advantage.
Open Source BI
The ongoing open-source movement includes not only operating systems as well as stan-dard office software but all types of application software. Therefore it is only logical that there are also some BI tools to be found in the open-source community. The advantage of open-source BI tools is the possibility to integrate them into existing analytical tools or oth-er application software the usoth-er is using on a regular basis. Popular vendors are Jaspoth-ersoft, Pentaho, and Palo.
BI with incorporated Artificial Intelligence concepts
According to Zaman (2005) BI is rapidly evolving and current customers are constantly in the need for more information and more accurate predictions about the impact of certain actions. These challenges might be approached with a merger of the two fields - Artificial Intelligence (AI) and BI. AI will help finding links and relationships in the existing data and provide the user with more information. Depending on the implementation and capac-ities of the system this is predetermined to take away big parts of the human logic required to interpret datasets and to associate a correct action to it.
2.3 SaaS concept
Software-as-a-Service can be understood as a new type of software distribution and utiliza-tion technology that is, for various reasons, increasingly popular among SMEs. It involves a shift in responsibilities as observed with traditional outsourcing techniques in which com-panies pay other parties for a service they are not willing or not able to provide for them-selves any longer. Along with this transition of responsibility in terms of installation, main-tenance, and support comes a completely different investment model. Using SaaS contracts implies an ongoing agreement between the company and a SaaS vendor which is based on trust with regards to data security, performance, and the hope that the vendor does not
dec-15
lare bankruptcy. Against these disadvantages stand almost no investment costs and a better idea of sustainable vendor-client relationships since the vendor has a big interest in keeping its customers whereas many traditional software vendors seek to seal the deal and leave the customers alone. Revenues are generated through contracts based on a pay-as-you-go sub-scription basis (Clair, 2008; Katzan, 2010; Weston & Kaviani, 2009).
2.3.1 Evolution of SaaS
The idea of renting software rather than buying it is not new nor highly innovative as it might have seemed. The ubiquity of the internet promoted the idea of utilizing networks for distributing software and initially vendors of these services were termed Application Service Providers (ASP). However the internet was still slow, requirements on the software became more and more complex, and ASPs failed to generate value through economies of scale. Multi-tenancy can be marked as the crucial development step laying the foundation for a profitable business idea. This concept basically allows one instance of a software to run for multiple clients and, in doing so, is a great enabler in overcoming the pitfalls of ASPs. In doing so the whole functionality is always provided to all users and updates need to be made only once. It is feasible to identify fast broadband internet connection and the multi-tenancy approach as major facilitators of the success and popularity of SaaS today.
The ASP business model was more of a distant hosting of software rather than an approach to build a software that meets the requirements of different companies from different in-dustries. A one-size-fits-all approach was first introduced with the gradual growth of SaaS and from then on allowed the vendors to operate profitably through the generation of economies of scale. This development from ASP to SaaS happened in the late 1990s and from 1999 salesforce.com spread the word about its SaaS Customer Relationship Manage-ment tool. This helped to make the concept widely known and soon other companies de-veloped a high variety of tools which are now accessible over the internet. However the big-for Business Intelligence and Corporate Perbig-formance Management (Bitterer et al., 2007) in which SaaS BI is on the rise and expected for main stream adoption in the next two to five years.
2.3.2 SaaS BI
An increasing number of SMEs are venturing towards adoption of the SaaS BI model which allows for a cost-effective, on-demand alternative to the on premise paradigm. The major difference between the SaaS BI and on-premise model is that the services applica-tions, reports and analytics are hosted in the cloud. This model is especially suitable for or-ganizations that have tight IT budgets but still realize the need for business analytics and reporting within their enterprises. It is a comparably young discipline and spinoff from the BI market and offers to its user base low cost and a pay-as-you-go payment model. Young startups account for a large portion of the vendors leaving bigger, more established compa-nies only a small share of the SaaS market. The very novelty of this market reveals that its consolidation has not yet been actualized but can be expected in the not too distant future. On-premise vendors as well as SaaS vendors like Salesforce.com will make a strong move into the market in acquiring knowledge and technologies that have been developed while they missed this technological evolution. Popular SaaS vendors include Panorama, Birst, YouCalc, and data applied just to name a few.
16
2.3.3 Comparison between SaaS and on-premise concepts
The idea of renting instead of owning assets1
based on a monthly subscription fee brings along many differences to the traditional way of incorporating software into the IT portfo-lio of a company. Financial and operational decision factors differ tremendously and vari-ous aspects in terms of financing and maintaining the system, compliance with data securi-ty policies, legal issues, and service level agreements (SLAs) need to be extensively evaluated before investment decisions can be made. Table 2 gives an overview over the most impor-tant issues within the decision process. Both alternatives come along with a certain lock-in effect and supplier dependency which is inherent in every strategic investment. However, due to the substantial differences between SaaS and on-premise software, the vendors pack-age it as different solution offerings. SaaS mainly consists of only the analytical program which is, to a certain degree, comparable to the implementation process a users goes through after buying a standard software suite in a store. S/he is left alone with the installa-tion, customizainstalla-tion, and other than consulting a handbook will not find further assistance in operating the program. After sales service is not very common and it is up to the users own activity to find the best way to utilize the new software. The service offered by on-premise BI vendors is often an already named solution which describes a package consisting of various different items often including consultancy during the whole implementation process, the soft- and hardware which perfectly fit to each other, training and after sales ser-vices.
Point of difference On-premise SaaS
Hardware Software and Hardware reside
at the location of the customer
Software and Hardware reside at the premises of the vendor
In House Staff Typically complex software
implementation and mainten-ance requirements necessitate hiring of in house IT experts
End user oriented. Non experts can implement and manage the solution with the assistance of the vendor
Ongoing Maintenance
Implementation Time Possibly months Days
Costs High Upfront Capital Costs Pay as you go fee structure. Per
User per Month fees
Upgrades Paid/sporadic Free/ongoing
Customizable Highly customizable Point to click customization
for SMBs
Remote Access Works best inside company
network
Accessible via the internet on all internet browsers
1 The term assets is used in order to underline that the concepts comprise more than the mere software. The
underlying datacenter and network infrastructure are also crucial parts of the necessary IT environment and hence need to be taken into account.
17
Mobile Access Not Typically Accessible via mobile browsers
Table 2: Differences between on-premise and SaaS (Weston & Kaviani, 2009)
2.3.4 Special SaaS investment considerations
With the above mentioned advantages and disadvantages SaaS brings along, it is of impor-tance to get to know your SaaS vendor before the investment decision is done. Several fac-tors which are not applicable in on-premise software purchase decisions need to be taken into account. As a recent ITWorld article (Wailgum, 2008) points out there are several questions a potential customer should ask the SaaS vendor in focus. The IT department is often left out of the purchasing decision and hence has no chance in evaluating the software and its value from an IT perspective. Integration with other already existing solutions might become an issue and the IT department is first approached to resolve such issues. Other integration issues, such as business processes that have to be adapted, and the Total Cost of Ownership (TCO) are further considerations that have to be made. DeSisto (2009) in an report for the Gartner group identified hidden costs that can occur when you give up control over the software development. SaaS software is subsequently developed and soft-ware updates are made to the vendors schedule. Since this does not necessarily fit the clients schedule problems are to be anticipated. Furthermore, the TCO of SaaS solutions might rise above that of on-premise systems depending on the actual signed-up users and the con-tract expiration. As with all external data hosting offerings questions occur about their in-frastructure, processes of handling emergencies in the case of system failures, security guide-lines, and backup policies. Secure coding standards should be demanded and maybe even external companies verifying these as well as handing out certificates and approving the vendor (R. Madsen, personal communication, 2010-04-27). Furthermore, strong encryp-tion standards should be utilized and the vendor should be forced to stay on top of security issues in updating their systems regularly (Meftah, 2010).
2.4 SME
SMEs are defined by the EU (2005) as companies with less than 250 employees and a max-the economy and make up over 99% of all businesses within max-the EU-27 and compromise 67.1% of all persons employed. In terms of value added the picture changes dramatically as the large enterprises (0.2% in EU-27) are accountable for 42.4% of the share. Due to the limited financial strength of the single SME they are often cost driven and seeking for price efficient solutions in order to run the business as profitable as possible. This also means that SMEs are lacking financial power for big investments and that these are often highly leve-raged. This puts them into the need to find alternative ways of financing their assets such as renting and leasing which again makes them likely customers of SaaS offerings. Due to the specifics of SMEs and the peculiarities of SaaS the adoption process looks slightly different than the one of sophisticated on-premise solutions (Schmiemann, 2008).
18
3 Research Methodology
This chapter aims to outline the research methodology chosen for the thesis and outline why it was chosen. Included is a discussion of the methodology and research approach employed. The chapter also describes the interview structure as well as the design of the questionnaire deployed. Research quality issues are also addressed.
3.1 Research Approach
The thesis will adopt a mixed method approach to solicit data from respondents (BI ven-dors and SMEs). This means both qualitative and quantitative empirical data will be col-lected in order to draw conclusions on the posted research questions. Morse (2003, p. 202)
states
a-tive approach will be used in the form of interviews and be conducted to solicit empirical data from BI vendors and suppliers in terms of what they project the future will hold for SaaS BI and what challenges exist with the implementation and use of the systems within their organization. This will help develop a clearer perspective on some of the challenges, factors, and opportunities that influence their product offerings as well as the customer sa-tisfaction. A focus will be on factors that led to SaaS BI adoption or rejection, the align-ment with other IT applications, issues with post-implealign-mentation support services and technology acceptance. A more quantitative approach will be adopted in the form of ques-tionnaires which will be used to gather data from companies actually using BI. The data collection is done with the purpose of finding out about pertinent issues and considerations concerning the investment into BI and underlining (or challenging) the results from the in-terviews. This will support the interviews with more data and insights from many custom-ers while it contributes to both the reliability and the scope of the study. Using this ap-proach ensures that all contacted companies have to some extent experience with BI and some even with SaaS.
3.2 Data Sources and Data Collection Methodology
Both primary and secondary data will be used to make this study as detailed and compre-hensive as possible. Aside from books, scientific journals, articles, newspapers and maga-zines which serve as secondary data, the authors will collect primary data in the form of in-terviews and surveys which have been especially developed to match the sole purpose of answering the research questions stated in an earlier chapter.
With the aim for high data quality in the collection of primary data, the authors decided to conduct interviews with representatives from the two major BI vendors to facilitate this re-search. On the client side most information will be gathered using surveys coupled with two in-depth interviews with one recent adopter of the QlikView BI suite and YouCalc analytics. This will give the research a mainly qualitative orientation since the authors are not basing the study on the quantitative data but on broad knowledge acquired within the conducted interviews which are subsequently supported by quantitative data. For this rea-son the interviews will be made via phone and questionnaires will be distributed via email. The research is created in an exploratory design since the main goal is to identify the deci-sion factors in the software purchasing process that are decisive and lead to a preference of SaaS BI solutions. This will show and bring up new ideas which have not been researched
19
so far and are worth investigating. The Functional Integrated Selection Hierarchy (F.I.S.H.) model which will be discussed in further detail in chapter 4 consolidates factors, concerns as well as benefits of adopting SaaS BI over on premise BI and vice versa. This model is used to design the structure and content of the questionnaire and interviews to en-able the authors to elicit trenchant perspectives from the respondents.
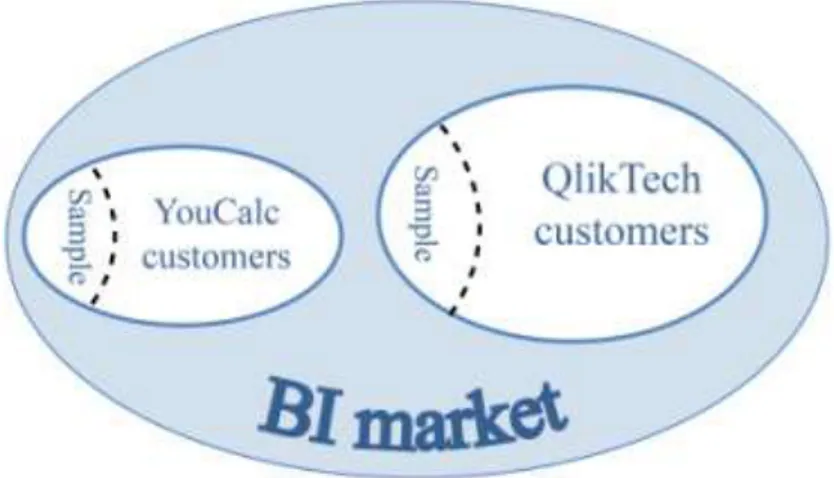
The sampling for the qualitative part is done as cluster sampling because of the orientation of the research. This means two companies were selected out of the pool of available BI vendors which, due to their market positioning, can contribute to the thesis with informa-tion that is also applicable to other vendors. The authors believe that investigating two companies which represent their market fairly well is sufficient for a first exploratory re-search within this field. As can be seen from the previous rere-search section, aspects about BI in general have been exploited for several decades of research studies while SaaS BI is still a very young discipline and not much research has been conducted so far. Although advan-tages and disadvanadvan-tages of SaaS can be found in many articles (Wailgum, 2008; DeSisto, 2009; Kaplan, 2006) none of them provide information about their decisiveness. In utiliz-ing the contacts from the qualitative part of this research it was possible to contact a wide range of BI customers to collect additional quantitative data. This means that sampling was done in two steps (Figure 4). The first one being convenience sampling with regards to choosing and cooperating with the two previously mentioned vendors from the pool of BI vendors within the market. The second step consists of selecting adequate customers which means subscribed premium and free users on a global scale in the case of YouCalc and Swe-dish customers from QlikTech. These groups received the survey and were kindly requested to fill it out and send it back. As incentive for their participation the authors offered a copy of the findings and the final report. The exact number of overall targeted customers to which surveys were sent out to cannot be disclosed but lies in the hundreds. However it was possible to collect a total of 29 returned and fully useable questionnaires. It is notable to add that the sampling itself does not claim to be statistically generalizable since this research was done in cooperation with two vendors that have been chosen in a none probabilistic way. A more sophisticated approach including a market analysis, taking many diversified vendors as well as niche players into account would exceed the scope of this thesis. None-theless the overall population can be defined as the sum of BI vendors (SaaS and on-premise) in a global scale and SMEs in need of BI.
20
3.2.1 Interview Approach
Qualitative research in the form of semi-structured interviews is the basis to get an insight into the knowledge and future expectations from the vendors within the BI software field. Therefore one interview will be conducted with representatives of each of the respective
companies with a duration of about 45
r
-(Marshall & Rossman, 2006, p. 133-135). Difficulties on the other hand lay in dependence on the cooperation of key individuals and the dependence on the interpersonal skills of the researchers (Marshall & Rossman, 2006).
To conform to the requirements the initial interviews will be recorded and transcribed. The interviews will be held via telephone utilizing Skype which has a few disadvantages such as not being able to observe the respondents body language and beyond that, catching nuances in the answers but ultimately the time and cost saving advantages surpassed the disadvantages. Flick (2006) recommends starting the interview with un-structured ques-tions and proceeding via the semi-structured to the structured quesques-tions which will reduce the risk of the interviewer being influenced by the interviewees viewpoint.
3.2.2 Survey Procedure
The surveys are designed to be easy to answer and not very time consuming in order to eli-cit accurate responses throughout the whole questionnaire. In order to make the answering process as convenient as possible, the surveys will be distributed via email in PDF format enabling users to fill them out at the computer and send back via email. This makes it easi-er to fill out the questionnaire and thus saves time and costs for the respondents while be-ing more environmentally friendly. Other advantages include an accelerated response due to the fact that postal mail service was not utilized. Furthermore, it becomes easier to aggre-gate the data and potential mistakes in interpretation through unreadable handwriting are eluded.
Advantages of questionnaires can be seen in the geographical reach and easy access to res-pondents who otherwise could not have been part of the study as well as the ease of mani-pulating and categorizing data which again allows for conclusions that can be easily genera-lized. Weaknesses are mentioned as a strong sensitivity to the initial research question. The more specific and detailed the research questions are defined, the better it can be answered by the questionnaire. There is a risk of defining them too broad and covering too many as-pects very superficially in the questionnaire. It then will lack the academic standard and barely discover new knowledge (Marshall & Rossmann, 2006).
3.2.3 Survey Design
Two slightly different surveys were constructed in accordance to the special characteristics of the responding groups stemming out of the nature of the used solutions and services (a sample of the survey is attached in appendix 5). Both questionnaires consisted of the same sections with partly different answer options depending on applicability for the approached respondent group. The questionnaire can be decomposed into four major parts collecting information about the company itself in terms of size, active markets and the level of in-volvement the IT department has in IT investment decisions. The second part surveys the company specific usage patterns of the BI solution, its importance to the business and grasps the importance of distinctive features that played a major role in the purchasing
deci-21
sion. This is followed by a section evaluating the satisfaction with different concerns (as identified in the frame of reference) and finally a section about the perceived business value of that particular BI solution. Respondents are asked to indicate their satisfaction with the tool in comparison with their pre-implementation expectations. This will indicate which expectations are mostly met and where the solution is
for functionality.
3.3 Data analysis
The empirical data will at first be analyzed completely separated from each other and in another step the gained knowledge from the questionnaires will be used to support conclu-sions and information that have been derived from the interviews. The next chapter entails the frame of reference which will introduce the various theories which are key to analyzing the data. Articles and books covering investment and decision making theory as well as frameworks serve as fundamental background to explain and reason for the results derived from the primary data collection.
For the purpose of data analysis five different theories will be applied and used to evaluate the empirical findings. Furthermore they are linked to an analysis framework (F.I.S.H. model) which has been developed from the literature research and will allow to put the re-sults from the interview and questionnaire into relation with previous studies. The Analyti-cal Hierarchy Process, Transaction Cost, Resource Based, Resource Dependency, Know-ledge Based, and Agency Cost theories in connection with the Technology Acceptance Model will form the frame of reference for the following data analysis. These theories will be discussed in the next chapter to provide the reader with a better understanding as to why they were selected. Afterwards the theories will be applied to the empirical data and the re-search questions will be answered with their help. This comparative method of analysis will point out the most significant differences between the two distribution models (SaaS and on-premise).
3.4 Research Quality
Due to the limited time frame of the research as well as the lack of support from some ven-dors and SMEs we had to cut back on certain issues such as sampling size for the conducted survey and interviews. This affected the results in such a way that they might not be as ge-neralizable as desired at the beginning of the research. Furthermore, the applied conveni-ence sampling approach does not allow for generalizations either.
Close collaboration with one SaaS BI vendor affects the research in such a way that mostly customers of the company in question were approached and their understanding, percep-tion and use of BI was taken into considerapercep-tion for the research. On-premise BI users are addressed in collaboration with a well established on-premise BI vendor. Having these two partners is considered to give a broad enough picture although many other big companies are not represented in this research. Especially due to a lack of resources and time it is easier and more flexible to work with specialized companies rather than with companies which in-tegrate BI only as a module in their ERP systems. Moreover, since the population consists of companies which are actively using BI or have obviously thought about doing so (which becomes evident in them using a trial version of a SaaS BI solution but not subscribing to a
22
premium service later on), this biases the research in such a way that companies which have not made this step but are considering BI solutions as well do not have a chance of being in the research.