Effect of Neutrophils on Nitric Oxide
Production from Stimulated Macrophages
Eric Adua, Frank Oteng Danso, Oswald Mensah Boa-Amponsem and Frank Adusei-Mensah
Linköping University Post Print
N.B.: When citing this work, cite the original article.
Original Publication:
Eric Adua, Frank Oteng Danso, Oswald Mensah Boa-Amponsem and Frank Adusei-Mensah, Effect of Neutrophils on Nitric Oxide Production from Stimulated Macrophages, 2015, Iranian Journal of Immunology, (12), 2, 94-103.
Copyright: Shiraz University of Medical sciences
http://www.iji.ir/
Postprint available at: Linköping University Electronic Press
Effect of Neutrophils on Nitric Oxide
Production from Stimulated Macrophages
Eric Adua1*, Frank Oteng Danso 1, Oswald Mensah Boa-Amponsem 1, Frank
Adusei-Mensah 2
1Department of Clinical and Experimental Medicine, Linköping University, Sweden, 2Department of
Biochemistry, University of Cape Coast, Cape Coast, Ghana
ABSTRACT
Background: During the initial phase of an infection, there is an upregulation of
inducible nitric oxide synthase in the macrophages for the production of nitric oxide. This is followed by the recruitment of polymorphonuclear leukocytes (neutrophils) which release arginase. Arginase competes with inducible nitric oxide synthase for a common substrate L-arginine. Objective: To investigate whether the entry of neutrophils and release of arginase can interfere with nitric oxide production from stimulated mouse macrophages. Methods: Neutrophils were isolated from human blood and stimulated with cytodex-3 beads. Cultured macrophages were stimulated with lipopolysaccharide and interferon gamma with or without N (G)-nitro-L-arginine methyl ester or N (omega)-hydroxy-nor-L-arginine. Measurement of NO2-/NO3- and urea were done using the spectrophotometer. Results: A significantly higher level of nitric oxide production from stimulated macrophages was observed compared to control. There was a decrease in nitric oxide production when stimulated macrophages were treated with the supernatant from activated neutrophils (p<0.05). Conclusion: Arginase from neutrophils can modulate nitric oxide production from activated macrophages which may affect the course of infection by intracellular bacteria.
Eric A, et al. Iran J Immunol. 2015; 12(2): 94-103
Keywords: Arginase, Nitric oxide synthase, N(G)-nitro-L-arginine methyl ester, N(ω)-hydroxy-nor-L-arginine
--- *Corresponding author: Dr. Eric Adua, Department of Clinical and Experimental Medicine, Division of Medical Microbiology, Linkoping University, Linköping, Sweden, Tel: (+)+61406113670, e-mail: eriad828@student.liu.se
INTRODUCTION
Tuberculosis (TB) is a widespread infectious disease and it is caused by the bacteria called Mycobacterium tuberculosis (Mtb). Pulmonary TB is normally associated with signs such as persistent cough, chest pain, weight loss and blood in sputum (1). It is estimated that 8.8 million people were infected with the bacteria in 2010 with a high incidence in the middle income countries (1). Inhaled droplet with Mtb enters the alveolar where they are engulfed and destroyed by alveoli macrophages (2,3) but some studies shows that human macrophages also can serve as a place for Mtb survival (4,5). The presence of Mtb within the macrophages triggers the recruitment of cells such as polymorphonuclear leukocytes (PMN), B and T lymphocytes and fibroblasts leading to the formation of granuloma (2,6,7). Macrophages are derived from monocytes and may differentiate into two isotypes: M1 and M2 (8,9). The classically activated (M1) macrophages are induced when macrophages are stimulated with lipopolysaccharide (LPS), interferon gamma (IFN-γ) and tumor necrosis factor alpha (TNF-α) (10). Macrophages are differentiated into M2 type when they are stimulated with cytokines such as IL-4, IL-13, IL-10 and transforming growth factor beta (TGF-β). While M1 macrophages are involved in cytotoxic and inflammatory responses, M2 macrophages are involved in immune suppression and tissue repair during wound healing (10). Nitric oxide (NO), with antimicrobial properties, can be generated from stimulated M1 macrophages although some studies suggest that the ability of human alveolar
macrophages to decrease bacterial growth is NO independent (11-13). Nitric oxide
synthase (NOS) utilizes arginine as a substrate for the formation of NO and citrulline. Further reaction of NO with oxygenforms the two stable products nitrite (NO2-) and nitrate (NO3-). There are different isoforms of NOS which catalyze similar reactions but with different subcellular location, activation and inhibitor sensitivity (14). NOS can be expressed in neuronal cells (nNOS) and endothelial cells (eNOS) (15). While eNOS is involved in vasodilation, nNOS is required for neurotransmission. However, iNOS is produced from cells such as macrophages, neutrophils and epithelial cells upon during infections (11,14,16).
Within the PMNs are arginase which is found in the tertiary granules while myeloperoxidase and lactoferrin are in the secondary and the tertiary granules, respectively (8). Arginase catalyzes the conversion of arginine to urea and ornithine. Arginase exists in two forms depending on the subcellular location. Arginase 1 is expressed in the cytosol of the liver, the red blood cells and PMNs, while arginase 2 is found in the mitochondria of the kidney (14,17,18). L-Arginine is a semi-essential amino acid and it can be supplied in the diet under certain physiological conditions such as pregnancy and trauma (14). Arginine is necessary for vasodilation, neurotransmission and wound healing (16,19). Arginine supplementation leads to increased iNOS mediated NO production thereby enhancing the bactericidal properties of human macrophages (20,21).
This study seeks to find out whether the entry of PMN with its release of arginase can interfere with NO production from stimulated mouse macrophages (Figure 1). iNOS and arginase activity will be detected by colorimetric measurement of NO2-/NO3- and urea, respectively.
Reduction of nitric oxides by Leukocytes
Figure 1. Illustration of the utilization of arginine by competing enzymes (nitric oxide synthase
and arginase)
MATERIALS AND METHODS
PMN Isolation. A gradient of polymorphprep (Axis-Shield PoC, Oslo, Norway) and
lymphoprep (Axis Shield PoC) was made and 25 ml of whole human blood was carefully added. After spinning in a centrifuge (Sigma-Aldrich Co, St. Louis, MO) at 480 g for 40 mins at room temperature, PMNs were isolated and placed in sorvall tubes. Phosphate buffered saline (PBS) was added to each tube, placed in the centrifuge and spun for 10 mins at 480 g at room temperature. The process of cell lysis began by adding 9 ml of cold distilled water to the sample and after 35 seconds, 3 ml of 3.4% NaCl was added. The sample was vortexed and 15 ml of cold Kreb Ringers Glucose
(KRG) without Ca2+ added and spun at 220 g for 10 mins at 4°C. The cells were
suspended in 1 ml KRG without Ca2+, and counted using the haemocytometer chamber (Biosigma, Italy) under a microscope (Carl Zeiss, Gottingen, Germany) at 100 × magnification. Ethical clearance was not required for this study
Degranulation of PMN. A sum of 1 ×10⁷ PMN cells/ml was stimulated with collagen-coated dextran beads (Cytodex-3, GE Health Care, New Jersey) diluted in 1:1 PBS and KRG. The mixture was warmed in a waterbath (Grant Cambridgeshire, UK) for 30 min at 37°C and the supernatants collected and stored at -82°C until further analyses. MnCl2 was added to the thawed PMN supernatants (PMNsup) and heated at 55°C for 30 mins. This was followed by the addition of L-Arginine and the samples incubated at 37oC for 3 hrs. The arginine hydrolysis was later stopped by the addition of acid mix. To measure the amount of arginine converted to urea, 9% Isonitrosopropiophenone (Sigma Aldrich Co.) in ethanol was added to each tube and incubated for 1 hr at 100°C. Arginase activity was assessed by measuring the amount of urea produced with the spectrophotometer (Molecular Devices Inc., Sunnyvale, CA) at 540 nm.
Cell Culturing and Stimulation of Macrophages. Mouse macrophage (RAW 264.7)
cultured in Dulbecco’s Modified Eagles Medium (DMEM) from GIBCO (Kebo Biomed, Sweden) was complemented with 100 U/ml streptomycin, 100 U/ml Penicillin,
and 10% heat inactivated (55°C, 30 mins) Fetal Bovine Serum (FBS) from Sigma
Aldrich Co. The cells were grown and harvested after 5% CO2 incubation (Kebo
Biomed, Sweden) for 7 days at 37°C. The macrophages were stimulated with IFN-γ (2500 U/ml) and LPS (100 ng/ml) or both and control samples made simultaneously (24). After 24 hr incubation at 37°C, stimulated macrophages were subjected to different treatments such as L-arginine (L-ARG, 1 mM), N(G)-nitro-L-arginine methyl ester (L-NAME, 10 mM), N(omega)-hydroxy-nor-L-arginine (nor-NOHA, 10 mM) (diluted in KRG+ Ca2+). The effects of PMN on macrophages were assessed with the addition of 2×10⁷ PMN cells/ml supernatant. The cells were allowed to incubate for another 24 hrs at 37°C. NO2-/NO3- were measured from stimulated macrophages by the methods describe by Verdon et al. (25),method where there is a reduction of nitrate to nitrite catalyzed by nitrate reductase and measured using the Greiss reaction. Nicotinamide Adenine Dinucleotide Phosphate (NADPH, 10 μM, Roche, Bromma, Sweden) was added to the sample followed by the addition of a mastermix comprising glucose-6-phosphate (50 mM) (Sigma-Aldrich Co.) + Glucose-6-Phosphate Dehydrogenase (40 U/ml, Sigma-Aldrich Co.) + Nitrate reductase (10 U/ml, Roche Diagnostics Deutchland, GmbH, Mannheim, Germany) and PBS (pH 7.6) and incubated in room temperature for 1 hr. Sulphanilic acid (1%) diluted in phosphoric acid (5% with 1hr stirring) and N-(1-naphtyl) ethylenediamine-HCl (0.1% in distilled water, all from Sigma-Aldrich Co., was added to the samples. All measurements were made against NO2-/NO3- standards and NO2-/NO3- concentration were calorimetrically determined.
Statistical Analysis. The comparisons between the different treatments were done using
the student’s t-test and p< 0.05 was considered significant.
RESULTS
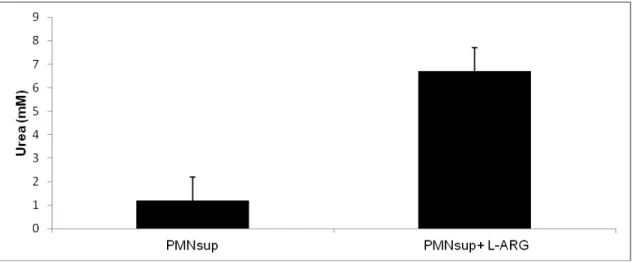
Degranulation of PMN. PMN (2×10⁷ cells/ml) treated with Cytodex-3 beads (1:1 PBS) produce low urea concentration.
Figure 2. Urea production from the supernatant of PMN treated with Cytodex-3 beads,
supplemented with 10mM L- arginine and incubated for 3hrs. Data is presented as the mean ± SD of median from triplicate measurements, n=6 (*p<0.05).
Reduction of nitric oxides by Leukocytes
The concentration of urea in the supernatant of PMN was less than 1 mM and after the addition of L-arginine (10 mM) followed by 3 hr incubation, urea production increased to 6 mM demonstrating high arginase activity (Figure 2).
Figure 3. NO2-/NO3- concentration from RAW 246.7 macrophages stimulated with LPS (100
ng/ml), IFN-γ (2500 U/ml) or in combination after 24 hr incubation. The figure illustrates the mean from the median of triplicate measurements and data presented as mean ± SD, n=6 (*p <0.05).
NO2-/NO3- Production of Macrophages. A higher NO2-/NO3- concentration was observed from LPS stimulated Mφs (86 μM) and IFN-γ stimulated Mφs (56 μM) compared to unstimulated Mφs (21 μM). However the concentration of NO2-/NO3- from IFN-γ and LPS stimulated Mφs was 140 μM (Figure 3).
Figure 4. NO2-/NO3- concentration from a mixture of stimulated macrophages and the
supernatant from 2×10⁷ PMN after Cytodex-3 stimulation with or without L-arginine after 24hr
incubation. The figure illustrates the mean from the median of triplicate measurements and data is presented as mean ± SD, n=6 (*p <0.05).
This was slightly increased when arginine was added (166 μM). No difference in NO2 -/NO3- production was observed from medium treated with PMNsup and L-arginine (data not shown). There was a reduction in NO2-/NO3- when PMNsup was added to both stimulated and unstimulated Mφs (92 μM and 32 μΜ, respectively). No further decrease
in NO2-/NO3- was however observed when unstimulated Mφs were treated with
PMNsup (Figure 4).
Figure 5. NO2-/NO3- concentration from a mixture of stimulated macrophages in the presence of
nor-NOHA and L-NAME with or without L-arginine. The figure illustrates the mean from the median of triplicate measurements and data is presented as mean ± SD, n=6 (*p<0.05).
Figure 6. Urea concentration from a mixture of macrophages and supernatant from Cytodex-3
stimulated PMN with or without L-arginine after 24 hr incubation. The figure illustrates the mean from the median of triplicate measurements with data presented as mean ± SD, n=6 (*p<0.05).
Reduction of nitric oxides by Leukocytes
A much higher decrease in NO2-/NO3- was observed when stimulated Mφs were treated with L-NAME (58 μΜ), which is an analogue of L-arginine and iNOS blocker. Nor-NOHA treated Mφs also had a decrease in NO2-/NO3- production (55 μΜ) (Figure 5).
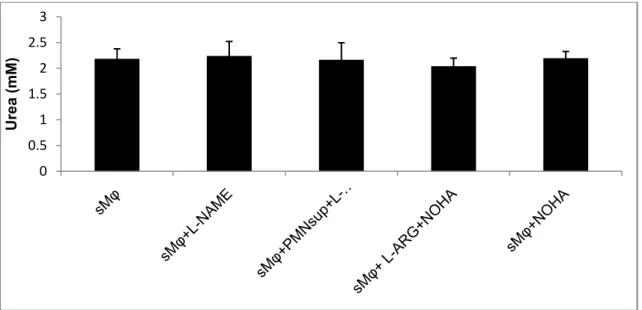
Urea Production from a Mixture of Stimulated Mφs, PMNsup, L-NAME, nor-NOHA and L-arginine. A significant increase in urea concentration was observed from
a mixture of stimulated Mφs treated with PMNsup and L-arginine (Figure 6). There was no difference in urea production from stimulated Mφs subjected to different treatments such as PMNsup, L-NAME and nor-NOHA (Figure 7).
Figure 7. Urea production from stimulated macrophages in the presence of nor-NOHA, L-NAME
with or without L-arginine after 24 hr incubation. The figure illustrates the mean from the median of triplicate measurements with data presented as mean ± SD, n=6 (*p<0.05).
DISCUSSION
It is assumed that arginine is utilized by either nitric oxide synthase to form citrulline and NO or arginase to produce ornithine and urea. 95% of NO is converted to NO2 -/NO3- and hence it is a good estimate of NO production (24).Our findings are in line with Mori and Goti (2000) (15) that there is an increased NO production from LPS/ IFN-γ stimulated RAW 264.7 macrophages. Although NO produced from IFN-γ stimulated macrophages was lower than from LPS stimulated ones, there was an additive effect of NO production from the combined treatment of macrophages with LPS and IFN-γ. Based on this observation, we suggest that IFN-γ alone may not be the best inducer of NO production as showed by Shibata (2011) (26). The increased NO2 -/NO3- production in the presence of arginine gives an illustration that arginine plays a pivotal role in NO production. As we increased the concentration of arginine, the concentration of NO2-/NO3- remained unchanged. This is consistent with Chang et al. (24), findings that increase in NO production is concentration dependent and there is no additional NO production when the concentration of L-arginine is higher than 0.5 mM.
0 0.5 1 1.5 2 2.5 3 Urea (mM)
Stechmiller et al. (16), suggest that during the initial stages of macrophage activation by LPS/IFN-γ (24-72 hours) there is a high production of NO by iNOS. However, NO production is reduced while arginase activity increases in the latter phase (after 72 hours). Arginase uses the available L-arginine to synthesize urea and ornithine enhancing wound healing (16). There was a decrease in NO production when LPS/IFN-γ stimulated macrophages were treated with PMNsup (Figure 4). This effect could be due to the depletion of arginine by arginase which also reduces the availability of arginine for iNOS (15). The effect was, however, reversed by the addition of L-arginine to PMNsup treated macrophages.
A study by Bronte and Zanovello (14) shows that arginase has a higher Km than iNOS while Vmax of iNOS is 1000 fold that of arginase hence iNOS-NO production from activated macrophages remains unaffected, however, our study did not fully support this finding.
Reid et al. (27), showed increased NO concentrations in mice administered with nor-NOHA. However, when we treated LPS/IFN-γ stimulated macrophages with arginase blocker (nor-NOHA) there was no effect on NO production (Figure 4) suggesting a lack of substrate. NO production increased when macrophages were treated with a combination of nor-NOHA and L-arginine. This shows NO production is dependent on the presence of L-arginine (Figure 4). In order to confirm NO production from stimulated macrophages, we used iNOS inhibitor L-NAME. There was a very low NO production when LPS/IFN-γ stimulated macrophages were treated with L-NAME but there was no further decrease in NO when L-NAME was added to PMN supernatant treated macrophages (Figure 4). Our study is in agreement with Pekarova et al. (28), who demonstrates that L-NAME can inhibit nitrate formation from LPS stimulated RAW 264.7 cells. There was an increase in urea concentration when L-arginine was added to stimulated macrophages treated with PMN supernatant (Figure 6). However, there was less urea production from PMNsup and macrophages without L-arginine indicating a shortage of substrate. The production of urea from LPS/IFN-γ stimulated macrophages is consistent with the findings by Mori and Gotoh (15) that, there is co-induction of iNOS and arginase by LPS stimulated RAW 264.7 macrophages. Although Cytodex-3 treated PMN showed a high urea production (Figure 2), there was no increase in urea production observed from PMNsup mixed with macrophages which could be due to a neutralization effect from the macrophages or lack of substrate. No significant difference in urea production was seen from stimulated macrophages treated with different agents such as nor-NOHA, L-NAME (data not shown). Studies have shown, the amount of nor-NOHA required to regulate the activity of arginase in vivo is 100 µM (29). Maximum arginase inhibition in vitro can be achieved with 20 µM nor-NOHA (30) and there was a minimal inhibition of arginase when 10 µM nor-nor-NOHA was used indicating low levels of arginase in the RAW 264.7 cells. It is necessary to maintain the physiological NOHA concentration since over production can lead to complete blockade of arginase (29). Reduced half-life arginase and overheating of the cells could have also affected the activity of arginase in the PMNsup and hence the lack of increment of the urea concentration.
NO is produced by acidification or reduction of nitrite, that in turn can be produced by reduction of nitrate. NO2/NO3 is the final and stable products of NO and in most situations NO reacts with the red blood cells and transported in to the kidneys for excretion. There is also a suggestion that the NO2/NO3 is recycled back into NO. A study in our laboratory showed that these metabolites are present in the urine of
Reduction of nitric oxides by Leukocytes
tuberculosis patients and NO production is partly responsible for the immune defense against M.tuberculosis (31). It is suggested that during TB infection NO plays a key role in reducing the bacteria load (12) and from our study we suggest that level of NO production in TB can be reduced as PMN is recruited.
It can be concluded that arginase from PMN supernatant can modulate NO production from activated macrophages and that this production may affect the development of TB.
ACKNOWLEDGEMENTS
I wish to express my sincere gratitude to my co-authors Oswald and Frank who gave me good constructive criticisms and proofread this report. All the authors contributed in writing this manuscript and we wish to state that there is no conflict of interest and this manuscript has not been sent to any other journal for publication. The project was funded by the Department of Clinical and Experimental Medicine, Linkoping University.
REFERENCES
1. WHO Metacentre: Fact sheets, Tuberculosis [http://www.who.int/ mediacentre 2012; factsheets/fs104/en/index.html].
2. Gideon HP, Flynn JL. Latent tuberculosis: what the host ‘‘sees’’? Immunol Res. 2011; 50: 202-12. 3. Knechel NA. Tuberculosis: Pathophysiology, Clinical Features, and Diagnosis. Crit Care Nurse.
2009; 29:34-43.
4. Persson A, Blomgran-Julinder R, Eklund D, Lindstrom C, Stendahl O. Induction of apoptosis in human neutrophils by mycobacterium tuberculosis is dependent on mature bacterial lipoproteins. Microb Pathog. 2009; 47:143-50.
5. Ray JC, Wang J, Chanb J, Kirschnera DE. The timing of TNF and IFN-gamma signaling affects macrophage activation strategies during Mycobacterium tuberculosis infection. J Theo Biol. 2000; 252:24-38.
6. Segovia-Juarez JL, Suman G, Denise K. Identifying control mechanisms of granuloma formation during M. tuberculosis infection using an agent-based model. J Theor Biol. 2004; 231:357-76. 7. Guinn KM, Hickey MJ, Mathur SK, Zakel KL, Grotzke JE, Lewinsohn DM, et al. Individual
RDI-region genes is required for export of ESAT-6/CFP-10 and for virulence of mycobacterium tuberculosis. Mol Microbiol. 2004; 51:359-70.
8. Jacobsen CL, Theilgaard-Monch K, Christensen EI, Borregaard N. Arginase 1 is expressed in myelocytes/metamyelocytes and localized in gelatinase granules of human PMN. Blood. 2007; 109:3084-7.
9. Benoit M, Desnues B, Mege JL. Macrophage Polarization in Bacterial Infections. J Immunol. 2008; 181:3733-9.
10. Laskin DL. Macrophages and Inflammatory Mediators in Chemical Toxicity: A Battle of Forces. Chem Res Toxicol. 2009; 22:1376-85.
11. Yang CS, Yuk JM, Jo EK. The Role of Nitric Oxide in Mycobacterial Infections. Immune Netw. 2009; 9:46-52.
12. Rich EA, Torres M, Sada E, Finegan CK, Hamilton BD, Toossi Z. Mycobacterium tuberculosis (MTB)-stimulated production of nitric oxide by human alveolar macrophages and relationship of nitric oxide production to growth inhibition of Mtb.fTuber Lung Dis. 1997; 78:247-55.
13. Lee JS, Yang CS, Shin DM, Yuk JM, Son JW, Jo EK. Nitric Oxide Synthesis is modulated by 1, 25-Dihydroxyvitamin D3 and Interferon-γ in Human Macrophages after Mycobacterial Infection. Immune Netw. 2009; 9:192-202.
14. Bronte V, Zanovello P. Regulation of immune responses by L-arginine metabolism. Nat Rev Immunol. 2005; 5:641-54.
15. Mori M, Gotoh T. Regulation of Nitric Oxide Production by Arginine Metabolic Enzymes. Biochem Biophys Res Commun. 2000; 275:715-9.
16. Stechmiller JK, Childress B, Cowan L. Arginine supplementation and wound healing. Nutr Clin Pract. 2005; 20:52-61.
17. Munder M. Arginase: an emerging key player in the mammalian immune system. Br J Pharmacol. 2009; 158:638-51.
18. Erisir M, Ercel E, Yilmaz S & Ozan S. Evaluation of optimal conditions for arginase activity in streptozotocin in induced diabetic rats. Vet Med. 2005; 50:69-76.
19. Peranzoni E, Marigo I, Dolcetti L, Ugel S, Sonda N, Taschin E, et al. Role of arginine metabolism in immunity and immunopathology. Immunobiology 2007; 212:795-812.
20. Schön T, Elias D, Moges F, Melese E, Tessema T, Stendahl O, et al. Arginine as an adjuvant to chemotherapy improves clinical outcome in active tuberculosis. Eur Respir J. 2003; 21:483-8. 21. Butcher S, Chahel H, Lord JM. Ageing and the neutrophil; no appetite for killing? Immunology.
2000; 100:411-6.
22. Borregaard N. Neutrophils from marrow to microbes. Immunity. 2010; 33:657-70.
23. Munder M, Mollinedo F, Calafat J, Canchado J, Gil-Lamaignere C, Fuentes JM, et al. Arginase I is constitutively expressed in human granulocytes and participates in fungicidal activity. Blood. 2005; 105:2549-56.
24. Chang CI, Liao JC, Kuo L. Arginase Modulates Nitric Oxide Production in Activated Macrophages. Am J Physiol. 1998; 274:H342-8.
25. Verdon CP, Burton BA, Prior RL. Sample pre-treatment with nitrate reductase and glucose-6-phosphate dehydrogenase quantitatively reduces nitrate while avoiding interference by NADP+ when the Griess reaction is used to assay for nitrite. Anal Biochem. 1995; 224:502-8.
26. Shibata T, Nagata K, Kobayashi Y. Apoptotic neutrophils and nitric oxide regulate cytokine production by IFN-γ-stimulated macrophages. Cytokine. 2011; 53:191-5.
27. Reid KM, Tsung A, Kaizu T, Jeyabalan G, Ikeda A, Shao L, et al. Liver I/R injury is improved by the arginase inhibitor Nω-hydroxy-nor-L-arginine (nor-NOHA). Am J Physiol Gastrointest Liver
Physiol. 2007; 292:G512-7.
28. Pekarova M, Lojek A, Martiskova H et al. New role for L-arginine in regulation of inducible nitric-oxide-synthase-derived superoxide anion production in raw 264.7 macrophages. ScientificWorldJournal. 2011; 11:2443-57.
29. Cox JD, Cama E, Colleluori DM, Pethe S, Boucher JL, Mansuy D, et al. Mechanistic and metabolic inferences from the binding of substrate analogues and products to arginase. Biochemistry. 2001; 40:2689-701.
30. Topal G, Topal JL, Brunet A, Walch L, Bocher JL, David-Dufilho, M. Mitochondrial Arginase II Modulates Nitric-Oxide Synthesis through Nonfreely Exchangeable L-Arginine Pools in Human Endothelial Cells. J Pharmacol Exp Ther. 2006; 318:1368-74.
31. Idh J, Westman A, Elias D, Moges F, Getachew A, Gelaw A, et al. Nitric oxide production in the exhaled air of patients with pulmonary tuberculosis in relation to HIV co-infection. BMC Infect Dis. 2008; 146:2334-8-146.