Evaluation of protein sequence
classification patterns
HS-IDA-MD-02-010
Emanuel PetterssonSubmitted by Emanuel Pettersson to the University of Skövde as a dissertation towards the degree of M.Sc. by examination and dissertation in the Department of Computer Science.
September 2002
I certify that all material in this dissertation which is not my own work has been identified and that no material is included for which a degree has already been conferred upon me.
____________________________ Emanuel Pettersson
Abstract
Classification of protein sequence is one of the foundations of bioinformatics, as new proteins are sequenced every day. Each protein sequence represents a protein of a certain family and its function can sometimes be predicted through sequence classification. Today several approaches exist for sequence classification, and in this work pattern approaches are considered. A pattern is an expression, representing a certain protein family, which corresponding protein sequences hopefully match. PROSITE is a pattern collection that well known in the area of bioinformatics and therefore plays an important part in this project together with the MAMA pattern collection.
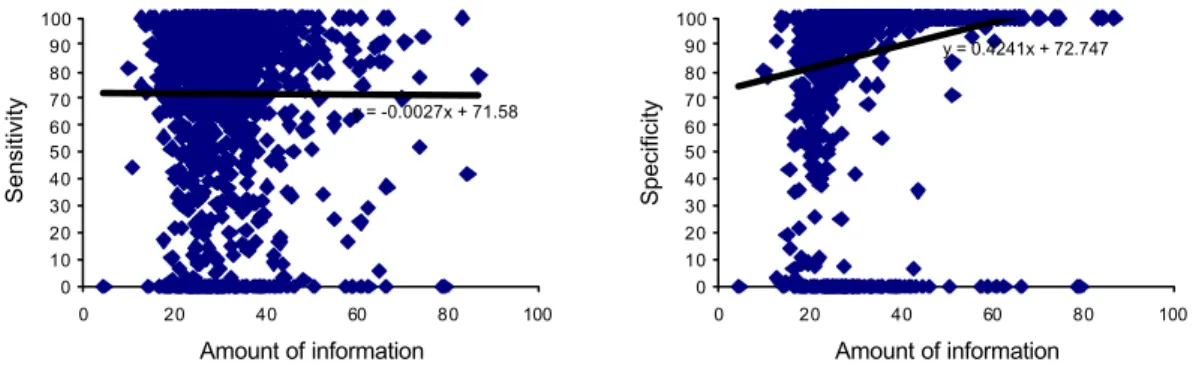
Evaluation of patterns today focus on accuracy, i.e. sensitivity and specificity, but in this thesis information content is also considered. The intended experiment which was about discovering any relationship between accuracy and information content showed that no clear connection was found. This fact led to the conclusion that information content might not be suitable as an evaluation measure when evaluating patterns.
The second experiment concerned the fact that sometimes the same sequences are used both during training and testing, which probably gives misleadingly high accuracy values. This fact gave birth to the idea that an independent test set other than the training set reduces accuracy values, which was revealed after a number of tests.
Finally the last experiment, which was about creating a new system for evaluating whole pattern collections, is presented with results showing that MAMA performs better than PROSITE according to this system.
1 Introduction 1 2 Background 5 2.1 Sequence Analysis 5 2.1.1 Sequence Alignment 5 2.2 Classification methods 6 2.2.1 Patterns 7
2.2.2 Hidden Markov Models 8
2.3 Protein family classification 8
2.3.1 PROSITE 8
2.3.2 MAMA 11
2.3.3 PRINTS 12
2.3.4 Pfam 13
2.4 Pattern discovery tools 14
2.4.1 EMOTIF 14 2.4.2 Pratt 15 3 Evaluation methods 17 3.1 Holdout 17 3.2 Cross-validation 18 3.3 Bootstrapping 18 3.4 Benchmarking tools 19
3.4.1 Benchmarking multiple alignment tools 19
3.5 PROSITE’s evaluation methods 21
4 Problem description 24
4.1 Aims 24
4.2 Hypotheses 24
4.3 Objectives 25
5 Data sets, experiments, methods and tools 27
5.1 Data sets 27
5.2 Experiments 29
5.3 Evaluation method of choice 30
5.4 Tools 31
6 Results 32
6.1 Evaluating accuracy and information content 32
6.2.3 c = 0.005 41
6.2.4 Information content of MAMA and PROSITE patterns 43
6.3 Modified pattern scoring function 45
6.3.1 c = 0.5 47
6.3.2 c = 0.05 49
6.3.3 Modified information content of MAMA and PROSITE patterns 51
6.4 Evaluating independent test sets 53
6.5 Evaluating pattern collections 54
6.5.1 New_seq.dat 56
6.5.2 New_seq.dat with PDB references 58
6.5.3 New PDB entries 59
7 Analysis 62
7.1 Evaluating accuracy and information content 62
7.2 Evaluating independent test sets 64
7.3 Evaluating pattern collections 64
8 Conclusions 66
8.1 Evaluation of hypotheses and aims and objectives 66
8.2 Contributions 67
9 Future work 68
1 Introduction
The following section is an introduction of the area of interest and the problem to be solved.
Classification of protein sequences is about predicting the functionality of protein sequences and is often considered as one of the foundations of bioinformatics. A polypeptide chain is in this dissertation referred to as a protein sequences and is described by a string of letters representing different amino acids. Today 23 amino acids are known of which 20 are biologically interesting, and these can be categorised according to their characteristics. The sequence for the major human prion protein (1QLX) is shown in figure 1 (Zahn, et al. 2000).
MANLGCWMLVLFVATWSDLGLCKKRPKPGGWNTGGSRYPGQGSPGGNRYPPQGGGGWGQP HGGGWGQPHGGGWGQPHGGGWGQPHGGGWGQGGGTHSQWNKPSKPKTNMKHMAGAAAAGA VVGGLGGYMLGSAMSRPIIHFGSDYEDRYYRENMHRYPNQVYYRPMDEYSNQNNFVHDCV NITIKQHTVTTTTKGENFTETDVKMMERVVEQMCITQYERESQAYYQRGSSMVLFSSPPV ILLISFLIFLIVG
Figure 1 The sequence for the major human prion protein (1QLX).
Due to the specific order of the amino acids the sequence encodes for a particular protein, in this case a protein that interacts with the HIV virus (Zahn, et al. 2000). Proteins handle almost everything in the body (except interactions handled by for example electrons), oxygen transportation, tissue regeneration, defence against bacteria and virus, acting as catalyst for chemical reactions, building up structures like hair, nails and skin, etc. It is the functionality of the protein that is the interesting part about sequence analysis, and it has been shown that it is the spatial configuration of the protein that is of most importance for functionality. In the process of predicting functionality there are three main states, the first is the sequence. The idea is to predict the structure, which is the second state, which represents the sequences by using several different methods. Finally by comparing the predicted structure with other structures with known functionality predict the functionality, the final state. This is possible due to the fact that similar structures seem to have similar functionality. Figure 2 shows a simplified 3D structure for the major human prion protein (1QLX).
Figure 2 3D structure of the major human prion protein (1QLX).
Even though 3D structures have proven to be efficient when predicting protein functionality other techniques are often used. The reason is the large amount of time and cost required to determine the complete structure. Therefore other less costly and time consuming techniques have been developed. One of these techniques is patterns, a pattern is built from a number of sequences representing a protein with known functionality. The main difference between using patterns and structure prediction is that, as just described, function prediction using patters only requires a fraction of the time and cost needed for structure prediction.
Last year (2001) 80 772 sequences were added to SWISS-PROT/TrEMBL1 and approximately 3300 structures were determined (Bairoch and Apweiler, 2000), these numbers clearly shows that far from all sequences added are structure determined. This again shows the need of better methods for function prediction, such as patterns, hidden Markov models and finger prints.
Some researchers consider all residues to be important when analysing sequences, as they claim that all residues contain some sort of information (Attwood and Parry-Smith, 1999). Others believe that only residues that are evolutionary conserved are of interest,
as those residues are connected to the functionality (Attwood and Parry-Smith, 1999). The method that creates patterns is based on the last idea, and therefore creates patterns for the evolutionary conserved residues in which the other residues are represented by wildcard.
Today several approaches to sequence classification exists, the use of patterns is one common strategy (others are for example finger prints and hidden Markov models). A pattern represents a family of protein sequences (or a particular binding site), for which information about family, functionality etc. is known. PROSITE (Hofmann, et al. 1999, p 215) is the most referenced pattern collection available at the moment, the version from August 30, 2001 consisted of 1096 documented entries describing 1483 different patterns, rules and profiles/matrices. The contribution from protein classification tools using patterns is a fast and hopefully reliable prediction technique. A sequence is matched to a pattern if that sequence fulfils the constraints of the pattern. The example pattern:
A-{AY}-S-x(2)-[YT]
will match sequences which contain the letter A followed but one arbitrary letter other than A and Y followed S followed by two arbitrary letters followed by the letter Y or T. The drawbacks with PROSITE is the evaluation approach used by developers of PROSITE, this is mainly due to the fact that the same data set is used both as training set and test set. A further description of PROSITE is available in sections 2.3.1 and 3.5. The patterns are therefore tested on the training sequences, and based on the result accuracy values are calculated. This use of the data set might probably be the reason for the misleadingly high values concerning accuracy.
There are different existing approaches for deriving patterns from existing sequences, and these can be divided into two main categories – automatic and manual. To produce the patterns in PROSITE some manual interpretation is used. But other approaches, such as MAMA (Motif- finding by Analysis of Multiple Alignments) (Olsson and Laurio, 2001, p 4) are fully automated, see section 2.3.2. Because there are many differences between PROSITE and MAMA considering time and cost, is there an interest in evaluation of automatic (MAMA) versus manual (PROSITE) approaches. A more straightforward comparison between PROSITE and MAMA would be that much
which is very time consuming. MAMA does not focus on such biological knowledge, only the frequencies of the amino acids, which is much faster. The question to ask is if biological interpretation required or if a faster pure statistical method is enough to create adequate patterns.
One of the problems focused on in this work is whether or not PROSITE’s evaluation method is adequate, therefore a few other acknowledged approaches for evaluation are briefly presented; holdout, cross-validation and bootstrapping. Some of these refined methods are to be taken into consideration when the new evaluation strategy is developed.
Another related issue is the evaluation of different collections of patterns which enables objective comparison of the collections. PROSITE is currently evaluated by testing the patterns on sequences used during training and from the results sensitivity and specificity are calculated, this usage of the training set probably boosts the accuracy values. This kind of testing does not measure the performance when matching with unknown sequences, which is the idea with sequence classification.
Comparison of different protein classification methods is important due to the fact that so many methods exist and it is difficult to compare the accuracy of patterns created by different methods. As developers of the different methods claim that their method is better than others due to various reasons, it is of great interest to clarify if the difference means anything. Another approach instead of comparing the different methods might be to try to combine them, and in that way get all their benefits. The two methods of interest in this project, PROSITE and MAMA, are similar in the way that they both use a pattern matching technique. The difference, as described briefly above, is how patterns themselves are produced. The similarities between these methods, that they use similar patterns, make the usage of a test set applicable to both methods possible.
The ability to compare results from different methods would also enable combination of different results, and perhaps reveal new unconfirmed information.
2
Background
This section is an introduction to biological sequence analysis, the approaches and tools of today in the same area. Some terms of importance for the rest of the report will also be introduced. The approaches to be discussed below are fundamental contributions to protein family classification. The core issue in protein family classification is to be able to tell which protein family a new sequence belongs to. Patterns is one common approach for classifying new sequences. Profiles and weighted matrices are other approaches that might be used when patterns are not enough (Falquet, et al. 2002, p 235) e.g. Pfam which uses hidden Markov models.
2.1 Sequence Analysis
The importance of sequence analysis is well described by Setubal and Meidinas (1997, p 47) as the most important form of analysis in computational biology, functioning as a basis for almost all other more complex analyses. Sequence analysis is about identifying the parts in sequences which are alike and the parts which differ. The objective with sequence analysis is generally to predict the functionality of the protein the sequence represents (Attwood and Parry-Smith, 1999, p 10).
2.1.1 Sequence Alignment
Sequence alignment is about finding evolutionary conserved regions, regions of great importance, identifying sub-families, and to search databases for related sequences. There are two basic methods in sequence alignment, pairwise and multiple.
The most basic task in sequence analysis is to decide whether or not two seque nces are related (Durbin, et al. 1998, p 12). The objective is to align the sequences and by their similarities (or dissimilarities) tell if the sequences are related or not. Four issues are of great importance during pairwise alignment: What sort of alignment should be considered, the scoring system to rank alignments, the algorithm used to find good scoring alignments, and the statistical methods used to evaluate the score. There are two different sorts of alignment in consideration, namely global and local. The global approach is aimed at aligning the whole sequences together, whereas the objective of the local approach is to find several local alignments. A local alignment is an alignment of regions of sequences. The scoring system produces a score that is a value describing
algorithms are two different approaches for pairwise alignment where the former is designed for global alignment and the latter for local alignment.
Figure 3 is a small part of the multiple alignment for the major human prion protein (1QLX). EANVTKEMLVTSCVNATQAANQAEF...SREKQDSKLHQ EANVTKEKFVTSCINATQVANQEEL...SREKQDNKLYQ EANVTKEAFVTGCINATQAANQGEF...QKPDNKLHQ DRSVPEGRFVRDCLNNTVTEYKIDP...NENQNVTQVEV S.PVPQDVFVADCFNITVTEYSIGPAAKKNTSEAVAAANQTEVEMEN QYS.SQNNFVHDCVNITVKQHTTT...TTTKG..ENFTETDI QYN.NQNNFVHDCVNITIKQHTVTT...TTKG..ENFTETDI
Figure 3 Part of the multiple alignment for the major human prion protein (1QLX).
Multiple alignment is concerned with aligning multiple sequences and is an essential tool in molecular biology as stated in Thompson, et al. (1994, p 4673). It can be used to find diagnostic patterns that characterise protein families, detect or demonstrate homology between new sequences and existing families, and to help predict the secondary and tertiary structures of new sequences. There are two main approaches in multiple alignment, simultaneous and stepwise methods. Simultaneous methods are generalisations of pairwise alignment and therefore inherit the limitations that it may only handle very few sequences, due to the exponential growth in complexity as the number of sequences grows. Stepwise methods on the other hand use the fact that sequences are possible to align with alignments and alignments with other alignments, hence the name stepwise. Refined stepwise methods also use weights to prevent unwanted alignments (Thompson, et al. 1994, p 4673), Clustal W is one of those methods.
2.2 Classification methods
Sequence alignment, described above, only has the ability to represent commonalities based on that columns in the alignment contain the same letter. I.e. it cannot represent conserved mutations, such as the amino acids I, L, V which sometimes are considered equal. That is what makes sequence alignment different than other approaches which have the ability to represent commonalities in a more flexible way, such approaches are described below.
2.2.1 Patterns
A pattern is a regular expression encoding constraints on the contents of amino acids in a protein sequence (Olsson and Laurio, 2001, p 2). To illustrate the syntax of the PROSITE patterns a pattern taken from the paper written by Olsson and Laurio (2001, p 2) follows:
“…-x(0,2)-[YSA]-x(0,1)-[VFY]-x-C-x(1,2)-[PG]-x(0,1)-H-X(2,4)-…”
A translation to English of this section extracted from the pattern would be; …zero to two arbitrary letters, followed by the letter Y, S or A, followed by zero or one arbitrary letter, followed by the letter V, F orY”, and so on. The complexity, or the amount of information, that the pattern includes varies a lot from pattern to pattern, e.g. a pattern like
[AC]-x
would definitely hold far less information than the pattern included in the quotation above, because any sequence containing with the letter A or C followed by at least one letter would match this pattern. A potential method for evaluation might therefore be based on the amount of information of the pattern, see section 2.4.2. It is easy to realise that the possibility for an incorrect match with the latter pattern [AC]- x is highly probable whereas an incorrect match with the former pattern …-x(0,2)-… is less probable. A pattern containing more information is more likely to have less false matches (due to the idea that a longer pattern is more complex), this imply that information content might be used as an approximation of the amount of incorrect matches and therefore used when eva luating patterns. This approach only has good performance when the functional regions in the sequences are well conserved, but how is weakly conserved regions to be handled? That is where the concepts of profiles and weighted matrices are used. It is believed that attempts to build patterns for weakly conserved regions will fail to match sufficiently many sequences that contain the correct region, but in these cases Hidden Markov Models perform better. The different parts of a pattern will further in this project be referred to as components, i.e. in the small
2.2.2 Hidden Markov Models
A hidden Markov model is a statistical model (Krogh, 1999, p 3) aimed at capturing statistical properties as weak similarities and “fuzzy” information, which is not possible to represent using standard patterns. Hidden Markov models are mostly used in molecular biology to (from a family of protein sequences) produce a profile which is used for searching databases for other members of that family. The obvious advantage with hidden Markov models is their ability to model families with very low similarity better than other approaches. A profile HMM models similarities of a protein family and is a statistical model which is trained on the sequences in that family. Profile HMMs are often used to identify different kinds of protein domains from multiple alignments. A protein sequence can be aligned to an HMM using dynamic programming to find its most probable path through the states. The logarithm of this probability over the probability of a random model gives the score of the match.
The approaches described above have some main differences.
• A pattern might represent a single motif, and in those cases several patterns are sometimes needed to be able to represent an entire protein family. But it is also possible to build patterns from multiple motifs.
• Markov models can represent multiple motifs, Markov model can therefore represent an entire protein family
2.3 Protein family classification
In this section an overview of the classification techniques PROSITE, MAMA, PRINTS and Pfam will follow. Each approach has its own strengths and weaknesses, therefore a combination of different approaches might be suitable in many cases.
2.3.1 PROSITE
PROSITE is a database to be used when identifying what protein, and the function of that particular protein, a specific sequence represents (Hofmann, et al. 1999, p 215).
“It consists of a database of patterns and profiles constructed in such a way that with the right tools it can easily determine to which protein family the new sequence belongs.”
Sometimes the new, unknown sequence is too distantly related to any protein family in the database so that no match within the sequence can be found, due to the fact that the database does not contain the corresponding pattern. An approach in such cases is to try to find certain regions in the sequence that matches some pattern.
Generally the PROSITE developers start by studying reviews on a protein family, for which they build an alignment. New relevant sequences might be added to the alignment. By using such alignments they claim that they pay particular attention to the residues and regions which are thought to be important for the biological function. Next they try to find short, about 4 to 5 residues long, conserved sequences which are parts of regions known to be important. These segments are called core patterns. If the core pattern detects all proteins it is supposed to and almost no incorrect, the core pattern can be used as a bona fide signature. Most of the times the core pattern detects proteins it is not supposed to, which means that they need to increase the number of components in the pattern (Bairoch, 2002). This procedure continues until the pattern stops matching incorrect proteins. Matching is done by testing the pattern against the sequence database.
As stated earlier most approaches use patterns and try to match the sequences to these patterns. Falquet, et al. (2002, p 235) discuss five leading concepts they claim influences PROSITE. First they discuss the term completeness:
“For such a compilation to be helpful in the determination of protein function, it is important that it contains as many biologically meaningful patterns and profiles as possible.”
Therefore regularity of updates is vital. With “…as many biologically meaningful..:” they mean that all families, functionally important sites, binding sites are available, but that is not the case today. The fact that PROSITE contains as many biologically meaningful patterns as possible might imply that they pay less attention to patterns that are less biologically meaningful but still important. Second, high specificity:
“In the majority of cases we have chosen patterns or profiles that are specific enough that they do not detect too many unrelated sequences, yet they will detect most, if not all, sequences that clearly belong to the set in consideration. ”
The third claim concerns documentation, each pattern entry is fully documented and includes an informative description of the protein family (or other functional site) it is supposed to detect. Controls are periodically performed to ensure that all entries are valid, and is referred to as periodic reviewing which is the fourth claim. A very close
relationship with the SWISS-PROT protein sequence databank (Bairoch and Apweiler,
2000, p 45) is the fifth claim. Updates of the SWISS-PROT database and the PROSITE database are often performed in parallel, thus not completely synchronous.
The PROSITE database contains one entry for each pattern and one entry for each family. To each entry information about functionality, cross references to entries from other family classifiers, etc. is included. This is a reduced version of the entry for the pattern HIPIP which is a high potential iron-sulfur proteins signature.
ID HIPIP; PATTERN. AC PS00596;
DT DEC-1991 (CREATED); NOV-1995 (DATA UPDATE); JUL-1998 (INFO UPDATE).
DE High potential iron-sulfur proteins signature. PA C-x(6,9)-[LIVM]-x(3)-G-[YW]-C-x(2)-[FYW]. NR /RELEASE=38,80000;
NR /TOTAL=16(16); /POSITIVE=16(16); /UNKNOWN=0(0); /FALSE_POS=0(0); NR /FALSE_NEG=0; /PARTIAL=0; CC /TAXO-RANGE=???P?; /MAX-REPEAT=1; CC /SITE=1,iron_sulfur; /SITE=7,iron_sulfur; DR P04168, HPI1_ECTHA, T; P38941, HPI1_ECTVA, T; DR P38524, HPI2_ECTVA, T; P00262, HPIS_CHRGR, T; DR P00260, HPIS_CHRVI, T; P00264, HPIS_PARSP, T; DR P00265, HPIS_RHOGE, T; P38589, HPIS_RHOGL, T; DR P00263, HPIS_THIPF, T; P00261, HPIS_THIRO, T; DR P50500, IRO_THIFE , T;
3D 2HIP; 1PIH; 1PIJ; 1HPI; 1HIP; 1HRQ; 1HRR; 1NEH; 1NOE; 1B0Y; 1ISU; DO PDOC00515;
The interpretation of the most important prefixes are: • ID, id of the pattern.
• AC, accession number for PROSITE. • PA, the pattern itself.
We have found out through browsing the World Wide Web that several research groups, both academic and commercial, have developed computer tools to make use of the patterns stored in the PROSITE database such as Interpro (Apweiler et. al, 2001). There are not so many tools available that make use of the profiles stored in the same database, though two are described in Falquet, et al. (2002, p 237). Via the web based interface the PROSITE database can be searched for patterns matching an “unknown” sequence and information about available patterns can be downloaded.
PROSITE is, according to Falquet et al. (2002), by far the most comprehensive and most complete pattern database and it is therefore not very hard to understand why most protein family classification tools, such as Interpro (Apweiler et. al, 2001), relate in one way or another to the PROSITE database. PROSITE is available at http://www.expasy.org/prosite/.
2.3.2 MAMA
MAMA (Motif- finding by Analysis of Multiple Alignments) is a system for automatic identification of motifs and creation of patterns that represent protein families (Olsson and Laurio, 2001, p 1). The MAMA database consists of approximately 900 protein families, corresponding to PROSITE and Pfam (se section 2.3.4) families.
Average specificity and sensitivity measures (see section 3.5, table 1) for MAMA patterns is 0.966 and 0.948 for PROSITE and average sensitivity is 0.992 and 0.956. This might be one of the reasons making it interesting to do some further comparison between MAMA and PROSITE with another measurement besides sensitivity and specificity combined with a test set. The task to run tests with other data sets besides those used during training is therefore one basis for testing the hypothesis, proposed in section 4.1, in this project.
This figure is an illustration showing the different steps in the MAMA method, adapted from the Olsson and Laurio (1998, p 169).
PFAM SWISS-PROT GTALCVHFBCU--AH GTL-CV--BCD--AH G-TLCV-BCDEE-AH --TLCV--BCD--AH C-x(2,4)-C C-V-x(1,3)-C C-V-x(1,3)-C-x(2,4)-H C-V-x(0,2)-B-C-x(2,4)-H C-V-x(0,2)-B-C-x(1,3)-A-H G-x(2,3)-C-V-x(0,2)-B-C-x(1,3)-A-H NTRQAALIKEYRKKIEDELSDICHDVLSVLEKHLIPAA NTAQVELIKEYRQKIEQELDTICQDILTVLEKHLIPNA GEDKLKMIREYRQMVETELKLICCDILDVLDKHLIPAA NDVNAKRIKEYRHKVETELSNICIDVMRVIDEHLIPSA NEDHVNTIKEYRSKIEADLSKICDGILSLLESNLIPSA NEEHVNSIREYRSKIENELSKICDGILKLLDSKLIPSA NDEHVSLVKDYRSKVESELSSVCSGILKLLDSHLIPSA NTQRVELIKTYRAKIEQELSQKCDDVLKIITEFLLKNS NDKHVEIIKGYRAKIEKELSTCCDDVLKVIQENLLPKA SDKKLQLIKDYREKVESELRSICTTVLELLDKYLIANA NDKRQQMAREYREKVETELQDICKDVLDLLDRFLVPNA SARKQQLAREYRERVEKELREICYEVLGLLDKYLIPKA SEKKQQLAKEYRVKVEQELNDICQDVLKLLDEFLIVKA NEKKLEKVKAYREKIEKELETVCNDVLALLDKFLIKNC SEEKGPEVREYREKVETELQGVCDTVLGLLDSHLIKEA
Selecting the most general pattern minimizing the number of false positives Count number of false hits Seed alignment Analysis of multiple alignment creating regular expressions
Entropy profile Candidate patterns
Figure 4 Overview of the MAMA method, adapted from Olsson and Laurio (1998, p 169).
First a seed alignment which is a multiple alignment is taken from Pfam. And when building a pattern from an alignment MAMA selects the columns in the order of increasing relative entropy, starting with the lowest (Olsson and Laurio, 2001, p 4). The relative entropy is calculated using the estimated frequency of each amino acid. For each column, a component representing the amino acids appearing in that particular column is added, also referred to as a regular expression. From all these regular expressions the one is chosen that is the most general with the fewest number of false positives, according to test against sequences from SWISS-PROT.
One of the biggest differences between PROSITE and MAMA is that MAMA uses information from multiple motifs for each family whereas PROSITE uses a single motif in each pattern.
2.3.3 PRINTS
The PRINTS database contains a large collection of protein family fingerprints (Attwood, et al. 2000, p 225). A fingerprint is a group of motifs that together are diagnostically more potent than matching with single motifs. Today around 1200 fingerprints are stored in the PRINTS database. The motifs stored in the PRINTS database are often referred to as fingerprints, and fingerprinting concerns manual
encoded as ungapped local alignments. The procedure of creating fingerprints is rather similar to the procedure of creating regular expressions. In this approach, starting from a small initial multiple alignment, conserved motifs are identified manually for the database searching. First it is determined which sequences match the motifs. If there are no more matches other than those in the initial alignment the information from the sequences is added to the motif. This procedure is repeated until no new matches are found (Attwood and Parry-Smith, 1999, p 53).
See http://www.biochem.ucl.ac.uk/bsm/dbbrowser/PRINTS/printscontents.html for example entries.
The need for a reliable method for detecting members of large protein super- families gave birth to PRINTS-S. PRINTS-S also creates fingerprints for those super- families. Its objective was to exploit the most conserved regions to build diagnostic signatures of family membership. PRINTS-S’s ability to tolerate mismatches at the level of single residues within motifs and at the leve l of motifs within fingerprints makes fingerprinting a powerful diagnostic approach.
The data source for PRINTS is OWL (Bleasby, et al. 1994, p3574), which is a non-redundant sequence database, but PRINTS-S also derives data from SWISS-PROT/TrEMBL.
An easy way to access PRINTS-S is via the World Wide Web, which enables traditional searching, but also more complex queries. PRINTS-S is available at http://www.bioinf.man.ac.uk/dbbrowser/PRINTS/.
2.3.4 Pfam
Pfam is a database consisting of multiple alignments of different kinds of protein domains (Bateman, et al. 2000, p 3) and profile hidden Markov models for identifying these domains. It also contains an informative description of the functionality, literature references and some database links for each family. Two multiple alignments are stored for the Pfam family, i.e. the seed alignment that contains a relatively small number of representatives from the family and the full alignment which contains all family members in the database that can be detected by profile HMM.
Profile HMM has been used both for constructing Pfam and for detecting matches to Pfam families in database sequences. The main objective with Pfam was to construct a seed alignment for each family, from a non-redundant representative set of full length
is manually controlled. From the alignment the HMM was built and the HMM is then used to find new members to that particular family (Sonnhammer, et al. 1997, p 408). Pfam- B is an automatically generated supplement to traditional Pfam which provides better coverage and has provided a valuable resource for Pfam families.
Pfam is available on the World Wide Web at http://www.sanger.ac.uk/Software/Pfam/, http://www.cgr.ki.se/Pfam/ and http://pfam.wustl.edu/.
2.4 Pattern discovery tools
As this project concerns evaluation of patterns a brief description of two well-known methods for creating these patterns will follow. This is mainly to show that there are many various ways to create patterns, thus the need to evaluate the created patterns. In section 2.4.2 the method Pratt will be described, this method uses knowledge of information content of patterns when creating them. This way of calculating information content will be adapted later in the project as a part of the new evaluation method. Focus on this project will be on evaluating MAMA and PROSITE, but the aim is that the method is applicable on other similar methods for protein classification. Currently there are a number of tools and methods available in the area of protein pattern construction. Pattern discovery concerns the task of identifying regularities, commonalities and repetitive regions in sequences that represents its vital parts. In some approaches measuring of information content is considered, this might possibly be used as a notion of the possibility for an incorrect match to that pattern. A pattern including more information is less probable to be matched by an incorrect sequence than a pattern with less information.
2.4.1 EMOTIF
EMOTIF is a database consisting of 170 000 protein sequence motifs that represent biological properties and functions (Huang and Brutlag, 2001, p 202). The motifs are derived from sequences stored in the BLOCKS+ database and the PRINTS database using the algorithm EMOTIF-MAKER. According to Huang and Brutlag, (2001) the EMOTIF-MAKER approach allows the use of multiple motifs to create patterns unlike some other methods that only use one motif.
As input EMOTIF-MAKER takes a multiple alignment. The output is a graphical display of possible motifs, which represents the allowable amino acids for certain positions. A small number of sets that corresponds to some biological property are
permitted instead of permitting an arbitrary set of amino acids in each position. Because it limits the space of the motifs and ensures correct biochemical interpretations (Nevill-Manning, et al. 1997, p 202). Due to the fact that, as stated earlier, the sequences used to create the patterns are stored in the BLOCKS+ database and the PRINTS database, any update of these databases will imply an update of the EMOTIF database.
A way to access the EMOTIF database is via the World Wide Web at http://motif.stanford.edu/emotif/.
2.4.2 Pratt
Pratt is a method for identification of patterns in unaligned protein sequences (Jonassen, et al. 1995, p 1587) which is able to discover patterns conforming to the PROSITE notation. It is possible to specify which class (defined by Jonassen et al. 1995, p 1587) of pattern to discover and the method guarantees to find the pattern within the specified class with the highest score. A class is defined by stating constraints for the pattern, considering the length and number of gaps. The algorithm explores a search tree which is spanning the specified class of patterns. Next it reports the identified conserved patterns which score the highest according to a defined pattern scoring function and rejects those with a negative score. Classification is done by using a classifier function (Brazma, et al. 1995, p 5) which returns true for sequence members of the particular family tested, else false.
According to Jonassen (1997, p 1) the aim of the approach is to discover the most informative pattern that matches a specified minimum number of sequences.
The developers of Pratt have also come up with a pattern scoring function to (be able to) rank the patterns produced by Pratt (Jonassen 1997, p 6). This scoring function calculates the highest score for the pattern believed to include the most information I(P), this is done by using the following formula:
∑
= − ⋅∑
=− −= ip I Ai c kp jk ik P
I( ) 1 '( ) 11( ) (1)
where c is a constant (normally c = 0.5 is used), p is the length of the pattern, jk and ik are numbers of arbitrary symbols. The part right of the “- “ is used to calculate the penalty of flexible wildcards. The left part is used to calculate the score of the other
elements. I’(Ai) is the information content of the pattern component Ai, and is calculated using: )) log( ( )) log( ( ) ( ' i pA a p i pA a p A a a p a p a i A I i ⋅ ∈ + ⋅ ∑ ∈ − =
∑
∑
(2)where pa is the prior probability of amino acid a, ∑ is the set of all amino acids, and
a A a
p
p
i i A ∈∑
=
. To calculate the probabilities pa the frequency of each amino acid a ina protein sequence database is used. The left part sums the frequencies of all the amino acids in the element. The right part adds a number based on the frequency of one amino acid compared to the others in the same element. With this formula the amount of information in a specific pattern is calculated (Jonassen 1997). This knowledge can be used to make a judgment of the likelihood of incorrect matches to that specific pattern, more information may result in lower probability of incorrect matches.
3 Evaluation methods
As this project is focused on evaluating patterns it is important to know which evaluation methods are available today. Evaluation methods are, as the name implies, concerned with evaluation of results from different methods and approaches, it is preferable that the evaluation presents a performance measure that is as objective as possible. Due to the fact that pattern methods differ a lot it is very important to find a way to compare the patterns. Possible evaluation methods can be found in the area of Artificial Intelligence, from where holdout, cross- validation and bootstrap have been chosen. After descriptions of those methods a description of a benchmarking approach for multiple alignment tools will follow and last a description of how the developers of PROSITE evaluates.
3.1 Holdout
The basic idea with the holdout approach is to divide the original data set into two parts, the training set, approximately 2/3 of the original data set, and the test set, the remaining 1/3 (Kohavi, 1995, p 2).
To be able to describe holdout and cross-validation any deeper, two concepts need to be defined according to Kohavi, (1995, p 1):
“A classifier is a function that maps an unlabelled instance to a label using internal data structures. An inducer [..] builds a classifier from a given data set.”
For example, a pattern collection is a classifier that maps sequences to patterns and EMOTIF-MAKER is an example inducer that builds a pattern collection from sequences in BLOCKS. First the inducer builds a classifier by using the data set, then that inducer is tested using the test set, and the accuracy of the holdout is estimated using the following formula
(
,)
( ( , ), ) 1 i y i v t D I D y v h h acc h i i δ∑
∈ = (3)where Dh, the holdout set, is a subset of D of size h, Dt is D\Dh, δ(i,j) = 1 if i = j and
otherwise 0, I is the inducer and yi is an unlabelled instance of vi. According to Kohavi,
(1995, p 2).
“It is correct to assume that the accuracy of the inducer increases as more instances are seen, thus the more instances left for the test set the higher the bias of our estimate gets.”
One problem with holdout is that it does not use the data efficiently, i.e. it does not make use of the whole data set for training the inducer, which may be problematic when data is not abundant. For further details see Kohavi (1995, p 2).
3.2 Cross-validation
In cross-validation the original data set is split into k exclusive sub sets D1, D2…Dk
(Kohavi, 1995, p 2). These sub sets are then used to train and test the inducer k times. The accuracy of cross- validation is the overall number of correct classifications of the test set, divided by the number of instances in the test set, and is calculated using the following formula: ) ), , ) ( \ ( ( , 1 i y i v i D D I D y v n cv acc i i δ
∑
∈ = (4)where D(i) is the test set including the instances xi = (vi, yi) of the data set and n is the
size of the data set. Cross-validation differs from the holdout approach and the advantage of this approach is that it matters less how the data is divided. Every subset is tested once and is included in the training set k-1 times. The advantage is that it matters less how the data is divided. The disadvantage is that the training algorithm has to be run from scratch k times, thus almost k times as much computation is required to make an evaluation.
3.3 Bootstrapping
Efron and Tibshirani, (1995, p 3) discusses bootstrapping as a method with probably better performance than cross- validation. Bootstrapping is in its basic form about
repeatedly analysing sample of data, where each sample is randomly collected. Instead of repeatedly analysing sub sets of data. The difference between a sample and a sub set is according to Kohavi (1995, p3) that a sample is much smaller. In this approach accuracy is calculated using this formula (Kohavi, 1995, p 3):
∑
= ⋅ + ∈ ⋅ = b i s acc i b boot acc 1 ) 368 . 0 0 632 . 0 ( 1 (5)where b is the number of bootstrap samples, ∈0i is the accuracy of the bootstrap sample
i where the ∈0 accuracy estimate is derived by using the bootstrap sample for training
and the rest of the instances for testing. accs is the resubstitution accuracy estimated on
the full data set. The coefficients 0.368 and 0.632 were suggested by an argument based on the fact that bootstrap samples are supported on approximately 0.632n of the original data set (Efron and Tibshirani, 1995, p 10). For further explanation see Kohavi (1995, p 3). Bootstrap is according to Kohavi (1995, p 3) a close approximation of the real world but can be shown to fail by adding a memorizer module and adjusting the predictions of the inducer. Such adjustments might also change the overall accuracy in any direction wanted.
3.4 Benchmarking tools
As stated earlier this work is about building a benchmark for testing the performance of different protein family classification tools. Unfortunately are there no published materials on benchmarks for evaluation of patterns. Therefore a brief description of a benchmark for multiple alignment tools will be presented, as this benchmark is the closest related benchmark available. A benchmark is a method for comparing other methods objectively.
3.4.1 Benchmarking multiple alignment tools
Thompson, et al. (1999, p 2682) present the first systematic evaluation study of commonly used multiple alignment approaches using the BAliBASE benchmark. As the multiple alignment of protein sequences has become an important tool in molecular biology, the need for being able to benchmark them has grown. There are several different approaches for creating good alignments. To assure a mathematically optimal
computer resources. This fact is one of the reasons for the introduction of heuristic methods. Thompson, et al. (1999, p 2683) have made a schematic overview of the different alignment approaches.
To be able to compare the 10 approaches described in Thompson, et al. (1999) objective criteria were needed, and the BAliBASE benchmark alignment database contains 142 reference alignments in five hierarchical reference sets which contain at least 12 alignments. These five reference sets are (Thompson, et al. 1999, p 2683):
• Reference 1 alignments consists of a small number of equidistant sequences of similar length and with different degree of homology.
• Reference 2 contains alignments of a family (closely related sequences with >25% ID), plus up to three ‘orphan’ sequences (distant members of the family with <20% ID, sharing a common fold). It is designed to evaluate program accuracy according to two criteria: (i) the stability of the family alignment when orphans are introduced into the sequence set; (ii) the quality of the alignment of the orphan seque nce.
• Reference 3 demonstrates the ability of the program to correctly align equidistant divergent families into a single alignment.
• Reference 4 and 5 contain sequences with large N/C-terminal extensions or internal insertions, respectively
Two different scores are calculated to measure the performance of the programs (Thompson, et al. 1999, p 2684), the sum-of-pairs score (SPS) which is increases with the number of sequences correctly aligned. It is used to determine the extent to which the programs succeed in aligning some of the sequences in an alignment. The column score (CS) is a binary score which tests the ability of the program to align all of the sequences correctly.
A statistical method was also applied in the benchmark (Thompson, et al. 1999, p 2684), represented by a number of representative alignments to be used to sample statistical analyses. A score of accuracy was also calculated for each reference alignment. For more information on the results see the paper written by Thompson, et al. (1999).
Conclusions drawn from these approaches are that an adequate benchmark should at least include these two approaches,
• A type of classification of the data set, in the paper written by Thompson, et al. (1999, p 2683) referred to as reference sets.
• A measurement of the performance of the method. Performance of the methods is important due to the need of comparing different methods.
• An interest in gathering statistical information, that allows another type of comparison between the methods.
3.5 PROSITE’s evaluation methods
According to Falquet, et al. (2002, p 235) two related metrics are used to ensure accuracy using the PROSITE method, sensitivity and specificity. Sensitivity is about matching correct sequences to a certain pattern, and specificity is about excluding incorrect sequences to patterns.
The way they calculate these measures is by using the concept of false positives, false
negatives, true positives and true negatives. The calculation itself is described by the
table below.
True result Positive Negative
Test Positive TP FP Sensitivity = TP/(TP+FN)
result negative FN TN Specificity = TP/(TP+FP)
Table 1 Calculation of sensitivity and specificity.
This is the only performance estimation presented by the developers of PROSITE (Falquet, et al. 2002, p 235), therefore the question arises whether or not it is enough considering the approaches described above, i.e. holdout, cross- validation or bootstrap. When these values are calculated for PROSITE the same sequences are used both as train and test set, i.e. they do not use any type of holdout. This approach results in very high sensitivity and specificity, up to 100 %. Probably will these numbers differ when an independent test set is applied as the hypothesis of this project claims. The fact that no independent test set has been used arises the issue concerning whether or not the numbers presented by the developers of PROSITE can be generalised.
Other types of criticisms are aimed at the fact that sensitivity and specificity is not concerning the number of sequences used to create the pattern. A pattern built on many
sequences. As patterns built on many sequences are aimed at matching more sequences. A pattern built on fewer sequences is more specific, because it should only match a small number of sequences. This implies that specificity depends on the number of sequences used for creation. This fact is not taken into consideration in this project either, due to the extensive work of modify the calculation of accuracy with respect to the fact just mentioned.
To illustrate these facts some examples will follow, which are downloaded from the PROSITE web site, www.expasy.ch/prosite/.
The first example is a pattern entry for a g-protein coupled receptors family 1 signature, with accession number PS00237. According to this entry the sensitivity is 94.29 % and specificity is 90.42 %, Sensitivity is often called recall and specificity called precision. These percentages are rather usual for PROSITE patterns.
Entry name G_PROTEIN_RECEP_F1_1
Accession
number PS00237
Entry type PATTERN Date
APR-1990 (CREATED); NOV-1997 (DATA UPDATE); JUL-1998 (INFO UPDATE).
PROSITE
documentation PDOC00210
Name and characterization of the entry
Description G-protein coupled receptors family 1 signature.
Pattern
[GSTALIVMFYWC] -[GSTANCPDE]-{EDPKRH}-x(2)-[LIVMNQGA]-x(2)-[LIVMFT]- [GSTANC]-[LIVMFYWSTAC] -[DENH]-R-[FYWCSH]-x(2)-[LIVM].
Numerical results
SWISS-PROT release number: 40.7, total number of sequence entries in that release:
103373.
Total number of hits in SWISS-PROT: 1121 hits in 1121 different sequences
Number of hits on proteins that are known to belong to the set under consideration: 1057
hits in 1057 different sequences
Number of hits on proteins that could potentially belong to the set under consideration: 0
hits in 0 different sequences
Number of false hits (on unrelated proteins): 64 hits in 64 different sequences Number of known missed hits: 112
Number of partial sequences which belong to the set under consideration, but which are not hit by the pattern or profile because they are partial (fragment) sequences: 48
Precision (true hits / (true hits + false positives)): 94.29 % Recall (true hits / (true hits + false negatives)): 90.42 %
The second example is the entry for a cytochrome c family heme-binding site signature, with accession number PS00190. What is interesting with this entry is the fact that the percentage on sensitivity is as low as 43.11%, specificity is 98.79 %. Further the entry says that the number of hits on proteins that are known to belong to the set under consideration for this pattern is 488 hits in 345 different sequences, that the number of false hits is 644 hits in 593 different hits and the number of known missed hits, 6.
The last entry is a AAA-protein family signature, with accession number PS00674. This pattern has a high sensitivity value – 100%, specificity 98.86 %. Further the entry says that the number of hits on proteins that are known to belong to the set under consideration for this pattern is 154 in 139 different sequences, which the number of false hits is 0 and the number of known missed hits is 5.
It is likely that the high averages on sensitivity (MAMA 0.966, PROSITE 0.948) and specificity (MAMA 0.992, PROSITE 0.956) is due to using the same data set for both training and testing. The fact that no holdout (or any other evaluation method described in section 3) is used might be a reason to investigate if an independent test set reduces average sensitivity and specificity. One drawback with the whole concept of sensitivity and specificity might be that there are two different measures. If an entry shows 50% sensitivity and 75% specificity and a second entry shows 75% sensitivity and 50% specificity, which entry represents the best pattern? Anyway, sometimes several measurements are preferred. Perhaps patterns wit h high specificity are required, independent of their sensitivity.
4 Problem description
The problem description and the aims and objectives that will characterise this work will be discussed separately in the following sections.
4.1 Aims
The main aim is to test and possibly improve present methods for measuring accuracy of classification methods that use patterns. These possibly improved measures are to be suitable for comparison of accuracy between different methods.
Currently there are no available adequate approaches (except perhaps sensitivity and specificity). Hence there is a need to construct one possibly considering correlation, accuracy and/or weight of evidence. Neither are there any acknowledged comparisons between protein family classification tools. The only statistics available are those produced by the developers of the classification tool itself, which mainly focuses on sensitivity and specificity. The fact that there are no published comparisons between the classification tools is the most important reason for performing this work.
Two different methods of measuring pattern accuracy are to be taken into consideration. The first is the empirical method which produces calculations of sensitivity and specificity. The second is more theoretical and uses the pattern scoring function described in Jonassen (1997, p 6). One of the aims in this project is to achieve a combination of two methods. A part of this aim is to find out whether or not the pattern scoring function could be used to predict sensitivity and specificity, hence removing the need of testing. Another aim is to present an overall score for the pattern collections MAMA and PROSITE enabling comparison. Finally results from applying this modified method will be presented. In summary the aims are:
1) Evaluating accuracy and information content (in section 5.5). 2) Evaluating independent test sets (in section 5.8).
3) Evaluating pattern collections (in section 5.9).
4.2 Hypotheses
hypotheses in this project are that an independent test set results in lower sensitivity and specificity values than when using the same data as training and test set. Other hypotheses that are to be tested are whether or not the information content, which is calculated using the pattern scoring function (Jonassen 1997, p 6), has any relation to sensitivity and/or specificity. Maybe sensitivity increases and specificity decreases with information content. If this is the case it might be a reason for investigating other approaches for testing the applicability of the patterns. These are the four hypotheses to be tested in this project:
1) Sensitivity decreases with information content. 2) Specificity increases with information content.
3) An independent test set reduces sensitivity compared to testing with the training set.
4) An independent test set reduces specificity compared to testing with the training set.
The hypotheses are falsified if it is shown that:
1) Sensitivity increases with information content. 2) Specificity decreases with information content.
3) An independent test set increases sensitivity compared to testing with the training set.
4) An independent test set increases specificity compared to testing with the training set.
4.3 Objectives
The objectives which are of importance to be able to achieve all the aims are:
1) Ensuring that both pattern collections contain patterns representing the same families. This objective is important because it ensures that a fair comparison between PROSITE and MAMA is conducted. Otherwise it is possible to only use patterns with good performance from one collection and patterns with worse performance from the other and in that way direct the results.
2) Identifying the most recent sequences and from these choosing suitable test sets. This objective is important because it ensures that as few as possible sequences where used during training of the patterns. If patterns are tested on the training sequences they are not really tested.
3) Implementing routines for matching patterns with sequences and calculation of accuracy. This objective is important because it enables automation of matching and calculation which is essential when testing hypothesis 3 and 4. As hundreds of patterns are to be matched against thousands of sequences other methods except automated once are completely unthinkable
In addition, these objectives are vital for the 1st aim:
4) Identifying a documented method for calculation of information content and implement ing corresponding routines (and perhaps modifying the method to better handle patterns using multiple motifs).
5) Comparing accuracy and information content in a way that is easy to grasp. This objective is very important because it is from this conclusions considering hypothesis 1 and 2 can be made.
No other objectives besides objective 1-3 are needed to be able to achieve the 2nd aim. These objectives are vital for the 3rd aim:
6) Constructing a classification system for the different matches and the corresponding implementation.
7) Developing an overall score formula based of the match classification system. 8) Evaluating classification according to the match classification system and
5 Data sets, experiments, methods and tools
The following sections are descriptions of the most important parts of the work performed during this project. The first section (section 5.1) describes the different data sets used in the project. Next, in section 5.2, the experiments are described. And section 5.3 is explaining why the evaluation method used was chosen. Section 5.4 describes the tool for testing the patterns against sequences.
5.1 Data sets
The data sets concerned in this project can be divided into two sub categories, protein patterns and sequences. Two different sets of protein patterns are used containing patterns representing the same 839 families, PROSITE v 16.0 released July 1999 and MAMA (see objective 1). To ensure that the same families were represented in both sets, those contained in only one set were deleted. Therefore 177 protein patterns were not regarded from PROSITE v 16.0 and 76 from MAMA. These sets will be referred to as PROSITE_pat and MAMA_pat. MAMA was chosen because it is a method that uses the same pattern notation as PROSITE. PROSITE was chosen due to various reasons, mainly because it is assumed to be used by several researchers. A comparison between MAMA and PRINTS might have been more fair, but the differences when measuring accuracy between MAMA and PRINTS were considered to big, as both does not use similar patterns. Anyhow, it does not seem that any comparison between two methods can be entirely fair.
Sequences were extracted from two different sources, the main source was SWISS-PROT from which three sets where derived. First the sequences from the full version 40 of SWISS-PROT released October 2001, which contained 101 602 sequences. This set will be referred to as SWISS_full. It was chosen because a large amount of sequences was needed when combining accuracy with information content (see e.g. hypotheses 1 and 2) and the need for statistically safe calculations. Secondly a new_seq.dat file dated May 16th 2002 which only includes sequences from updates until that date, 7409 sequences. This will be referred to as SWISS_new. Thirdly sequences from the new_seq.dat file containing a reference to the Protein Data Bank, because these sequences are believed to be well examined due to their corresponding PDB-entry, 43 sequences. This will be referred to as SWISS_new_pdb. Sequences in the Protein Data
The second source for sequences was the Protein Data Bank itself, from which the 236 entries added during the period February 1st to May 23rd 2002 where extracted. These sequences where also believed to be very reliable due to the fact just mentioned, and will be referred to as PDB_recent. The Protein Data Bank is a collection of 3D structures of proteins, today (August 7th 2002) containing 18 412 structures. The sets SWISS_ne w, SWISS_new_pdb and PDB_recent were chosen with the second aim in mind.
These four sequence sets are chosen for two reasons, SWISS_full is chosen to enable calculation of sensitivity and specificity which is the first reason. If too few sequences are used when matching, the calculation of sensitivity and specificity would be nearly binary because of the few matches. Therefore this set is used when comparing sensitivity and specificity with information content. The second reason is the need of an independent test set, therefore the sets SWISS_new, SWISS_new_pdb and PDB_recent were chosen. These three sets are dated approximately two years later then PROSITE v 16.0, and might therefore not have been used during training of the PROSITE patterns and therefore serve holdout sets. These sets are to be used when calculating the overall accuracy of the pattern collections.
The last set is not really one single set, since it consists of the sets resulting from matching Pfam with the different sequence sets. These sets are derived from the sequence files from SWISS-PROT which contain references to Pfam and are thus considered to be correct, an from testing PDB_recent against Pfam. Therefore this set is used as a reference and will be referred to as Pfam_ref. This usage of a reference set deals with the problem of determining the accuracy of the matches which is essential in this project. Table 3 summaries the different sets.
As SWISS-PROT was the main source from which sequences were taken, there is a chance that the some sequences are present in multiple sequence sets. This fact are not taken into consideration when evaluating the patterns. That is, identical and/or homologous sequences are all included in the test sets, none are removed.
Set Description fam./seq.
PROSITE_pat PROSITE v 16.0 patterns, July 1999. 839
MAMA_pat MAMA patterns. 839
SWISS_full SWISS-PROT v 40 sequences, October 2001 101 602 SWISS_new SWISS-PROT new_seq.dat sequences, May 16th
2002.
7409 SWISS_new_pdb SWISS PROT new_seq.dat, PDB referenced
sequences, May 16th 2002.
43 PDB_recent Protein Data Bank sequences from entries added,
February 1st to May 23rd 2002.
236 Pfam_ref Pfam references from SWISS-PROT files and
matching PDB_recent with Pfam.
-Table 3 Data sets.
5.2 Experiments
Several experiments are conducted in this project. The first has the protein patterns as starting point and shows which seque nces matches a specific pattern, this is described in section 6.1. This experiment is the basis for calculation of sensitivity and specificity and relates to hypothesis 2. It enables calculation of sensitivity and specificity with the aid of the reference set which is essential when comparing sensitivity and specificity with information content. In addition to sensitivity and specificity information content is also calculated in the experiment described in section 6.2. In this experiment the constant c, see equations 1 and 2, was varied. This because it was through manual computation discovered that a lower value than 0.5, proposed by Jonassen, et al. (1995), handles patterns with long flexible wildcards better. A modified version of the formula for calculation of information content (equation 1 and 2, section 2.4.2) was used in the experiment described in section 6.3. Both the experiments in section 6.2 and 6.3 deal with hypotheses 1 and 2 and aim 1, because they are about combining sensitivity and specificity (empirical knowledge) and information content (theoretical knowledge). The experiments involved calculation of sensitivity, specificity and information content. Table 4 sums up the different experiments to be conducted.
Experiment Test set SN & SP Info. Info.eq.
Section 6.1 SWISS_full yes no
-Section 6.2 SWISS_full yes yes orig. Section 6.3 SWISS_full yes yes mod.
Table 4 Experiments in section 6.1 – 6.3.
Further experiments were conducted with the patterns as starting point, these concern hypotheses 1 and 2 and aim 2 i.e. if an independent test set reduces sensitivity and specificity. The task is to calculate average sensitivity and specificity using several independent test sets and compare the results with already documented results using non- independent test sets. The results from these experiments are presented in section 6.4.
Finally experiments with the sequences as starting point were conducted which also included a classification of the different matches, section 6.5. In this experiment the matches was evaluated according to our match classification system, instead of sensitivity and specificity. Table 5 summarises the experiments described in section 6.5. These experiments deal with aim 3, which is about calculating an overall score for pattern collections.
Experiment Test set
Section 6.5.1 SWISS_new Section 6.5.2 SWISS_new_pdb Section 6.5.3 PDB_recent
Table 5 Experiments in sections 6.5.1 – 6.5.3.
5.3 Evaluation method of choice
Of the evaluation methods described in section 3, holdout (section 3.1) is the one concerned here. The training set is the sequences in SWISS-PROT and the independent test set contains sequences from other sources, in this case the Protein Data Bank. The other methods cross-validation and bootstrap, in sections 3.2 and 3.3, are not possible to use due to the need of creating new patterns when using either of them. Creating patterns is far to time consuming to be a part in this project. It is in fact impossible to
5.4 Tools
As described in the section about patterns, a pattern is a type of regular expressio n, and these are easily interpreted by computer software. A suitable tool is therefore the Perl script programming language, which has an in built interpreter for regular expressions. A pattern translated into the Perl regular expression style is then easily, in a one- line command, compared to an amino acid sequence. The pattern:
[AC]-x-V-x(4)-{ED}
is translated to the Perl version, which is:
[AC].V.{4}[^ED]
The basic ideas for the scripts comparing patterns with amino acid sequences were taken from a tutorial written by Tisdall (2001). The task of comparing a pattern with an amino acid sequence is fundamental in this project due to the fact that the whole project is concerned with “measuring” how good a pattern is at matching the sequences it is supposed to match. (The versions of Perl used in this project are 5.6.0 built for sun4-solaris and version 5.6.1 built for MSWin32-x86- multi-thread which is distributed by ActiveState.)
6 Results
The following sections (6.1 – 6.5) presents the results from the different experiments.
6.1 Evaluating accuracy and information content
First a script, based on the Tisdall (2001) tutorial, was written which takes two files as input, the first containing several patterns written using the PROSITE notation for patterns and the second containing several sequences. The output was a report containing the pattern ID followed by the IDs of matching sequences.
Initially the evaluation of this report was to be performed by comparing IDs with the cross reference information contained in the sequence file. The information in the sequence file was unfortunately not complete, i.e. it did not hold all known cross reference information. Instead a sample from the output was taken and manually tested at ScanProsite (Falquet, et al. 2002, p 237) to ensure that the script was working.
Two different sets of patterns (PROSITE_pat and MAMA_pat) where tested using this script, PROSITE version 16.0 patterns and MAMA patterns, on sequences from the SWISS-PROT version 40 database. These sets of patterns contain their own patterns for the same 839 protein families.
To ensure that the same families were represented in both the PROSITE and MAMA collection, the IDs in PROSITE were translated to the same as those in MAMA. The IDs were translated because the MAMA and the Pfam IDs are the same and Pfam was used as a reference. The mapping of the IDs was done by using the unique PDOC number which is stored both in PROSITE and Pfam.
An important difference between PROSITE and MAMA that needed to be taken into consideration at this stage is that PROSITE may consist of multiple patterns for the same family whereas MAMA consists of single patterns for families. Therefore multiple patterns were assigned to the same ID in PROSITE when translated. Average sensitivity and specificity was calculated for the families with identical IDs.
The next step was to reduce the collections to only consist of the same patterns, i.e. the 839. This was done by simply comparing the IDs and removing those not present in the other collection and vice versa.
The result from running the script with MAMA and a sequence file (SWISS_full) is shown in the histogram in figure 5 describing the number of matching sequences for 20 arbitrarily chosen patterns.
81 49 22 20 39 40 989 59 23 17 138 23 465 26 39 93 10 34 10 12 0 100 200 300 400 500 600 700 800 900 1000 14-3-3; 2-Hacid_DH; 3HCDH; 5_nucleotidase; 6PF2K; 6PGD; 7tm_1; 7tm_2; 7tm_3; A2M; AAA; ABC2_membrane; ABC_tran; ACBP; ALAD; AMP-binding; ANF_receptor; ANP; APH; AP_endonucleas1; Number of matches
Figure 5 The number of sequences matching the different patterns. The patterns are 20 patterns from the
MAMA pattern collection and the sequences are from SWISS_full.
After matching both collections with the same sequences the next task was to compare their performance. To be able to tell if a match is true or false or if any matches are missing a reference result file, consisting of the Pfam results in the sequence file, is created. With the information concerning the number of true positives, false positives, true negatives and false negatives sensitivity and specificity can be calculated.
These plots in figures 6 and 7 illustrate the differences in sensitivity and specificity between PROSITE and MAMA. Each diamond represents a family and its sensitivity/specificity for PROSITE and MAMA. The line in figure 6 (proposed by the calculator as a suitable linear equation) shows the linearity which is also shown by the equation. The concentration of the diamonds is much higher when comparing specificity than when comparing specificity.
y = 0.8703x + 6.6468 0 10 20 30 40 50 60 70 80 90 100 0 20 40 60 80 100 MAMA sensitivity PROSITE 16.0 sensitivity
Figure 6 Comparison of sensitivity between MAMA and PROSITE patterns matched with SWISS_full
(correlation 0.89). y = 0.8765x + 6.4788 0 10 20 30 40 50 60 70 80 90 100 0 20 40 60 80 100 MAMA specificity PROSITE 16.0 specificity
Figure 7 Comparison of specificity between MAMA and PROSITE patterns matched with SWISS_full