IMPORTANCE OF END-OF-LIFE COST FOR A
PRODUCT LIFE CYCLE IN THE CHOICE
BETWEEN COPPER AND ALUMINIUM
Bo Carlsson
School of Natural Sciences, Linnaeus University, Sweden
ABSTRACT
A total cost accounting approach was used to analyse the suitability of copper and aluminium as winding material for transformers, using available data from the Ecoinvent database. It could be concluded that the use of recycled metal is a necessary requisite for sustainability. Using cost data for energy and materials and reasonable assumptions about costs for labour and interest for the metal supplier and the product manufacturer, the copper alternative turns out to be the better choice, especially when the expected increase in the prices of energy, copper, and aluminium during life cycle is taken into account.
When considering environmental cost, useful indicators are those that can be expressed in cost terms. With the Ecoindicator 99 indicator as the basis for estimating environmental cost, the aluminium alternative is better than the copper alternative. However, the contribution of the environmental cost to the total cost has minor importance when compared with the effect you get from the negative cost contribution from the end-of-life phase. Therefore, the copper alternative is the better choice in terms of least total cost in the application considered.
From the study it could also be concluded that the total cost accounting approach would be a valuable design tool, when comparing two design alternatives of a product functional unit to decide which of the two is the more favourable from a sustainability point of view.
KEYWORDS
Product life cycle, Total cost accounting, Sustainability, Life cycle analysis, Life cycle cost assessment, End-of-life cost, Product design, Material selection
1 INTRODUCTION
Sustainable growth has become the ultimate goal for all kinds of future development, at least in a political sense, but considering its meaning, the picture is quite diverse: (a) meeting the needs of the present without compromising the ability of future generations to meet their own needs (WCED, 1987) [1], (b) improving the quality of human life while living within the carrying capacity of supporting ecosystems (IUCN, 1991) [2], and (c) economic growth that provides fairness and opportunity for all the world’s peoples, not just the privileged few, without further destroying the world’s finite natural resources and carrying capacity (Pronk & Haq, 1992) [3]. Definitions such as these are not particularly clear from a scientific point of view, and for concrete decisions concerning sustainability it is necessary to have more explicit measures.
From the viewpoint of how sustainable a given product or process is, Bakshi and Fiksel have proposed the following perhaps more useful definition: A sustainable product or process is the
one that constrains resource consumption and waste generation to an acceptable level, makes a positive contribution to the satisfaction of humans needs, and provides enduring economic value to the business enterprise [4]. A product can also be seen as a form of produced capital, which is an essential element in the definition of sustainable development made by the Joint UNECE/OECD/Eurostat Working Group on Statistics for Sustainable Development (2008): Sustainable development ensures non-declining per capita national wealth by replacing or conserving the sources of that wealth; that is, stocks of produced, human, social, and natural capital [5].
In a recent study the question how the degree of sustainability of a product life cycle can best be measured was addressed [6]. The main question was how to take into account simultaneously the functional and environmental quality aspects, and also the economic dimensions of the concept of sustainability.
The total cost accounting approach, which was employed for the purpose of product design in some recent studies by Carlsson et al. [7,8,9], takes into account all those aspects and was therefore considered most suitable especially when taking into account the definition of sustainability made by Bakshi and Fiksel [4].
The total cost accounting approach uses the end-user or consumer perspective and the ecological long-term view as a basis for compiling the contributions from all the various factors that might be important to the life cycle of a functional unit of a product. The point of departure is not a particular design alternative of the functional unit and its life cycle, but its intended function over time. When adopting the total cost, it is, however, not the absolute value of the total cost that is of main interest, but the difference in the total cost between two design alternatives of the functional unit of the product considered.
If one design alternative of the functional unit is chosen as reference, the model to be adopted can be described as follows:
For a fixed service time, τs, the difference in total cost (CRT) associated with maintaining a
specific function defined for the functional unit is estimated from
CRT = CRP + CRNIP + CRO&M + CRF + CREoL + CRE + CRD (1),
where CRP = difference in production cost between the two design alternatives; CRNIP =
difference in cost associated with initial non-ideal function or performance between the two design alternatives; CRO&M = difference in operation and maintenance cost between the two
design alternatives; CRF = difference in cost of probable failures and damage between the two
design alternatives; CREoL = difference in end-of-life cost between the two design alternatives;
CRE = difference in environmental cost associated with probable ecological damage between
the two design alternatives, and CRD = difference in development cost between the two design
alternatives.
Specifying function is the starting point for setting up performance requirements of the functional unit, based on end-user and product considerations. From the performance requirements the two different design alternatives to be compared are defined in terms of a variety of properties and their cost characteristics are evaluated.
However, detailed guidance on how the different cost terms contributing to the total cost of a specific design alternative for a functional unit are assessed, falls outside the scope of the
present paper, and the reader is referred to the previous work by Carlsson et al. [7] and Carlsson [8,9].
2 ANALYSIS OF THE EFFECT OF REPEATED METAL RECYCLING IN DESIGN OF PRODUCT LIFE CYCLES
For the purpose of comparing and discussing the effect of repeated metal recycling, the suitability of using either copper or aluminium as winding material in a transformer was analysed. Comparison was made under assumption that the resistance losses in the metallic winding strips should be the same. Thus, to compensate for the higher electrical resistivity of metallic aluminium compared to metallic copper, the cross-sectional area of the aluminium strips was assumed to be 1.64 times larger compared to that of the metallic copper strips. This meant that 1 kg of metallic copper corresponded to 0.5 kg of aluminium, taking into account the different densities of the two conductor strips. The two kinds of conductor strips were assumed to be insulated in the same way, although the transformer with aluminium would be larger compared to the transformer with copper winding.
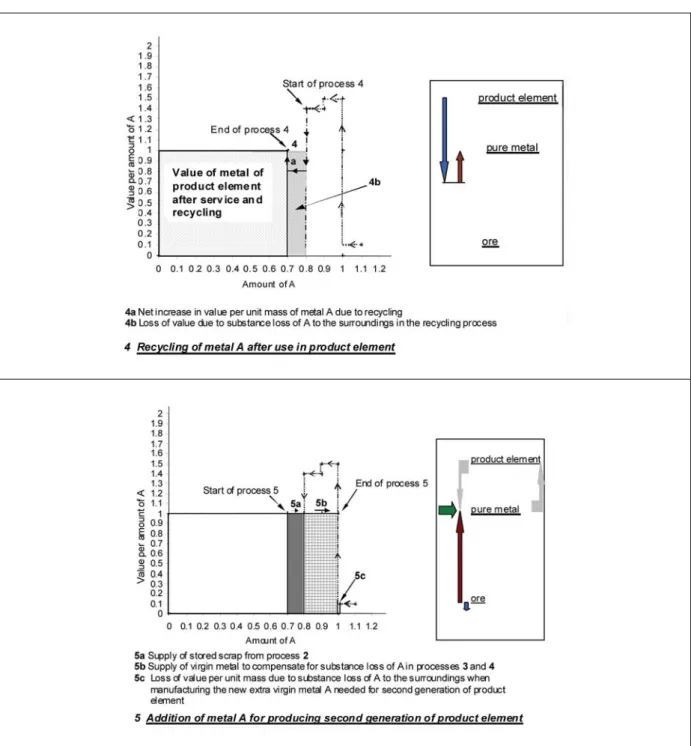
The product or product element life cycle studied is schematically shown in Figure 1. After the end-of-life phase of the product element manufactured with primary metal, it was assumed that this product element would be replaced by a second generation of product element. This was manufactured, to the extent possible, from recycled metal from the first product element cycle. The product element life cycle, therefore, was composed of the following steps:
Step 1: Manufacturing of pure metal A from ore containing A
Step 2: Manufacturing of the product element composed of pure metal A Step 3: Product element composed of pure metal A during its service life Step 4: Recycling of metal A after use in product element
Step 5: Addition of compensatory metal for producing second generation of product element By designing the product element life cycle this way, the amount of metal that could be conserved for further use by recycling could be distinguished. It was then possible to analyse in more detail the amount of metal that was lost by non-ideal processes involved in the product element life cycle.
In terms of the total cost model previously described, steps 1 and 2 constitute the production phase and are to be related to production cost and cost of initial non-ideal performance. The service phase described by step 3 is to be related to operation and maintenance costs and costs for probable failures. Both step 4 and step 5 belong to the end-of-life phase. Cost of probable environmental damage can be split up into three parts related to the production phase, service phase, and end-of-life phase.
In the analysis, environmental data originated by Althaus and given in the Ecoinvent database of the SimaPro 7 LCA software tool [10], were used. The data representing production of primary metal, production of secondary metal, and sheet rolling of copper and aluminium were used. Information on metal prices was obtained mainly from the London Metal Exchange [11]; see also [6].
Figure 1 Principle sketch of the product element life cycle studied, comprising the following steps: Step 1: Manufacturing of pure metal A from ore containing A; Step 2: Manufacturing of product element; Step 3: Product element during its service life;Step 4: Recycling of metal A after use in product element; Step 5: Addition of compensatory metal A for production of second generation of product element
As the point of departure for a simple economic analysis, the metallic conductor strips were assumed to be manufactured by sheet rolling from rods of pure metal. All economic and environmental data were related to the production of 1 kg metallic copper conductor strips. Thus, in the case of the corresponding metallic aluminium conductor strips, all data were related to 0.5 kg aluminium. In terms of year 2009 cost data, the cost of metallic copper strips installed in the transformer per unit mass of copper was thereafter set at $13.80 (All amounts in US dollars). In this cost $7.20 constituted the cost of metallic copper and the cost of energy estimated as described in [6]. The remaining $6.60 was assumed to cover expenses for labour, interest, and other costs. The service the transformer fulfilled during its life cycle and which
could be allocated to the metallic copper strips, was assumed to represent a value of $20.70 per unit mass of copper.
This service value was also assumed to be the same for the aluminium winding strips in the other kind of transformer. But, the price of the metallic conductor strips was here set at $10.90 per 0.5 kg aluminium or unit mass of copper. The sum of the cost of the metallic aluminium and the energy needed to produce the strips was in this case estimated to be $1.05; see [6].
Thus, the prices for the installed conductor strips differed by about 20% between the two kinds of transformers. In the case of the copper-based transformer winding, the cost of material for the conductor strips for the product element manufacturer was 52% of the production cost. In the case of the aluminium-based transformer, this cost was 9% of the production cost. However, the assumptions made about the economics of the intended application for the two kinds of metals were just made arbitrarily. The main purpose of the analysis was to illustrate more qualitatively than quantitatively the difference in the product characteristics between the two kinds of transformers.
3 RESULTS AND DISCUSSION
When analysing the pattern of material flows contained in product element life cycles, the situation is quite complex. Metal may be produced and exchanged between different parties during the product element life cycle; metal may be conserved and even lost. Material losses of copper and aluminium to the surroundings arise from non-ideal performance of manufacturing processes for primary metal. Losses also occur due to lack of durability of metals during service and end-of-life phase of product element, and of non-ideal performance of recycling metals. All such processes thus contribute to reducing the extent of sustainability of product element life cycles.
However, repeated recycling of metal is a necessary requisite to obtain product element life cycles with a high degree of sustainability. With the data from the Ecoinvent database, it seems possible to obtain metal mass efficiencies of 88% for the product element life cycles in the case of copper, and 97% in the case of aluminium. In terms of cumulative energy demand, the second generation life cycle with copper winding requires 50 MJ per unit mass of copper, while the corresponding value for the aluminium case is 21 MJ.
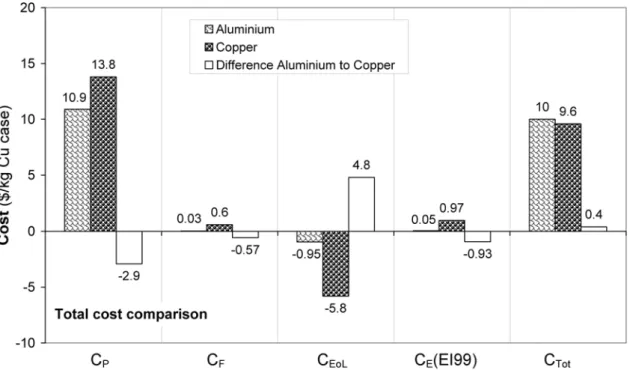
The total costs for the two metallic conductor design alternatives were calculated by applying equation (1) and the result is shown in Figure 2.
When determining the dimensions of the metallic conductor strips, the difference in electric conductivity between copper and aluminium was taken into account, so that heat losses during use of the metallic conductors would be the same. As a consequence, the cost term for initial non-ideal performance, CNIP, was excluded in the analysis, because it has the same value for
the two design alternatives. For the cost of operation and maintenance, CO&M, the same
assumption was made. When evaluating the cost of probable failures, CF, it was first assumed
that the life-limiting factor for the two alternatives was the durability of the insulation of the transformers. As a consequence, service life would be the same for both. However, using the Ecoinvent data, it was not possible to distinguish between degradation of the metal strips during use, degradation of the scrap metal after use, and non-ideal behaviour of the recycling process in terms of material loss. Therefore, only the sum of the contributions from those processes could be estimated. In the present analysis, this sum is shown as cost of probable
failures, CF. Cost of development, CRD, was not considered of particular interest for this study,
and was therefore excluded.
Figure 2. Comparison of the total cost of the metallic copper conductor transformer and the aluminium conductor transformer, using the modified Ecoindicator 99 cost indicator, see text below, and cost data for year 2009. For other notations related to the terms of the total cost expression, see equation (1).
In estimating the cost of probable environmental damage, CE, the main difficulty was
selecting the most relevant indicator and translating and expressing this indicator in cost terms. Of those taken into account in a previous study [6], Ecoindicator 99 [12] was recommended as most suitable when considering its time perspective and Ecoindicator 99’s ability to take into account not only environmental damages related to natural resources, but also to human health and to ecosystem quality.
For translating the Ecoindicator 99 value into cost, the following assumptions were made following the recommendation made in [6]. In the Ecoindicator 99 method the damage to natural resources is measured in terms of surplus energy. This is defined as the difference in the energy needed to extract a resource now and at some point in the future. Based upon the suggestion made by Müller-Wenk (1998), the future surplus energy is calculated at Q·N. The quantity Q represents the total amount that has been extracted by humans before 1990, and N represents the number of times this amount has been extracted. In the SimaPro 7 software, data for damage to resources are given in energy terms for the case N = 5 [12], and this reference point was considered reasonable for the purpose of the present analysis. To convert this energy value into cost, the electric energy price valid for the year 2009 was used. To convert the contribution from the other damage categories of Ecoindicator 99 into cost, an analogy was made to the previously described case of damage to natural resources. For a single score, the environmental impact value derived by the Ecoindicator 99 method is given in points, Pt. Thus, the ratio between the value in Pt and the corresponding surplus energy
value was first calculated. This factor was then used to convert the Pt values for the other damage categories, human health and ecosystem quality into energy units. Then they were transformed into cost units, using the same procedure as described for the damage category resources.
The results illustrated in Figure 2 indicate that metallic copper is a better alternative to metallic aluminium in terms of total cost of the application considered. How different cost terms contribute to the total costs is illustrated in Figure 3 for the copper conductor transformer and in Figure 4 for the aluminium conductor transformer. The category waste shown in the figures may denote costs associated with ore material lost to the surroundings (see CP), and with metal lost due to oxidation or non-ideal recycling (see CF). The category
waste also includes environmental costs associated with damage to human health and ecosystem quality (see CE (EI99)).
Figure 3. Contributions to the total cost of the metallic copper conductor using the modified Ecoindicator 99 cost indicator and cost data for year 2009. For other notations related to the terms of the total cost expression, see equation (1)
Figure 4. Contributions to the total cost of the metallic aluminium conductor using the modified Ecoindicator 99 cost indicator and cost data for year 2009 For other notations related to the terms of the total cost expression, see equation (1).
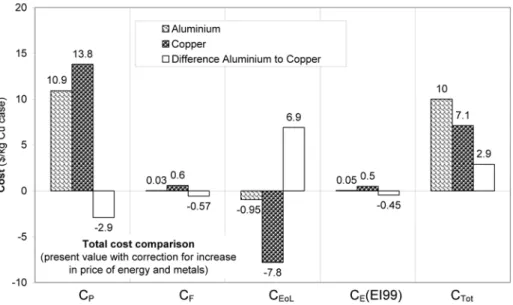
However, there is a time span between initial and final stage of product element life cycle that may influence cost characteristics. Therefore, present value costs related to the initial phase of the life cycle were calculated by employing methods commonly used in life cycle cost analysis (see e.g. [13]). The results are presented in Figure 5 and as shown the difference in total cost between the two design alternatives is increased. The copper alternative is more favourable to the aluminium alternative to an even larger extent than shown in Figure 2. Consequently investing in copper would be more profitable compared to investing in aluminium in terms of residual value.
Figure 5. Comparison in present-value-corrected total cost between the metallic copper conductor transformer and the aluminium conductor transformer, assuming 10-year lifetime, an interest rate of 8% per year, increase in price of energy of 10% per year in constant dollar value, of metallic copper equal to 11% per year in constant dollar value, and of metallic aluminium equal to 8% per year in constant dollar value .As in Figure 5 the modified Ecoindicator 99 cost indicator is used and cost data for year 2009. For other notations related to the terms of the total cost expression, see equation (1).
4 CONCLUSIONS
Repeated recycling of metal is a necessary requisite to obtain product element life cycles with a high degree of sustainability.
When adopting the total cost accounting approach in assessing suitability of the two kinds of winding material, the outcome depends on costs other than those of materials and energy. To such belong costs for labour and interest for the metal supplier and the product manufacturer. With reasonable assumptions about those, it could be concluded that in terms of production cost the aluminium alternative would be the more favourable. This is also true when considering costs associated with the service phase.
However, in terms of end-of-life cost the situation would be the opposite, and contributing to this fact is, above all, the much higher price of recycled copper compared to that of recycled aluminium. This situation is even more pronounced when costs are converted to present value costs and the expected increase in the prices of energy, copper, and aluminium during life cycle is taken into account.
From the study, it can also be concluded that with the Ecoindicator 99 indicator as the basis for estimating environmental cost, the aluminium alternative would be better than the copper alternative from an environmental impact point of view. But, the contribution of environmental cost to the total cost is relatively small when compared with the end-of-life cost. Therefore, the copper alternative is the better choice in terms of least total cost.
From the study it can also be concluded that the total cost accounting approach would be a valuable tool for assessing the degree of sustainability of a product life cycle, in particular,
regarding use of natural abiotic resources such as metals. The main advantage of the total cost accounting approach as a design tool, however, is when comparing two design alternatives of a product functional unit to decide which of the two is the more favourable.
5 ACKNOWLEDGEMENT
This work has been financed by Linnaeus University, which we gratefully acknowledge.
6 REFERENCES
[1] World Commission on Environment and Development (WCED). (1987). Our Common
Future. Oxford: Oxford University Press
[2] International Union for the Conservation of Nature. (1991). Caring for the Earth: A Strategy for Sustainable Living. With the United Nations Environment Program and the World Wildlife Fund. Gland, Switzerland: IUCN.
[3] Pronk, J. & Haque, M. (1992). Sustainable Development: From Concept to Action. The Hague Report. New York: United Nations Development Program.
[4] Bakshi, B. R., & Fiksel, J. (2003). The quest for sustainability challenges for process systems engineering, AIChE Journal, 49, 1350–1358.
[5] Joint UNECE/OECD/Eurostat Working Group on Statistics for Sustainable Development. (2008). Measuring sustainable development. Report. New York and Geneva: United Nations.
[6] Carlsson, B., 2010. Total cost as suitable indicator in realization of more sustainable product life cycles regarding utilization of natural abiotic resources. Journal of
Sustainable Development, Volume 3, No 3, Sept.
[7] Carlsson, B., Taylor, D., Hogland, W., Marques, M., et al. (2007). Design of functional units for products by a total cost accounting approach, VINNOVA Report VR 2007:1. Stockholm: VINNOVA.
[8] Carlsson, B. (2007). Suitability analysis of selective solar absorber surfaces based on a total cost accounting approach. Solar Energy Materials and Solar Cells, 91, 1338–1349. [9] Carlsson, B. (2009). Selecting material for the exterior panel of a private car back door by adopting a total cost accounting approach. Journal of Materials and Design, 30, 826. [10] Ecoinvent database. (2009). In LCA software SimaPro 7 (see www.pre.nl/simapro). In
the Ecoinvent database reference in given to work by Hans-Jörg Althaus, Swiss Federal Laboratories for Materials Testing and Research (EMPA).
[11] London Metal Exchange. (2009). [Online] Available: http://www.metalprices.com [12] Goedkoop, M. & Spriensma, R. (1999). Eco-indicator 99 Methodology Report. [Online]
Available: http://www.pre.nl/eco-indicator99/ei99-reports.htm (May 22, 2010). [13] Fuller, S. & Petersen, S. (1996). NIST Handbook 135: Life Cycle Costing Manual for
the Federal Energy Management Program. Washington: U.S. Government Printing