Kalmar ECO-TECH '05 and
The Second Baltic Symposium on Environmental Chemistry KALMAR, SWEDEN, November 28-30, 2005
KINETICS OF PHENOL DEGRADATION BY
SELECTED BACTERIAL STRAINS WITH
DIFFERENT GENETIC PROPERTIES
Signe Viggor
Eeva Heinaru
Jaak Truu
Ain Heinaru
University of Tartu, Estonia
ABSTRACTThe major environmental problem in the northeastern Estonia is the semi-coke mounds in oil shale industry areas, Alternatives to the chemical methods (sorption, ozonation) for removing xenobiotic compounds from leachate are biological methods, like bioaugmentation, where the properly selected microorganisms are used. Determination of the kinetic constants (maximum specific growth rates (µmax), lag times (A.), half saturation constants (Kso for oxygenating activity and Ksa for growth) and inhibition constants (Ki)) will give us information about the rate of pollutant degradation and is the basis for the selection of the most effective bacteria for bioaugmentation. In phenol degradation the initial and rate-limiting enzyme is phenol hydroxylase, encoded by different genes, The aim of this work was to carry out a kinetic study of the aerobic degradation of phenol using single strains (Pseudomonas mendocina PC 1, P. fluorescens PC 18, PC20 and PC24) isolated from river water continuously polluted with phenolic compounds, The strains PC 1 and PC 18 contain genes for multicomponent phenol hydroxylase, whereas single-component phenol hydroxylase (pheBA operon) characterizes the strains PC20 and PC24, The phenol-oxygenating activity (Kso) was obtained from substrate-dependent oxygen uptake data (oxygen concentrations were measured with a Clark-type oxygen electrode) using Michaelis-Mentens model. Specific growth rates µ and lag times). were calculated from absorbance growth curves on phenol concentrations 0,2-10.6 mM and the growth kinetic constants (µmax,
Ksa,
Ki) were estimated using Haldanes, Edwards and Aiba-Edwards model. The Kso values for phenol were one order of magnitude lower in strains PC 1 and PC 18 than in strains PC20 and PC24.KEYWORDS
Phenol; Biodegradation; Pseudomonads; Growth kinetics; Phenol hydroxylase 1 INTRODUCTION
Phenol and phenolic compounds are widespread in biosphere as components of the complex polymer lignin, as humic acids, and as common constituents of aqueous effluents from industrial processes, including oil refineries, petrochemical plants, coal conversion processes, phenolic resin industries and pharmaceutical industries, Wastes containing phenols and other
KALMAR, SWEDEN, November 28-30, 2005
toxic compounds require careful treatment. Several methods with different removal performances and cost level are available, but commonly used are adsorption, chemical oxidation and biological treatment processes. Biological treatment methods have been shown to be economical and they lead to complete mineralization of phenols. Both aerobic and anaerobic treatments of aromatic pollutants by using pure microorganisms or mixed cultures have been applied. The capacity of a microbial population to degrade pollutants within an environmental matrix can be enhanced either by stimulation of indigenous microorganisms by addition of nutrients (biostimulation) or by the introduction of specific microorganisms to the local microbial community (bioaugmentation) [l]. Therefore, examination of biodegradation efficiency of bacterial strains isolated from continuously polluted sites is of great interest. In phenol degradation by aerobic bacteria, the aromatic ring is initially monohydroxylated by phenol 2-monooxygenase (ECl.14.13.7) at a position ortho to the pre-existing hydroxyl group. Two types of phenol hydroxylases, the single-component (PMO) and multi-component (mPH) type, are known. Ring cleavages of the resulting catechol, catalyzed by a specific dioxygenase, can occur either between the hydroxyl groups (thus initiating the ortho pathway that leads to cis,cis-muconate) or at the adjacent bond (thus initiating the me/a-pathway that leads to 2-hydroxy-cis,cis-muconate semialdehyde) [2]. mPHs are classified into two groups according to the genetic organization of the operons - dmp type [3] and mop type [4] - linked to the genes for meta pathway catechol 2,3- dioxygenase (C23O) or ortho pathway catechol
1,2-dioxygenase (Cl2O), respectively.
A wide diversity of phenol-degrading bacteria (Bera- and Gammaproteobacteria) harboring PMO or mPH have been isolated from natural and engineered environments. The phenol hydroxylases, from which dmp-type mPHs are found to be dominant in natural environments [SJ, determine the rate of phenol degradation pathway [6]. Prediction of the biodegradation efficiency is important to have knowledge of microbial growth and substrate utilization kinetics. It has been reported previously that kinetic analysis of phenol-oxygenating activity is useful for comparing the phenotypes of phenol-degrading bacteria [7]. Same workgroup showed later that phylogenetic grouping of the DNA fragment encoding the largest subunit of the mPH (LmPH) correlates with the physiological groupings based on whole cell kinetics of phenol-oxygenating activity of the studied bacteria [8]. But Zhang er al. suggested that there is no such correlation due to extensive horizontal gene transfer of this functional gene (9]. The aim of this research was to investigate the representative bacterial strains isolated from river water continuously polluted with phenolic compounds. The kinetic data (maximum specific growth rates - µmax, lag times - A, half saturation constants (Kso for oxygenating activity and Ksc for growth) and inhibition constants - K1) of four selected Pseudomonas strains, which have different genetic properties ( different phenol degradation pathways, different enzymes) will give us information about the rate of pollutant degradation and is the basis for the selection of the most effective bacterial strains for bioaugmentation. The leachate- and oil-shale oil-amended laboratory batch experiments showed that these bacteria can survive in such extreme environments [JO].
2 MATERIALS AND METHODS 2.1 Bacterial strains and growth medium
The Pseudomonas mendocina strain PC I and the Pseudomonas fluorescens strains PC 18, PC20 and PC24 are the representatives of different catabolic types - they degrade phenol and p-cresol via me/a-mera, mera-orrho, ortho-mela and orlho-ortho pathways, respectively. The strains PCJ and PCJ8 contain the genes for mPH, whereas PMO (pheBA operon) characterizes the strains PC20 and PC24. The genes for CJ2O are found in the strains PC24
Kalmar ECO-TECH '05 and
The Second Baltic Symposium on Environmental Chemistry KALMAR, SWEDEN, November 28-30, 2005
and PC20 and the genes for C23O in the strains PC I, PC I 8 and PC20 [ 11]. Pure cultures were stored in 30% glycerol at -75a° C. Cells were pregrown on phenol (2.5 mM) minimal medium
(on agar plates or in liquid cultures) until the late exponential phase. The minimal media contains M9-salts [12] and trace elements [13]. The Luria-Bertani (LB) agar plates were used for enumeration of bacteria (CFU/ml) at the beginning of growth kinetics experiments. The dry cell weight of the culture was determined gravimetrically by filtration through a 0.22 µm pore-size membrane filter.
2.2 Growth kinetics experiments
The growth of the studied strains was measured on sterile flat-bottomed 96-wells microtiter plates (Nunc™). Into each well 140 µI of minimal media supplemented with phenol (0.2mM
to 10.6mM) and 10 µI of inocula (-107 CFU/ml) was added. The plates were sealed with
parafilm and incubated on a Titramax 1000 (Heidolph) thermostated shaker table (600 rpm) at 30a° C. To minimize border effects the water baths were also placed on shaker table.
Absorbance was measured by Labsystem Multiskan® MCC/340 microplate autoreader at 492
nm after every 30 minutes. All experiments were run in triplicate. The graphs (absorbances versus cell dry-masses) were constructed for calculations of yield factor.
2.3 Phenol-oxygenating activity experiments
For the determination of oxygen-consumption rate of the pregrown bacterial cells the Clark type oxygen electrode were used. An adequate amount of culture was infused into a cuvette (1.5 ml) of the electrode, which had been pre-stabilized at 30a° C in air-saturated M9 medium
without phenol, and the endogenous oxygen consumption was measured. After the addition of phenol (0.4 to 75 (in case of strain PC20 170) µM) the phenol-oxygenation-dependent oxygen-consumption rate was determined. Phenol-oxygenating activity was found after the subtraction of endogenous oxygen consumption rate from substrate dependent exogenous rate. One unit of the activity was defined as mM of oxygen consumed per minute. The specific activity was defined as the activity per gram of dry cells. Apparent kinetic constants K50 and V max in Michaelis-Mentens equation were determined by a non-linear regression
method.
2.4 Mathematical models
2. 4. J Models for microbial growth on phenol, specific growth rate, yield coefficient and lag time
The specific growth rate (µ) of cultures grown in different initial phenol concentrations was calculated using the following equation:
ln(ABS, I ABS1 ) (I)
µ =
12 -11
where ABS, and ABS2 are absorbances at time t, and t2, respectively.
The Haldanes, Edwards and Aiba-Edwards models were used to describe the inhibition of specific growth rate (µ) by substrate phenol (S):
(3) (2)
µ
s ( s)
µ = � exp -K, (4)
Ksc +S
where µmax is the maximum specific growth rate, S is the initial concentration of phenol, Ksc is the half-saturation constant and K1 is the inhibition constant.
The yield factor (g dry cell/g phenol) for phenol, Y x,s, can be calculated using the following equation:
(5) where XM and X0 are the maximum and initial dry cell concentrations and Cs and Co are substrate concentration at maximum cell concentration and initial substrate concentrations, respectively.
The lag-time (1) of the growth curve was calculated using modified Gompertz model:
(6)
where µ0 is the specific growth rate, A is asymptotic phase, ABS, and ABS0 are absorbances at the time t and 0, respectively.
2. 4. 2 Models for phenol-oxygenating activity
Although phenol is known as inhibitory substrate the Michaelis-Mentens model was used to describe the phenol-oxygenating activity kinetics:
V = Vm.,S
(7) Kso +S
where V is specific activity, V max maximum specific activity, and Kso apparent half saturation constant.
-�·
--• ♦ --• --• ♦ ♦ 04Kalmar ECO-TECH '05 and
The Second Baltic Symposium on Environmental Chemistry KALMAR, SWEDEN, November 28-30, 2005 3 RESULTS AND DISCUSSION
3.1 Effect of initial substrate concentration on cell growth of the strains PCl, PC18, PC20 and PC24
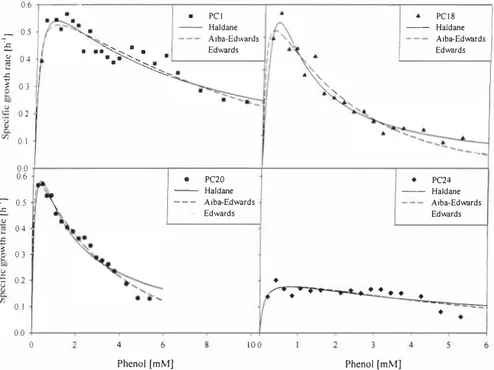
In order to evaluate the kinetic parameters the plots of specific growth rate (µ) versus initial phenol concentration was studied and the results are illustrated in Figure 1. The Haldanes, Edwards and Aiba-Edwards models were used to calculate the kinetic parameters (see Table 1). The Haldanes model is mostly used for modeling the growth kinetics on inhibitory substrate, but in our case it was not the best one, The values of coefficient of determination (R2) were in a range 0.49 to 0,96, 0.52 to 0.98 and 0,54 to 0,98 for Haldanes, Edwards and
Aiba-Edwards models, respectively, All three models gave the worst fit with data of strain PC24, The kinetic parameters calculated from Edwards and Aiba-Edwards models were similar (see Table J),
0.6 PC! PCl8 -- Haldane -- Haldane 05 A iba-Edwards Aiba-Ed\Wrds
�
"
• •• �,.
-.....
■ Edwards Edwards ■.
', 0.4.
'-{
OJ.
''
02 ·u 0.1 0.0 0.6 ■ PC20 ♦ PC24 -- Haldane -- Haldane 0.5 Aiba-Edwards Aiba-Ed\Wrds :.c: Edwards Edwards"
{
0.3 ♦ 'u 0.2"
0.1 ♦ 0.0 0 4 100 Phenol [mM] Phenol [mMJFigure 1. Dependence of the specific growth rate of the strains PCJ (II), PC18 ( ,.), PC20 (•J and PC24 (♦) on the concentration of phenol. (--} Haldane, (----) Aiba-Edwards and (. . .,.) Edwards substrate inhibition equationjifled to experimental data.
Values of the kinetic parameters obtained in this work are comparable with other published data, The maximum specific growth rate has been reported to be in the range of 0, 13-0,36 h"1 for mixed cultures and 0,26-0,9 h"1 for pure cultures. Variation of these values over a wide range has been attributed to cell type and culture environments [ 14], The µmax value of the strain PC24 differs approximately three times from µmax values of the other strains (PC 1, PC 18, PC20) having meta cleavage pathway for metabolization of phenol (see Table 1).
7.44 KALMAR, SWEDEN, November 28-30, 2005
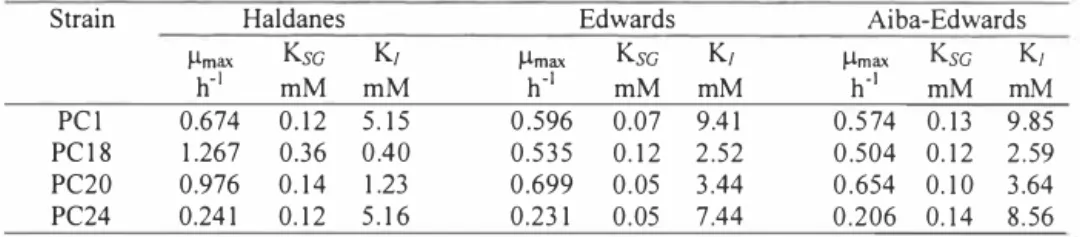
Table I. Growth kinetic parameter/ of Haldanes, Edwards and A iba-Edwards models
Strain Haldanes Edwards Aiba-Edwards
µmax Ksc K1 µmax Ksc K1 µmax Ksc K1 h-1 mM mM h-1 mM mM h.1 mM mM PC! 0.674 0.12 5.15 0.596 0.07 9.41 0.574 0.13 9.85 PCI 8 I .267 0.36 0.40 0.535 0.12 2.52 0.504 0.12 2.59 PC20 0.976 0.14 1.23 0.699 0.05 3.44 0.654 0.10 3.64 PC24 0.241 0.12 5.16 0.231 0.05 0.206 0. 14 8.56
1 values are the averages of triplicate determinations
The apparent half-saturation constants for growth (Ksc) were quite similar, but the coefficients of variation (CV%) were lowest with Aiba-Edwards model. The inhibition constant (K1) values varied more and were the highest in case of the strains PC! and PC24 (see Table I). These results are in good correlation with data presented in Figure 2, where the influence of initial phenol concentration on duration of the lag-phase is shown. The length of the lag-time increased exponentially with phenol concentration as other authors have showed. El-Sayed et al. [15) isolated two bacterial strains from a coking-plant, which were able to grow on phenol concentrations up to 32 mM, but the length of the lag-time was about 13 days. In our experiments the strains PC! degraded 9.6 mM phenol during the 48 hours. Strain PC24 isolated from the water of the ditch surrounding semi-coke hills had a low µamax, but
high K1 values, so the slowly growing bacteria can survive in extreme environments. 30 ■ PC !
•
PC20!
25 A PC 1 86
II) 20•
PC24.§
!
'k
!I
I..:::
15 ti) 1 0 II) ..c:�,
1
tL·
5,q • •
0 0 2 4 6 8 1 0 1 2 Phenol [mM]Figure 2. Relationship between initial phenol concentrations and length of the lag-times. Values are the averages of triplicate determinations and error bars indicate standard deviations.
�
Kalmar ECO-TECH '05 and
The Second Baltic Symposium on Environmental Chemistry
KALMAR, SWEDEN, November 28-30, 2005
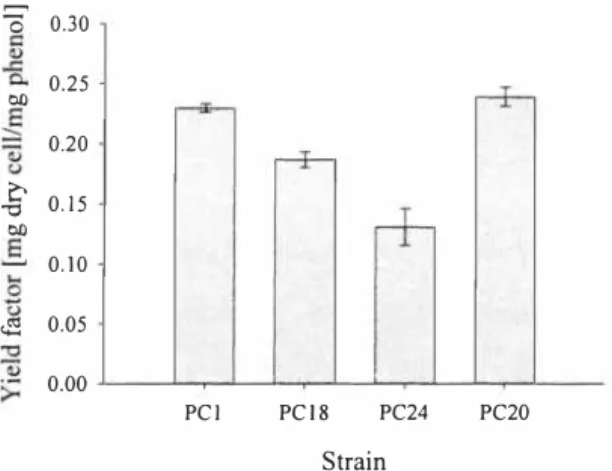
The lowest cell yield factor Y x;s (see Figure 3) was found for the strain PC24, in which catechol is degraded through the ortho-pathway with the accumulation of cis,cis-muconate into the growth medium ( 1 6], In the strain PC20 the accumulation of non-degradable intermediates is avoided through harboring two catechol-cleaving enzymes C I 2O and C23O. Filanov et al, [ I 7] showed that the values of specific growth rates and yield coefficient are lower for Pseudomonas putida strains with functioning ortho-pathway compared to the strains with functioning meta-pathway, which is in good accordance with our results, For use in bioremediation the microorganisms which produce the least yield of biomass per unit of pollutant being degraded, i.e. they exhibit the least yield coefficient, are preferred [17]. The obtained yields were lower than reported in literature (from 0.48 to 0.68 mg dry cell/ mg phenol [ 18)), this can be explained with the use of microtiter plates for growing bacteria instead of agitated flasks. Dalgaard et al. [ 1 9] showed same kind effect for non-fermentative microorganisms, Also the acclimation concentration of phenol can affect the yield values of cultures growing on higher initial concentrations [18],
0 0.30 0,25 Ol) 0,20
c
0. 1 5 -0 Ol) 0, 10�
0.05 0,00 PCl PC / 8 PC24 PC20 StrainFigure 3. Yield factors (mglmg)for phenol of the strains PCJ, PCJ8, PC20 and PC24. Values are the averages of triplicate determinations and error bars indicate standard deviations.
3. 2 Effect of initial substrate concentration on phenol-oxygenating activity of the strains PCl, PC18, PC20 and PC24
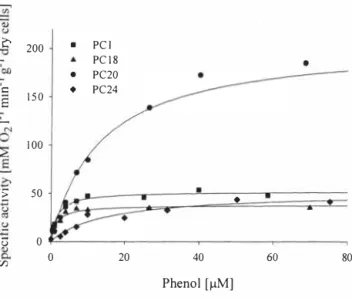
Determination of the bacterial phenol-oxygenation-dependent oxygen consumption rate (phenol-oxygenating activity) was used for estimation of the kinetic parameters of phenol degradation. Figure 4 shows the dependence of phenol-oxygenating activities on the phenol concentration, and Table 2 shows the kinetic constants in Michaelias-Mentens equation that were estimated by using the data in Figure 4, The values of the apparent half-saturation constants (Kso) for phenol were one magnitude lower in strains harboring mPH (PC 1 and PC 18) than in strains having PMO (PC20 and PC24) for phenol degradation. The strain PC20 had 3 times higher V max than other strains (see Table 2),
:�
•
KALMAR, SWEDEN, November 28-30, 2005c
200•
PC I PC I8•
PC20'=
•
PC24'§
150 :,_, 1 00 50·u
0 0 20 40 60 80 VJ Phenol [µM]Figure 4, Specific phenol degrading activities determined at various phenol concentrations for the strains PC! (�, PCJ8 (�), PC20 (•) and PC24 (♦). (---) Michaelis-Mentens
equation fitted to experimental data.
Table 2. Apparent kinetic parameters in Michaelis-Mentens equation for specific phenol oxygenating activity Strain Ymax Kso
µM
PCJ 5 1.87±a1.52 1.67±0.24 PC18 37.78±1.77 1.5a1±0.3a1 PC20 205a.9± 10.84 13.a11±2.53 PC24 5 1.08±5a.63 14,90±4.60 4 CONCLUSIONS• The Pseudomonas strains possessing the meta cleavage pathway for catabolizing phenol (the strains PC 1, PC 18 and PC20) are characterized with higher maximum specific growth rates (µmax), and the strain (PC24) possessing ortho cleavage pathway degrades phenol three times slower.
• The strains using only or tho (PC24) or meta (PC 1) cleavage mechanisms degrade phenol also at higher concentrations (high inhibition constant (K,) values) and the duration of lag-phase in case of these strains depend less on the initial phenol concentration.
Kalmar ECO-TECH '05 and
The Second Bailie Symposium on Environmental Chemistry KALMAR, S WEDEN, November 28-30, 2005
• The value of apparent half-saturation constant (Kso) for phenol is determined by the type of phenol hydroxylases: the strains (PC !, PC18) having genes for multicomponent phenol hydroxylase have lower values than the strains (PC20 and PC24) holding single-component phenol hydroxylase.
ACKNOWLEDGEMENTS
This work was supported by the Institute of Molecular and Cell Biology (University of Tartu) and Estonian Science Foundation Grant 5682.
REFERENCES
[ I ] El Fantroussi, S., Agathos, S.N., 2005. ls bioaugmentation a feasible strategy for pollutant removal and site remediation? Curr. Opin. Microbial. 8, 268-275.
[2] Kieslich, K., Ed., 1986. Biotransformations. Biotechnology, Vol. 6a, Verlag Chemie, Weinheim.
[3] Shingler, V., Powlowski, J., Marklund, U., 1992. Nucleotide sequence and functional analysis of the complete phenol/3,4-dimethylphenol catabolic pathway of Pseudomonas sp. strain CF600. J Bacterial. 174, 711-724.
[4] Ehrt, S., Schirmer, F., Hillen, W., 1995. Genetic organization, nucleotide sequence and regulation of expression of genes encoding phenol hydroxylase and catechol 1,2-dioxygenase in Acinetobacter calcoaceticus NCI88250. Mal. Microbial. 18, 13-20. [5] Watanabe, K., Teramoto, M., Futamata, H., Harayama, S., 1998. Molecular detection,
isolation, and physiological characterization of functionally dominant phenol-degrading bacteria in activated sludge. Appl. Environ. Microbial. 64 (11), 4396-4402.
[6] Shingler, V., Franklin, C.H., Tsuda, M., Holroyd, D., Bagdasarian, M., 1989. Molecular analysis of a plasmid-encoded phenol hydroxylase from Pseudomonas CF600. J Gen. Microbial. 135, l083-1092.
[7] Watanabe, K., Hino, S., Onodera, K., Kajie, S.-I., Takahashi, N., 1996. Diversity in kinetics of bacterial phenol-oxygenating activity. J Ferment. Bioeng. 81 (6), 560-563. (8] Watanabe, K., Futamata, H., Harayama, S., 2002. Understanding the diversity in
catabolic potential of microorganisms for the development of bioremediation strategies. Antonie van Leeuwenhoek 8 I , 655-663.
[9] Zhang, X., Gao, P., Chao, Q., Wang, L., Senior, E., Zhao, L., 2004. Microdiversity of phenol hydroxylase genes among phenol-degrading isolates of Alcaligenes sp. from an activated sludge system. FEMS Microbial. Letters 237, 369-375.
(10] Heinaru, E., Merimaa, M., Viggor, S., Lehiste, M., Leito, I., Truu, J., Heinaru, A., 2005. Biodegradation efficiency of functionally important population selected for bioaugmentation in phenol- and oil-polluted area. FEMS Microbial. Ecol. 51, 363-373. [11] Heinaru, E., Truu, J., Stottmeister, U., Heinaru, A., 2000. Three types of phenol and p
cresol-degrading bacteria isolated from river water continuously polluted with phenolic compounds. FEMS Microbial. Ecol. 31, 195-205.
[12] Adams, M.H., 1959. Bacteriophages. Interscience Publisher, Inc., New York, p. 445-447.
[13] Bauchop, T., Elsden, S.R., 1960. The growth of microorganisms in relation to their energy supply. J. Gen. Microbial. 23, 457-469.
[14] Nuhoglu, A., Yalcin, B., 2005. Modeling of phenol removal in a batch reactor. Process Biochem. 40, 1233-1239.
(15] El-Sayed, W.S., Ibrahim, M.K., Abu-Shady, M., EI-Beih, F., Ohmura, N., Saiki, H., Ando, A., 2003. Isolation and characterization of phenol-catabolizing bacteria from a coking plant. Biosci. Biotechnol. Biochem. 67 (6), 2026-2029.
(16] Heinaru, E., Viggor, S., Vedler, E., Truu, J., Merimaa, M., Heinaru, A., 200 1. Reversible accumulation of p-hydroxybenzate and catechol determines the sequential decomposition of phenolic compounds in mixed substrate cultivations in pseudomonads. FEMS Microbial. Ecol. 37, 79-89.
[17] Filanov, A.E., Karpov, A.V., Koshaleva, I.A., Puntus, I.F., Balashova, N.V., Boronin, A.M., 2000. The efficiency of salicylate utilization by Pseudomonas putida strains catabolizing naphthalene via different biochemical pathways. Process Biochem. 35, 983-987.
[18] Peyton, B.M., Wilson, T., Yonge, D.R., 2002. Kinetics of phenol biodegradation in high salt solution. Water Res. 36, 4811-4820.
(19] Dalgaard, P., Koutsoumanis, K., 2001. Comparison of maximum specific growth rates and lag times estimated from absorbance and viable count data by different mathematical models. J Microbial. Methods 43, 183-196.