Diagnostic framework of
operational performance
Joana Castellano Montesinos
Supervisor LTH: Bertil I Nilsson
Supervisor UPV: Julien Maheut
June 2019
Faculty of Engineering, LTH
Department of Industrial Management and Logistics Division of Production Management
III
PREFACE
This master's thesis was conducted during the spring of 2019 and represents the final part of my master's degree in Industrial Engineering which was equally realized through the Polytechnic University of Valencia (UPV) and through the Faculty of Engineering, Lund University and thus, of my six years of study as an industrial engineer.
I am grateful for the present project to my tutor Bertil, for all the help, dedication and motivation provided. I also thank all the interviewees, Johan Valette, Johan Wiesel and Fredrik Clausson, the treatment and the great contribution they have made to this master thesis.
Also, to thank my father, my sister and all those who, both in Sweden and in Spain, have been by my side during its realization.
Finally, I would like to thank my mother for this project. Since I was a child, she aroused my passion for sciences and was able to support me and push me to fulfill all that I have proposed in life.
Lund, June 2019
V
ABSTRACT
Title Diagnostic framework of operational performance
Author Joana Castellano Montesinos
Supervisor Bertil I Nilsson, Senior Lecturer, Department of Industrial Management and Logistics, Faculty of Engineering at Lund University
Problem definition All organizations need to continuously scrutinize and analyse their facilities, operations, quality and cooperation along the Supply Chain. When analysing their facilities, it is necessary not only to recognize and review how well the operations are running by estimating the current state but also to recognize potential problems and improvements. Once the current situation is known, it is also needed to compare/benchmark the situation in one work-shop today with other work-work-shops, to evaluate the supplier’s capability or capacity and other potential gaps of technical nature. Purpose The purpose of this master thesis is to develop an integrated diagnostic framework including the strategic, tactical and operational levels of planning, describing briefly applicable tools and programs and test it on a few companies.
Methodology This master thesis can be classified as an Action Research since its main objective is to produce guidelines for best practice.
Different research methods are used: first, documentary research for the knowledge of all the concepts, methodologies and tools involved in the development of the framework; second, interviews to managers from different companies are carried out to obtain information about current practice in the field and with the objective of verifying if the framework developed is useful, knowing its limitations and trying to perfect it. In addition, when carrying out interviews, observation can be used as an auxiliary method.
Results and conclusion A diagnostic framework is constructed and validated by the managers of three different companies in Skåne which give empirical support for the reliability and validity of its contents. The framework is defined as a three steps guide that includes a set of tools classified into the three levels of planning, used to prevent operational performance problems or improvements and whose importance increases in small and medium companies without Lean or Six Sigma.
Key words Integrated framework; Problem identification; Improvement identification; Planning levels; Operational performance problem; Current state; Benchmarking; Supplier’s evaluation; Quality;
VII
GLOSSARY AND ACRONYMS
Benchmarking The search for industry best practices that lead to superior performance.
Current State Analysis A report indicating how an organization is running its operations today.
Framework A system of rules, ideas or, in this case, tools and methodologies that is used to plan or decide something.
Improvement process The proactive task of identifying, analysing and improving upon existing business processes within an organization for optimization and to meet new quotas or standards of quality. Levels of business Levels in which business strategies can be classified. In the present
work they are called: strategic, tactical and operational. Operations
performance
Firm's performance measured against standard or prescribed indicators of effectiveness, efficiency, and environmental responsibility such as, cycle time, productivity, waste reduction, and regulatory compliance.
Operations strategy Set of decisions concerned with how operations configure and change their overall capacity in order to achieve a particular level of output potential.
Self-assessment Assessment or evaluation of one's actions, processes, or performance.
SC Supply Chain, a systems-based approach to performance
improvement that leverages opportunities created by upstream and downstream linkages with suppliers and customers.
IX
CONTENTS
1. INTRODUCTION ... 1 1.1. Context... 1 1.2. Problem description ... 1 1.3. Purpose ... 2 1.3.1. Research questions ... 2 1.3.2. Delimitations ... 2 1.4. Project objective ... 31.5. Structure of the report ... 3
2. METHODOLOGY ... 5
2.1. Research strategy ... 5
2.1.1. Research approach ... 5
2.2. Research design ... 6
2.3. Data collection methods ... 6
2.4. Criteria for the quality of this research ... 7
2.4.1. Authenticity ... 7 2.4.2. Credibility ... 7 2.4.3. Transferability ... 8 2.4.4. Dependability ... 8 2.4.5. Confirmability ... 8 3. THEORETICAL REFERENCES ... 9
3.1. Total Quality Management (TQM) ... 9
3.2. Lean and Six Sigma ... 9
3.3. Performance measures ... 9
3.4. Supply Chain Management... 10
3.5. Best practices ... 11
3.6. Comparative analysis ... 11
3.7. Business Excellence Models ... 12
3.7.1. The Malcolm Baldrige National Quality Award ... 12
3.7.2. The European Foundation for Quality Management ... 12
X
4. DEVELOPMENT ... 15
4.1. Introduction ... 15
4.2. STEP 1: How does a company know it has a need for improvement? ... 17
4.2.1. Introduction... 17
4.2.2. Direct problems ... 17
4.2.3. Tools to be used ... 18
4.2.4. Starting point and direction of the analysis ... 21
4.2.5. How to do it? ... 22
4.2.6. Summary step 1 ... 23
4.3. STEP 2: Current State Analysis ... 24
4.3.1. Introduction... 24
4.3.1. Tools to be used at the strategic level ... 24
4.3.2. Tools to be used at the tactical level ... 28
4.3.3. Tools to be used at the operational level ... 30
4.3.4. Summary step 2 ... 35
4.4. STEP 3: Create and evaluate alternatives ... 36
4.4.1. Introduction... 36
4.4.2. Relation to theories ... 36
4.4.3. Tools to be used at the tactical level ... 38
4.4.4. Tools to be used at the operational level ... 44
4.4.5. Summary step 3 ... 47
4.5. Complete framework structure ... 48
5. EMPIRICS ... 49
5.1. Introduction ... 49
5.2. Case I: EWP Windtower Production AB ... 50
5.2.1. How does the organization or plant work today? ... 50
5.2.2. How does the organization or plant handle operational performance improvements or problems? ... 51
5.3. Case II: Haldex ... 52
5.3.1. How does the organization or plant work today? ... 52
5.3.2. How does the organization or plant handle operational performance improvements or problems? ... 55
XI
5.4. Case III: Baxter ... 55
5.4.1. How does the organization or plant work today? ... 56
5.4.2. How does the organization or plant handle operational performance improvements or problems? ... 57
6. ANALYSIS ... 59
6.1. Introduction ... 59
6.2. Comments and reflections about the framework ... 59
6.2.1. Comparison with improvement processes ... 59
6.2.2. Interviewees’ reflections ... 61
6.3. Framework improvements ... 62
6.3.1. Explanation of the new concepts and tools ... 63
6.3.2. Final framework ... 65 6.4. Limitations ... 66 7. REFLECTIONS ... 67 7.1. Discussion... 67 7.2. Further research ... 68 7.3. Author’s contribution ... 69 REFERENCES ... 71 APPENDIX... 75
A1. Evaluate manufacturing capability (Lekurwale et al., 2014) ... 75
A2. Integrated strategic benchmarking framework (Meybodi, 2006) ... 77
A3. Rapid Plant Assessment ... 79
A4. Interview guide ... 81
XIII
FIGURES
Figure 1. Methodology. Source: Own elaboration ... 6
Figure 2. Flowchart to implement the first step of the framework. Source: Own elaboration ... 22
Figure 3. Structure of the first step of the framework. Source: Own elaboration ... 23
Figure 4. SWOT analysis matrix example with questions to complete it. Source: Own elaboration ... 25
Figure 5. The Fundamental Concepts of Excellence from the EFQM Excellence Model. Source: Made by the author based on (EFQM.ORG, 2019) ... 26
Figure 6. The 9 Box Model of the EFQM Excellence Model. Source: Made by the author based on (EFQM.ORG, 2019) ... 27
Figure 7. SCOR model. Source: (APICS, 2017) ... 29
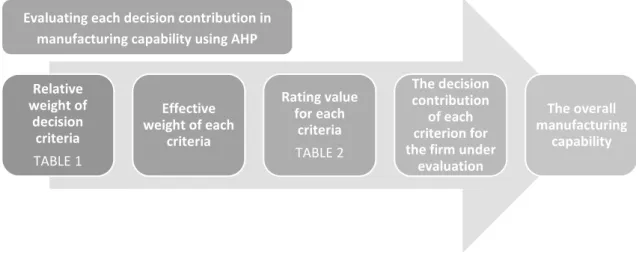
Figure 8. Process to evaluate manufacturing capability. Source: Own elaboration ... 30
Figure 9. Steps to evaluate each decision contribution in manufacturing capability using AHP Source: Own elaboration ... 31
Figure 10. Structure of the second step of the framework. Source: Own elaboration ... 35
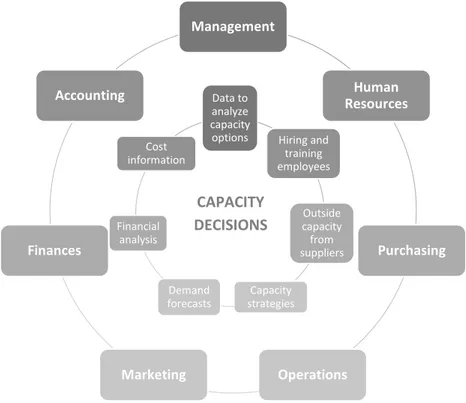
Figure 11. The different areas that intervene in a capacity decision. Source: Made by the author based on (Krajewski et al., 2019) ... 37
Figure 12. Structured methodology for supplier selection and evaluation in a supply chain. Source: Made by the author based on (Chen, 2010) ... 40
Figure 13. Structure of the third step of the framework. Source: Own elaboration ... 47
Figure 14. Complete structure of the framework. Source: Own creation ... 48
Figure 15. Enercon corporate culture summary. Source: (Enercon, 2019)... 50
Figure 16. Haldex Framework for Strategic Deployment and Result driven Improvements and its different components. Source: (Corporate Haldex, 2019) ... 53
Figure 17. The Radar logic of Haldex Way. Source: (Corporate Haldex, 2019) ... 53
Figure 18. Complete structure of the final framework. Source: Own creation ... 65
Figure 19. Further step including steps four and five. Source: Own elaboration. ... 68
Figure 20. PDCA illustration. Source: Made by the author based on (International Organization for Standardization, 2015) ... 68
XV
TABLES
Table 1. Levels of planning, time horizons and issues related. Source: (Schmidt et al., 2000) modified ... 18
Table 2. Tools for identification depending on the level of planning. Source: Own elaboration ... 18
Table 3. Levels of planning and types of review. Source: Own elaboration ... 24 Table 4. Performance metrics and measurements of SCM at the operational level. Source: (Bhagwat et at., 2007) modified ... 33 Table 5. Performance measurements depending on different operational issues. Source: Made by the author based on (Wedgwood, 2016) ... 33 Table 6. RSPA Subcategory Breakdown Structure. Source: (Steingrímsson et al., 2012) ... 43 Table 7. Areas to focus on at the tactical level when implementing the RPA and RSPA. Source: Own elaboration ... 44 Table 8. Areas to focus on at the operational level when implementing the RPA and RSPA. Source: Own elaboration ... 45
1
1. INTRODUCTION
This first chapter allows the reader to know the context in which this
master's thesis is developed. Then, the problem description, the purpose
and the project objective are presented. Finally, there is a brief
description of the chapters and structure of the thesis.
1.1. Context
In a Supply Chain, a high requirement to avoid misunderstanding, quality deviations, additional work and delays exists. A balanced full Supply Chain is as important as a balanced assembly line for complex products. All type of non-compliance, not appropriate or misassignment resources are pitfalls in strategic terms and will decrease the organization’s competitiveness and profit, from the best practices point of view. (Croxton, 2001)
Along this lines, an audition of the complete chain is needed to avoid risks for lack of full fitness. In addition, this audition must provide valid and realistic data since according to the Standard ISO 9001:2015 (International Organization for Standardization, 2015), all the decisions are required to be based on facts.
In order to carry out the said audition, companies and other type of organisations are required to determine criteria and apply methods to ensure effective operation and control of their processes (Chibba, 2017), they need to continuously scrutinize and analyse their facilities, operations, quality and cooperation along the Supply Chain.
1.2. Problem description
As it has been explained above, it is necessary to scrutinize, analyse and evaluate on different levels of the business – from the operational level up to strategic level – a company facilities, operations, quality and cooperation between suppliers.
When analysing its facilities, it is necessary not only to recognize and review how well the operations are running, how well instructions and procedures are used and fitted in to the business by estimating the current state but also to recognize potential problems to prohibit delays, future emergency stops and repair or even loss of customer orders.
Once the current state is known, it is also needed to compare/benchmark the situation in one work-shop today with other work-shops, to evaluate the supplier’s capability or capacity and other potential gaps of technology nature, to plan, for example, investments or outsourcing. All these activities can be used to help companies or plants carry out a problem or improvement identification process to not only continuously measure their current state but also solve operational performance problems. No organization is immune to these types of problems and although they are focused at the operational level, they influence further up to the strategic level. For that purpose, a wider toolbox for all these activities is required; maybe not only simple tools but also parts of quality review programs including traditional audition and critical reviews.
2
1.3. Purpose
The purpose of this master thesis is to develop an integrated framework to identify and define operational performance problems and improvements. It includes the strategic, tactical and operational levels of planning and describes briefly applicable tools and programs classified into three steps. Finally, the framework is verified on three different companies.
Although this framework focuses on operational performance, the operational level is not the only one analyzed, since although the problem manifests itself at this level, in many cases it is necessary to analyze the higher levels in order to find an improvement. (Schmidt et al., 2000) Through an exhaustive search in the existing literature by both the author and the tutor of the project, it has been determined that there is no guide or framework that collects all the steps and tools to be used with this objective beyond general processes of improvement. However, this framework can be strongly compared to those general improvement processes that pursue a much more ambitious goal and can be used with the same objective as the present framework.
1.3.1. Research questions
The questions that drive the research of this paper are presented in this subsection:
RQ1: How can this framework support companies with operational performance improvements or problems?
RQ2: How do companies currently solve or prevent operational performance improvements or problems?
RQ3: What are the advantages and disadvantages of the present framework with respect to other improvement or problem-solving processes?
The answer to these questions can be found as follows: RQ1 partly in chapter 4 and partly in chapter 6; RQ2 in chapter 5; and RQ3 in chapter 6.2.1.
1.3.2. Delimitations
Being a Master Thesis, the timeframe for this project is about 20 weeks. This has impacted the choice of project scope and research questions. Due to this limitation, this paper does not include more than three interviews with managers of different companies or the evaluation of some of the possible alternatives of solution.
In addition, the tools necessary for the creation and evaluation of alternatives at the long term or strategic level are considered to be encompassed in subjects that do not correspond with the department where this project is carried out and for this reason, they are not included. However, there are some concepts or actions that involve more than one level of planning, including the strategic one, which are going to be added and briefly explained.
3
1.4. Project objective
The main objective of this project is the development of a framework to support companies scrutinize, analyse and evaluate their operations on different levels of the business and with it, build up competence in the best possible way.
From the description of basic concepts such as total quality management or performance measures to the development of a particular set of rules, ideas, or beliefs which can be used in order to deal with a need for improvement. In between, all the methods and techniques used to recognize a need for improvement, to evaluate the current state of an organization or a plant and to create and evaluate alternatives.
1.5. Structure of the report
The thesis is structured in the following way: Chapter 1: IntroductionThe first chapter gives a context for the thesis, the problem description, the purpose and objectives of the thesis and its delimitations.
Chapter 2: Methodology
This chapter explains the research methodology, the data collections methods and the criteria for the quality of this research.
Chapter 3: Theoretical references
The third chapter introduces some concepts that need to be explained in order to understand the tools and techniques proposed to the different steps of the framework developed. It gives a basic knowledge about Total Quality Management, Lean and Six Sigma, Performance measures, Supply Chain Management, Best Practices, Benchmarking and Business Excellence Models. Chapter 4: Development
The development chapter explains elaborately the three steps of the present framework: (1) How does a company know it has a need for improvement, (2) Current State Analysis and (3) Create and evaluate alternatives.
Each of these steps include a set of tools to use in order to achieve the main objective of the step. While the tools of the first step are classified according to its purpose (recognize a need for improvement, find root causes and analyse hazards), the tools of the other two steps are classified according to the level of planning (strategic, tactical and operational) that has been deduced as starting point from the first step.
Chapter 5: Empirics
In this chapter, the insights from the three cases, made from interviews with three managers of different companies, are shown. The cases show the way companies currently work and face operational performance improvements or problems.
4
Chapter 6: Analysis
The sixth chapter includes the comparison between the already developed framework and the companies’ insights which are extracted from the interviews. In addition, this chapter includes the interviewees comments about the framework. Then, the limitations of the framework arise and also the necessary corrections for the development of the final framework.
Chapter 7: Reflections
The reflections chapter includes the discussion of the used methodology, the academic contribution of the author with this thesis and the further research.
Appendices:
A1. Evaluate manufacturing capability
This appendix includes two tables that are used to evaluate the manufacturing capability using the methodology proposed by (Lekurwale et al., 2014).
A2. Benchmarking: Integrated strategic benchmarking framework
This appendix contains the table that groups the four areas and the elements that are evaluated in the questionnaire-based survey which conforms the integrated strategic benchmarking framework proposed by (Meybodi, 2006).
A3. Rapid Plant Assessment
The tables needed to implement the Rapid Plant Assessment (RPA) are included in the fourth appendix
A4. Interview guide
The fifth appendix includes the interview guide that is followed during the realization of the interviews to the three managers of three different companies.
A5. Briefly explanation of the tools mentioned in the interviews
5
2. METHODOLOGY
This second chapter explains the research methodology. Firstly, the
approach used to perform the research and the research design are
explained. Then, there is an explanation of how the data has been
collected, and finally, the general criteria for assuring the quality of this
thesis is explained.
2.1. Research strategy
A research strategy requires an overview of the whole project, a carefully constructed plan of action and a specific goal that can be achieved and which is clearly identified.
To decide which strategy is likely to work best, different factors need to be considered such as suitability, feasibility and ethics. According to Denscombe (2010), the project to be carried out should be classified into Action Research because of its purpose of research, i.e. because its main objective is to “produce guidelines for best practice”.
The action research characteristics are a practical nature since it is aimed at dealing with real-world problems; change because it is a way of dealing with practical problems and a means of discovering more about the theory involved; cyclic process since involves a feedback loop; and active participation.
In addition, the research methods, which can be classified into quantitative, qualitative and mixed, have to be also decided. This thesis research is qualitative since it is a subjective research that focuses on the meaning of things. According to this, the data collection methods used are qualitative and the criteria for the quality of this research are, from (Bryman et al., 2007), authenticity, credibility, transferability, dependability and confirmability.
2.1.1. Research approach
In this master thesis, it is necessary to acquire a good knowledge about very diverse concepts, but all encompassed within the main topic of operational performance. For this matter, several books and articles, cited in the following sections, were reviewed not only to acquire a base of key knowledge, but also to look for tools, methodologies and frameworks that could be part of this project.
Moreover, the author considered very important to have empirical knowledge in order to test and validate the framework with some managers of companies. Along these lines, face-to-face or online interviews have been used as the main method for doing the case studies.
6
2.2. Research design
The research design followed in this thesis is, roughly, the one shown in the following figure:
Figure 1. Methodology. Source: Own elaboration
As it can be seen in the above figure, the first step is to collect information about all the concepts involved in the development of the framework as well as for the knowledge of existing methods or techniques for the resolution of the different questions. Afterwards, the first draft of the framework should be developed.
Secondly, the theory needs to be compared with the current practice. This practice is extracted from interviews to some companies’ managers that have shown interest in collaborating with the realization of this master thesis.
Once the data is collected, it should be analysed. In this way, the interviews responses are translated into companies’ insights in order to make the comparison with the theory possible. With the comparison, the corrections of the framework as well as its limitations arise and with its correction and complete definition, the final proposal of the framework is developed.
2.3. Data collection methods
In order to carry out this project and collect information, different research methods are used. In the first place, documentary research is used for the knowledge of all the concepts, tools and methods involved in the development of the framework. When defining all the concepts, methods and techniques, their utility for the development of the framework is commented in order to explain why they are included in this project.
The documentary research is based on books focused mainly on Operations Strategy such as (Foster, 2012), (Krajewski et al., 2019) and (Slack et al., 2017) and articles that, although all are encompassed with the same field, deal with varied topics as the ones that follow:
- Strategic, tactical and operational decisions - Assessing organizational performance - Supply Chain integration and management - Benchmarking business performance - Strategic sourcing
- Managing quality - Lean and Six Sigma
All these articles are collected using two information search engines: Google Scholar and LUB Search.
7 Secondly, interviews with managers of companies are carried out to obtain information about the current practice in the field and with the objective of verifying if the framework developed is useful, knowing its limitations and trying to perfect it. These interviews are held in English, a language in which both the interviewer and the interviewee are comfortable. In addition, when carrying out the interviews, observation can be used as an auxiliary method.
An interview question guide is created with the objective of having a reference at the time of conducting the interviews. It should be mentioned that during the realization of these, it is not strictly necessary to follow the guide if it is considered that, for example, there is great interest in an area in which it is not deepened with the guide. In addition, the guide does include not only questions but also explanations about the framework.
This question guide is structured in sections as follows:
(1) Understanding the interviewee and the company, (2) Define: Identify a need for improvement, (3) Measure: Current State, (4) Analyse: Talking about solutions and (5) Comments about the presented framework.
2.4. Criteria for the quality of this research
In order to assess the quality of this research authenticity, credibility, transferability, dependability and confirmability are concepts that need to be considered. All the information of this section is extracted from (Bryman et al., 2007).
2.4.1. Authenticity
Authenticity refers to whether the research fairly represents different observed points of view, whether it help individuals to show signs of comprehension improvement of their social environment or encourages them appreciate the perspectives of other individuals. Likewise, it alludes to if the research has been an incentive to individuals to participate in action and if it has empowered individuals to find a way to change their circumstances.
To ensure authenticity of this project, different managers were interviewed regarding similar issues and different sources for the same area of information were cited. In addition, since the interviews were conducted temporarily separately, some of the insights extracted from an interview could be shared with other interviewees. Lastly, two tutorials per month were carried out to corroborate the good path of the project.
2.4.2. Credibility
Credibility concerns whether there is a decent match between the researcher perceptions and the theoretical ideas created and whether the conclusions that link two or more concepts are firm and sound.
In order to ensure credibility, multiple sources were used to obtain similar information. This was utilized for the written sources, interviews and observations.
8
2.4.3. Transferability
Transferability refers to which results can be generalized. In order to provide the reader with enough information for making judgements about transferability to other cases, it is important to provide a detailed description of the underlying concepts.
To guarantee transferability, this project includes a description of all the proposed tools and the steps of which the framework is composed, as well as a complete description of its usefulness.
2.4.4. Dependability
Dependability is concerned with the question of whether the results of a study are repeatable, or in other words, how stable the measurement of a concept is.
In order to provide a repeatable result, the methodology for the realization of this project was clearly explained and an interview guide is added in appendix (A4) with which comparable insights to those obtained could be elicited.
2.4.5. Confirmability
Confirmability is concerned with guaranteeing that the researcher has not enabled personal values or influences to modify the conduct of the research and the findings derived from it. To ensure confirmability and thus, objectivity, the first-hand information of the interviewees was collected, and the information extracted from different written sources was not modified adding any subjectivity.
9
3. THEORETICAL REFERENCES
Some theoretical concepts need to be introduced in order to understand
the tools and techniques proposed to the different steps of the
framework
3.1. Total Quality Management (TQM)
Total quality management (TQM) is a total, company-wide effort, though full involvement of the entire workforce and a focus on continuous improvement, that companies use to achieve customer satisfaction. (Lakhe et al., 1993)
TQM has been developed around critical factors such as leadership, quality planning, human resources management, process management, cooperation with customers and suppliers, and continuous improvement. It includes not only a number of critical factors, but also other components such as tools and techniques for quality improvement which are vital to support and develop the quality improvement process.
3.2. Lean and Six Sigma
Lean and Six Sigma are both business process improvement methodologies and their end goals are better process performance but focusing on different elements of a process.
Ian Wedgwood (2016) defines these concepts as follows: Six Sigma is “a systematic methodology to home in on the key factors that drive the performance of a process, set them at the best levels, and hold them there for all time” while Lean is “a systematic methodology to reduce the complexity and streamline a process by identifying and eliminating sources of waste in the process, which typically causes lack of flow”.
Lean and Six Sigma have been positioned as competitors when, in fact, they are complementary. Lean accelerates Six Sigma, delivering greater results than what would typically be achieved by Lean or Six Sigma individually. (Go Lean Six Sigma, 2012)
According to this, several tools that are part of the Lean Sigma toolbox are included in the presented framework.
3.3. Performance measures
Matthews (2011) defines a performance measurement as a metric used to quantify the efficiency or effectiveness of an activity. Its real value is when an organization goes through a planning process that identifies performance measures that are linked to that organization’s vision, goals and objectives.
10
In order to set good performance measures, they must be balanced, aligned to the organization’s strategies, flexible, timely and accurate, simple to understand and focused on improvement. They can be defined also using the SMART rule: Specific purpose, Measurable, Achievable, Relevant and Time phased.
While performance measures can stand alone, they can also be combined with other management techniques to create more useful organization tools. These management techniques can be Dashboards, Key Performance Indicators (KPI), Critical Success Factors (CSF), Process Improvement Initiatives, Self-Assessment Award Models, etc. (Matthews, 2011) Measurement is important, as it affects behaviour that impacts supply chain performance. As such, performance measurement provides the means by which a company can assess whether its SC has improved or degraded.
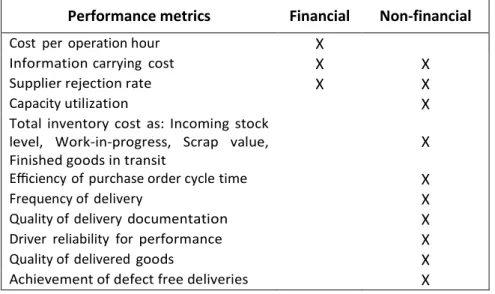
For any business activity, such as Supply Chain Management (SCM), identifying the required performance measures on most of the criteria is essential and it should be an integral part of any business strategy. In order to measure and evaluate complex supply chains, measurement goals must consider the overall scenario and the metrics to be used. These should represent a balanced approach and should be classified at strategic, tactical and operational levels, and be financial and non-financial measures, as well. (Bhagwat et al., 2007)
3.4. Supply Chain Management
Foster (2012) defines the Supply Chain (SC) as “a systems-based approach to performance improvement that leverages opportunities created by upstream and downstream linkages with suppliers and customers”. It is a sequence of activities and organizations involved in producing and delivering a good or service.
When talking about its management, Stadler (2005) defines the SCM as the task of integrating organizational units along a SC and coordinating material, information and financial flows in order to fulfil customer demands with the aim of improving competitiveness of the SC as whole. However, there are a lot of different definition of the SCM. From (SCRC SME, 2017), the Supply Chain Management (SCM) is defined as the active management of supply chain activities to maximize customer value and achieve a sustainable competitive advantage. It represents a conscious effort by the SC firms to develop and run supply chains in the most effective and efficient ways possible. SC activities cover everything from product development, sourcing, production, and logistics, as well as the information systems needed to coordinate these activities. (SCRC SME, 2017)
This concept is based on two ideas. The first is that “practically every product that reaches an end user represents the cumulative effort of multiple organizations” (Kleab, 2017). The second idea is that while supply chains have existed for quite a while, most associations have just focused on what was going on inside their own business. Few organizations understood, and fewer managed, the whole chain of activities that ultimately delivered items to the last customer. The outcome was disjointed and frequently useless supply chains.
11 The associations that make up the SC are "connected" together through physical and data flows. While physical flows include the transformation, movement, and storage of goods and materials and are the most noticeable part of the supply chain, data flows permit the different SC accomplices to facilitate their long-term plans, and to control the everyday flow of goods and materials up and down the SC. (Kleab, 2017)
An important issue in performance measurement is how company can use measures to gauge its SC’s performance. To do this effectively, a target for each measure needs to be established, providing the framework for determining if the metric has improved from the last time it was reviewed, by how much and how close is the metric to where it should be.
3.5. Best practices
(Angulo Cuentas et al., 2015) is the article used to describe and get a better knowledge about best practices. A best practice can be defined as a process that is better at delivering a particular result than any other and can be identified and learned from many sources such as industrial experiences, consulting experiences, advanced information systems and knowledge base. This practices can be identified by studying both the excellent organizations processes and activities and studying and each organization’s processes and activities and approaching them in context and determining the cause and effect relationship with organizational performance. (Angulo Cuentas et al., 2015)
3.6. Comparative analysis
Comparative analysis (CA) is an analysis that allows an organization to contrast against others or against itself. This comparison can be made in several ways: by industry, revenue, employee base of similar organizations, comparing the organization to those considered “best in class”, comparing functional departments, processes, and facilities within the organization, etc. Benchmarking is considered in this section as a tool or process to carry out comparative analyses in a more specific way. Along these lines, this section describes the Benchmarking process and its utility in this framework.
Benchmarking, as a part of total quality process, is the search for industry best practices that lead to superior performance (Shen et al., 2000). It helps organizations identify current best-in-class designs and identify strengths and weaknesses. It can thus be used to identify the areas on which to focus the company’s efforts for obtaining a competitive advantage and it may lead to creative, cost-effective innovations. (Foster, 2012)
Benchmarking has proven to be an effective quality improvement tool, as it has been said above. It can be used to effectively guide the direction of incremental continuous improvement as well as for major changes of process engineering. Learn from the best-in-class organization and utilizing the best practices is a good means to achieve superior performance.
In order for the benchmarking process to be considered effective, it needs to be integrated into organizational strategy and those activities that are critical to organizational success. Along these lines, auditing inner manufacturing strategy, as (Meybodi, 2006) proposes, is necessary to the adequacy of the benchmarking process by accomplishing strategic alignment between different levels in the organization.
12
From the International Organization for Standardization (2018) is known that the organization should consider the different types of benchmarking practices such as internal benchmarking of activities and processes within the organization, competitive benchmarking of performance or processes with competitors and generic benchmarking, by comparing strategies, operations or processes with unrelated organizations.
3.7. Business Excellence Models
Business Excellence Models (BEMs) have played a major role in improving the performance of organizations. Based on total quality management principles, BEMs have evolved to support strategic planning and decision-making processes and also to measure overall organizational performance. (Meza-Ruiz et al., 2017)
3.7.1. The Malcolm Baldrige National Quality Award
The Malcolm Baldrige Quality Award (MBNQA) was established by Congress in 1987 to improve the competitiveness of American organizations. After that, the principles of the MBNQA were introduced as a promising framework for assessing and improving organizational performance. (Shields et al., 2012)
The Baldrige Excellence Builder is used to assess the organization against the most important features of organizational performance excellence, and it is based on the Baldrige Excellence Framework and its Criteria for Performance Excellence.
3.7.2. The European Foundation for Quality Management
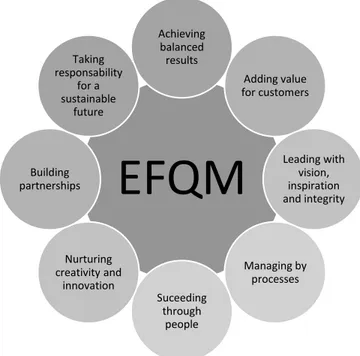
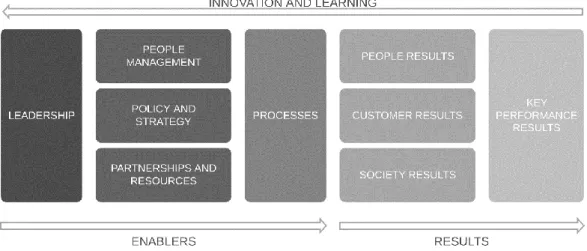
The European Foundation for Quality Management (EFQM) Excellence Model was introduced at the beginning of 1992 as the framework for assessing applications or the European Quality Award. The EFQM model is used as a management system that encourages the discipline of organizational self-assessment. (EFQM, 2016)
The EFQM Excellence Model is a practical tool to help organizations by measuring where they are on the path to Excellence; helping them understand the gaps; and simulating solutions. It is applicable to any organization irrespective of size and structure, and sector. (Michalska, 2008)
3.7.3. The international Organization for Standardization series
The International Organization for Standardization (ISO) is a worldwide federation of national standards bodies. Two of these standards are of interest for the present project: ISO 9001:2015 and ISO 9004:2018.
While ISO 9001:2015 focuses on providing confidence in an organization’s products and services, the ISO 9004:2018 focuses on providing confidence in the organization’s ability to achieve sustained success. All the information about the different standards is extracted from each specific standard: (International Organization for Standardization, 2015) and (International Organization for Standardization, 2018).
13
3.7.3.1.
ISO 9001:2015
The selection of a quality management system is a key choice for an association that can improve its general performance and give a sound premise to sustainable development initiatives.
The potential benefits to an organization of implementing a quality management system based on the ISO 9001:2015 are the ability to meet customers and regulatory requirements, facilitating opportunities to enhance customer satisfaction, addressing risks and opportunities and the ability to demonstrate conformity to specified quality management system requirements.
This International Standard employs the process approach, which incorporates the Plan-Do-Check-Act (PDCA) cycle and risk-based thinking.
3.7.3.2.
ISO 9004:2018
The ISO 9004:2018 provides guidance for organizations to achieve sustained success in a complex, demanding and ever-changing environment, with reference to the quality management principles. It addresses the systematic improvement of the organization’s overall performance and includes the planning, implementation, analysis, evaluation and improvement of an effective and efficient management system.
This International Standard promotes self-assessment and provides tool for reviewing the extent to which the organization has adopted the concepts in the document.
15
4. DEVELOPMENT
This chapter describes the development of the framework, as well as the
three steps and all the tools included in it.
4.1. Introduction
In this chapter, the development of the Diagnostic Framework of Operational Performance is explained. Along these lines, this chapter is composed of three sections in addition to the introduction and the final complete framework structure section that represent the three steps of the framework as follows:
First, the existence of improvement requirement needs to be detected and thus, the level of planning is deduced according to the fault or improvement detected. Secondly, the current state of the company should be known with the aim of increasing knowledge about the company itself and about the problem or need detected. And finally, the evaluation of some alternatives to find a solution. It worth nothing to say that most of the tools to carry out this process and thus, these three steps are classified in the three different levels of planning which are explained below. According to this, the steps of the framework are:
1. How does a company know it has a need for improvement? 2. Current State Analysis
3. Create and evaluate alternatives
These steps were chosen after several hours of brainstorming between the author and the tutor and the reading of articles and books related to the resolution of operational problems and improvement processes such as (Pal et al., 2017) or (Krajewski et al., 2019).
In order to answer the research question RQ1 (“How can this framework support companies with operational performance improvements or problems?”), some information is added in this chapter and some in the analysis chapter. It worth nothing to say that chapter four in full responds, indirectly, to that question.
As the main aim of the present framework is to provide a series of tools and methodologies to identify a need for improvement and get more information about the company or the plant by measuring its current state, can be considered as a problem or improvement identification process used to prevent operational problems. Moreover, it gives some hints to solve or find solutions.
Some of the proposed tools belong to the Lean Six Sigma toolbox. However, they are considered the simplest ones, so any company, even if they do not use Lean or Six Sigma, can apply them.
16
In this way, this framework proposes examples of tools and methods than can be used but when selecting or using them, there are two factors which organizations should keep in mind. First, all the tools or techniques need to be accompanied by a plan to be effective and by an appropriate behaviour and attitudes of the employees and thus, make affective improvements. Second, no one technique is better than another and they all play an indispensable role in the improvement process. (Dale et al., 2007)
In addition, it should be noted that all this process must be accompanied by a feasibility study to know, at each step of the process, whether it is economically profitable to continue with the search for a solution or improvement.
Before beginning any process improvement project, it’s vital that good candidates for improvement are chosen as projects. Those candidates have to have the potential to result in increased revenue, reduced cost or improved efficiency and also, collectable data. (Go Lean Six Sigma, 2012)
To make this project completely understandable, some concepts are explained such as the differences between capacity, capability and performance, the decision making process and the different planning levels.
The words capacity, capability and performance are often used as synonyms when applied to the problem of strengthening organizations, businesses and governments. However, there are differences in their definitions: Capacity is the ability that exists at present while capability refers to the higher level of ability that can be achieved or improved to and performance refers to how the execution of an action or the fulfilment of a claim, promise or request is being carried out. (BusinessDictionary, 2019)
Talking about managerial activities, decision making is central to all the them, be it planning, organizing, staffing, directing and controlling. It is a process of making choices from alternative courses of action with the intention of moving towards a desired state of affairs.
Planning is the part of management concerned with creating procedures, rules and guidelines for achieving a stated objective. Making decisions in planning activities may range from setting of goals and targets for the entire business enterprise to specific decisions regarding day-to-day activities. Some of them may have only short-term implications, while others may have long-term implications on the enterprise. (Mikoluk, 2013)
From these points of view, managerial decisions can be broadly classified into three categories, i.e. intro three levels of planning, namely, strategic, tactical and operational levels.
While strategic planning is an organization’s process of defining the strategy, or direction and making decisions on allocating its resources to pursuit this strategy, tactical planning is a short range planning (one year or less) emphasizing the current operations of various plants of the organization. Finally, operational planning in the process of linking the objectives and goals of the previous two. Implementing operational processes is useful to obtain the tactical policies, aims and goals as well as the strategic objectives. (Mikoluk, 2013)
17
4.2. STEP 1: How does a company know it has a need for improvement?
4.2.1. Introduction
The first step of the present framework is the identification of the existence of a need for improvement and the definition of this need.
The appropriate definition of the problem or improvement needed is the most important step in the search for a valid solution since without having a clear and defined objective, all the following steps can go in the wrong direction or be inefficient.
All type of activities within the Value Chain and SC are both planned, scheduled and tracked. In all these three phases deviations and gaps can be identified. Some of said deviations need immediate action while others need a series of previous phases in order to, for example, find the causes. In addition, not only visible or current problems need to be found but also hazards or risks that will imply a future problem.
Along these lines, direct problems, tools for the identification of a need for improvement, tools to find the root causes of the aforementioned deviations and tools to detect hazards are developed.
4.2.2. Direct problems
Depending on the management area where the improvement is needed or, if it is known, depending on the improvement needed, the level of planning where the analysis has to start is deduced. In this way and using (Schmidt et al., 2000), the different levels are related with different issues or needs for improvement.
The strategic level prescribes a set of locations where facilities are to be located, production technologies to be employed at each facility, and the capacity of each plant. In addition to labour and transportation costs, it must consider other issues such as the infrastructure, general business environment, closeness to markets and to suppliers, taxes and duties, strategic alliances and joint ventures. Strategic decisions thus determine the network through with production, assembly and distribution serve the marketplace and has as objective, the maximization of the total profit.
The tactical level prescribes material flow management policies, including production levels at all plants, assembly policy, inventory levels and lot sizes. It deals with material flow from suppliers to production facilities, to assembly plants, through warehouses and on to customers. It has to be considered that some issues such as product design may affect both strategic and tactical decisions, so there are issues that may need both, strategic and tactical tools.
The operational level schedules operations to assure in-time delivery of final products to customers, coordinating the logistics network to be responsive to customers demand. The question at this level is when to perform a manufacturing task and at which facility so that due dates are met to the fullest extent possible. It must deal with the environment created by tactical decisions which may induce long throughput times, causing due dates to be violated.
18
To summarize the above information, the following table is created:
Table 1. Levels of planning, time horizons and issues related. Source: (Schmidt et al., 2000) modified
Level of planning
Time
horizon Issues
Strategic Long term Locations of the facilities, production technologies, plants capacity, infrastructure, general business environment, closeness to markets and to suppliers, taxes and duties, strategic alliances and joint ventures
Tactical Short term Material flow management policies Operational Today and
historically
In-time delivery: when to perform a manufacturing and at which facility; at estimated cost and performance/quality
4.2.3. Tools to be used
As it is said in the introduction, there are different tools to be used in this section. Each of these tools with one specific purpose.
4.2.3.1.
Tools to identify a Need for Improvement (NfI)
In table 1, different tools for the identification of a Need for Improvement (NfI) are classified depending on the level of planning where the improvement is detected as necessary. Then, these tools are briefly explained.
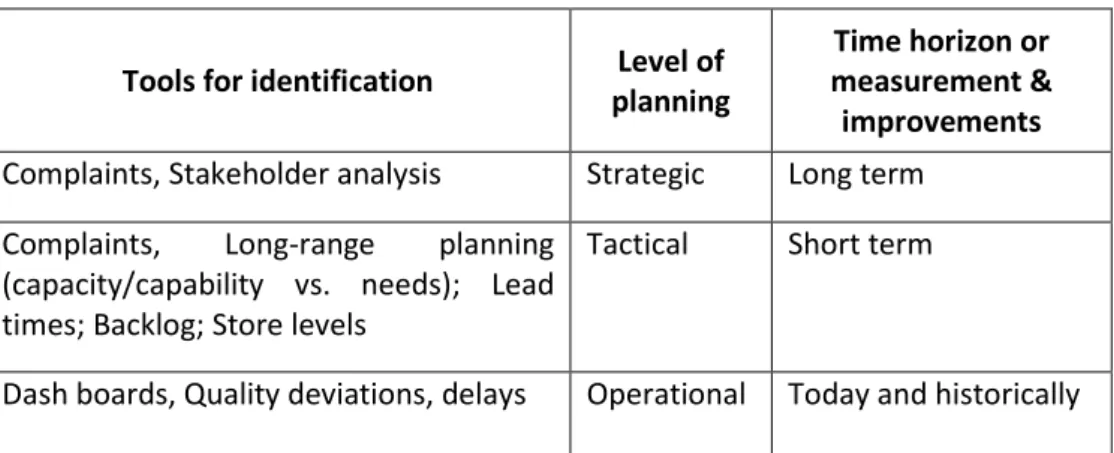
Table 2. Tools for identification depending on the level of planning. Source: Own elaboration
Tools for identification Level of planning
Time horizon or measurement & improvements Complaints, Stakeholder analysis Strategic Long term
Complaints, Long-range planning (capacity/capability vs. needs); Lead times; Backlog; Store levels
Tactical Short term
Dash boards, Quality deviations, delays Operational Today and historically
Complaints can be translated directly into a problem or a fault. However, most of the time it will be necessary to carry out a root cause analysis to be able to find out the main cause of the complaint and thus define a NfI.
Stakeholder analysis is an important technique for stakeholder identification and analysing their needs. The aim of this technique is to develop a strategic view of the human and institutional landscape, and the relationships between the different stakeholders and the issue they care about most. One of the main benefits of the Stakeholder Analysis and why it is included in this project is the identification of potential issues that could disrupt the project and ways to reduce potential negative impacts.
19 The comparison between the existent capacity and the future need can be considered in this section. With the objective of making the comparison possible, it is necessary to make a series of forecasts of demand or, going further, a long-range or strategic planning.
Lead time analysis can help the organization or the plant to know the percentage of the total lead time of each activity or process. Then, the area of the supply chain where the efforts have to be focused is defined.
Backlog is the value of unfulfilled orders, or the number of unprocessed jobs, on a given day. It indicates the workload that is beyond the production capacity of a department or firm and it also serves as a pointer toward the firm’s future sales revenue and earnings. Having a backlog could suggest the firm is unable to meet the demand so it supposes an important indicator of the capacity performance of a plant or an organization.
The goal of store-level analysis is to trawl for the why behind lagging stores. By checking or analysing the store-level, it can be known if the plant has enough products to supplier customers. From there it would be deduced if the material flow management policies are correct or need some kind of improvement.
The dashboards are one of the available tools for performance measurement. They look like electric meters or car dashboards. In the case of electric meter, each of the “gauges” shows a different metric, so that it quickly communicates performance levels. In this way, they are very useful for communication, both possibilities and problems, as they highlight what is the next step to achieve the objectives.
Quality deviation handling plays a key role in assuring quality in products and by contributing to continuous improvement. Manufacturers are expected to establish processes and define appropriate controls for measurement and analysis to identify potential nonconformities; defining when and how corrections, corrective actions, or preventive actions should be undertaken.
Potential deviations are identified and avoided by implementing risk control measures and preventive actions. Quality Risk Management is based on the identification of product attributes and operational parameters which are critical to manufacturing operations in order to identify in advance their associated risks.
When it comes to delays, these delays are a problem in themselves, but to find the reason why the delay has occurred and thus be able to analyse and eradicate its main cause is the most important part.
4.2.3.2.
Tools to find the root causes
The root cause analysis is one of the most important elements of problem-solving in quality management since it is almost impossible to eliminate the real problem if the right target is not being aimed. There are several root cause analysis tools each of them appropriate for a different situation. In this section, some of them are briefly exposed based on (Wedgwood, 2016).
20
A Pareto Chart is a histogram or bar chart combined with a line graph that groups the frequency or cost of different problems to show their relative significance. The bars show frequency in descending order, while the line shows cumulative percentage or total as you move from left to right. It is a simple but extremely useful Lean Sigma tool which uses the Pareto’s law, also called 80/20 rule.
The 5 Whys is based on the idea of keep asking “Why” (usually five times) to ensure tht the root cause(s) of the effects are fully understood. The reasoning is that the result of each time the Whys is asked gives a different answer, from Symptom, through Excuse, Blame and Cause, until Root Cause. A much stronger use of this tool is to ask “Why do I care” enough times to relate the issue back to a business-level problem.
Although the Fishbone Diagram, also known as a Cause and Effect Diagram, is a well-known quality tool, was dropped from the Six Sigma Process Improvement roadmap and replaced completely by the Process Variables Map and Cause and Effect Matrix combination. However, it a very useful team brainstorming tool to help identify potential root causes to problems based on the examination of the six major process-related areas (branches) which are then broken down further into sub-branches following the 5 Whys principle until some potential root causes are identified.
The Scatter Diagram is a quantitative method for determining relationships between variables, determining whether two variables are correlated, such as testing potential causes identified in the fishbone diagram. Its making is a as simple as plotting the independent variable (or suspected cause on the x-axis and the dependent variable or the effect on the y-axis. Then, if the pattern shows a clear line or curve, the variables are correlated.
4.2.3.3.
Tools to detect hazards
It is not necessary to focus only on existing problems or easily recognizable or understandable problems, it is also necessary to carry out a risk analysis in order to detect the hazards that affect the company or the plant and thus be able to mitigate them.
Failure Mode and Effects Analysis (FMEA) is a type of risk management and focusing on the process FMEA (between four different types), it considers the risk of failure of an input to a process step. The main idea is to generate a risk priority number for each failure mode. The higher risk number, the more serious the failure could be, and the more important it is that this failure mode is addressed. In this way, the problem on which to focus and to which to seek a solution is defined. (Foster, 2012)
One of the most known tools is the Hazard Analysis and Critical Control Point (HACCP) which assesses hazards and establish control systems that focus on prevention rather than relying mainly on end-product testing. Although the HACCP was created and its main use is in the food industry, its general approach can be applied to many other industries. The following information about the HACCP is extracted from (Codex Alimentarius Commission, 2003).
21 The HACCP system consists of the seven principles: Conduct a hazard analysis; Determine the Critical Control Points (CCP); Establish critical limits; Establish a system to monitor control of the CCP; Establish the corrective action to be taken when monitoring indicates that a particular CCP is not under control; Establish procedures for verification to confirm that the HACCP system is working effectively; and Establish documentation concerning all procedures and record appropriate to these principles and their application.
Along these lines, the four first principles are going to be used in this subsection as seen below in order to find the greatest risk or risks that will be considered the problems to solve:
1. Assemble HACCP team or HACCP responsible 2. Describe the product
3. Identify intended use as expected uses of the product by the end user or customer 4. Construct flow diagram
5. On-site confirmation of flow diagram by a person or persons with sufficient knowledge of the processing operation
6. List all potential hazards associated with each step, conduct a hazard analysis, and consider any measure to control identified hazards
• In conducting the hazard analysis, the likely occurrence of hazards and severity of their adverse effects, the qualitative or quantitative evaluation of the presence of hazards should be include whenever possible
7. Determine critical control points
• There may be more than one CCP at which control is applied to address the same hazard
• This action can be facilitated by the application of a decision tree which indicates a logic reasoning approach
8. Establish critical measurable limits for each CCP 9. Establish a monitoring system for each CCP
4.2.4. Starting point and direction of the analysis
Once the need for improvement is detected, the level of planning by which to start with the analysis is deduced. Depending on that level, the time horizon, the type of review, the alternatives and thus, the programs and tools to be used vary.
The direction of the analysis should thereupon be defined. If the improvement is needed in a specific management area, the level corresponding to that area should be the starting point and then, probably, move to the other levels to achieve the goal. However, if the fault/problem/gap is not focused on one specific level, the analysis should start from the most global level and then keep exploring. It should be noted that a single direction is not mandatory, there will be analyses that must rise and fall from one level to another continuously.
Along these lines, if one starts on strategic level, then next step will be on tactical level and maybe then on operational level. If one start on tactical level, one can then either go up, to proceed down or go down to operational level. And if one starts directly on operational level, one can both complete on that level or go further up.
22
4.2.5. How to do it?
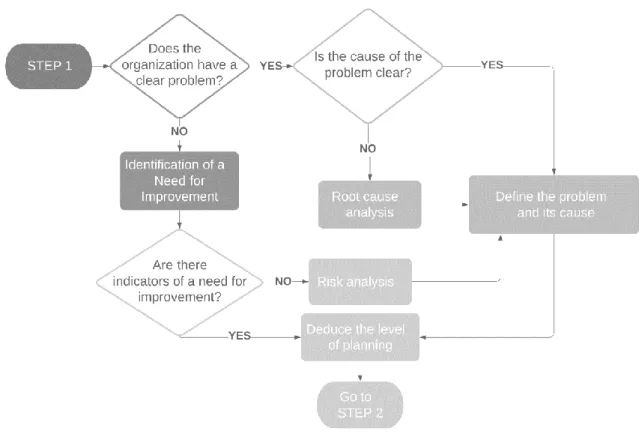
In the following figure, the path to apply the tools already explained is defined. It is considered necessary to define this path since all the tools proposed for the first step are explained but not the relationship that exists between them.
Figure 2. Flowchart to implement the first step of the framework. Source: Own elaboration
As it can be seen, if the problem is clear and also is its cause, the definition is direct and the level of planning to start with is deduced. If the problem or its cause is not clear, the tools explained above come into play as explained in the figure 2. While the risk analysis tools are used when there are no indicators of a need for improvement, the root cause analysis tools are used when the cause of the problem is not clear.
23
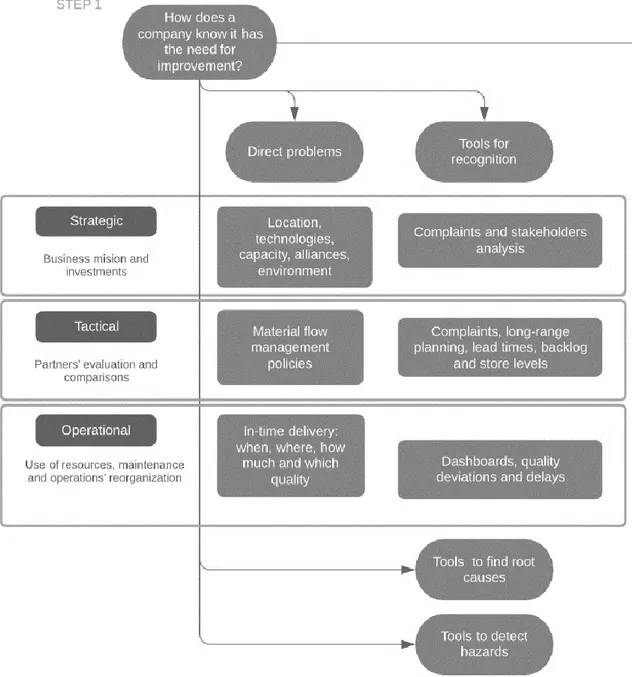
4.2.6. Summary step 1
All the explained in the 4.2 section (STEP 1) is summarized in the following figure. This figure is created to facilitate understanding and summarize all the explanations and tools explained above. At the end of the development chapter, the scheme of the three steps and with it, the entire framework is added in a single figure.
Figure 3. Structure of the first step of the framework. Source: Own elaboration
From the above figure it is noteworthy that the direct problems and the tools for identification, as in the previous sections, are classified depending on the level of planning. On the contrary, the tools to find root causes and to detect hazards are added below and are not classified since they are used to define the problem and its cause from which it is related to the previous ones to deduce the level of planning by which to begin.
24
4.3. STEP 2: Current State Analysis
4.3.1. Introduction
The Current State Analysis, also referred to as “Current State Review”, “Current State Assessment” and “State of Asset Management”, is a report indicating how an organization is running its operations today. Some of its primary benefits are listed below:
- To establish the baseline against which to benchmark the organization - To collect data as the input for a gap analysis
- To help establish the organization’s maturity level relative to a selected best practice - To help the stakeholders make an informed decision
Once the planning starting point is deduced, the current state of the company or plant in the specific level of planning is needed. Not only the current situation at the starting level should be analyzed but also, all the levels that are going to be used to find a solution to the problem found.
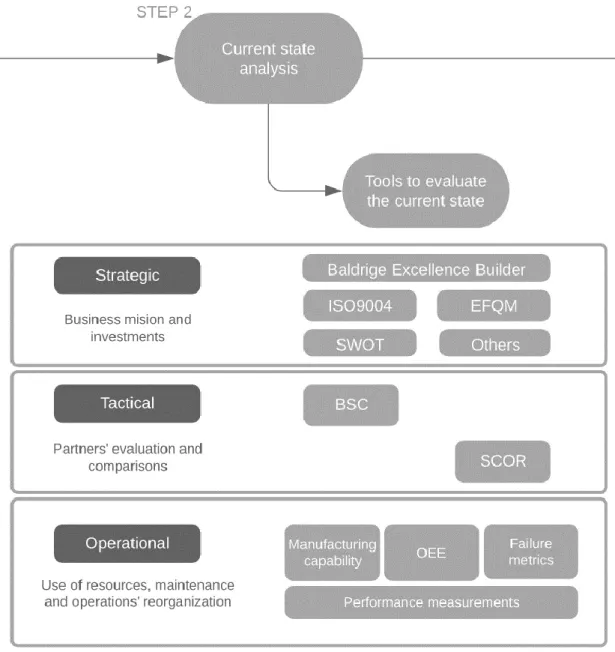
Depending on the level of planning and its corresponding time horizon, there are different types of review, as it can be seen in the Table 3. According to this table, the tools explained below seek to find out how the organization or the plant are running their operations today.
Table 3. Levels of planning and types of review. Source: Own elaboration
Levels of planning Types of review
Strategic level Qualitative: fitness to business mission and investments Tactical level Evaluation of partners and comparisons
Operational level Quantitative measures: use of resources and maintenance; reorganize operations
4.3.1.
Tools to be used at the strategic level
4.3.1.1.
SWOT
SWOT analysis is a useful technique that focuses on Strengths and Weaknesses in the internal environment and Opportunities and Threats in the external environment. This is why SWOT is sometimes called Internal-External Analysis and it helps the organization to determine where they stand within their industry or market.
In order to implement the SWOT analysis, a group from the relevant departments and a SWOT analysis matrix must be created. Then, the internal strengths and weaknesses of the business and the opportunities and threats present in the industry/market should be listed down. Finally, each bullet point should be rearranged in the order of importance and an analysis of how strengths can minimize weaknesses and fight off threats, and how opportunities can be used to avoid threats and get rid of weaknesses should be done.
25 Figure 4. SWOT analysis matrix example with questions to complete it.
Source: Own elaboration
4.3.1.2.
Baldrige Excellence Builder
The Malcolm Baldrige Quality Award (MBQN) has been introduced in the theoretical references chapter. All the information related to this tool is extracted from (Baldrige Excellence Builder, 2019).
The Baldrige Excellence Builder is used to assess the organization’s strengths and opportunities for improvement against the most important features of organizational performance excellence and to understand how well the organization is accomplishing what it is important for the organization.
• Are your processes consistently effective?
• Do your approaches address your organization’s needs? • How good are your results?
• Is your organization learning and improving?
The Criteria for Performance Excellence are a set of questions about seven critical aspects of managing and performing as an organization: Leadership; Strategy; Customers; Measurement, Analysis, and Knowledge Management; Workforce; Operations; and Results.
These questions work together as a unique, integrated performance management framework. Answering the questions helps the organization align the resources, identify strengths and opportunities, improve communication, productivity and effectiveness and achieve the strategic goals.