Improving the working routines with
outgoing articles
-
A research project at IKEA San Diego
2006
Authors: Claes Fredlund Erik Biorklund Host Company: IKEA San Diego Supervisors:
Peter Berling (Studies for production management) Lars Ottosson (IKEA San Diego)
Masters Thesis from Lund Institute of Technology (LTH) Industrial Management and Engineering
Studies for Production Management.
Abstract
The purpose of this Masters thesis is to improve IKEA San Diego’s existing working routine related to the out phasing process of outgoing articles.
At the retailer IKEA San Diego, the process of phasing in and out articles was not working efficiently. To this day there have been several problems to get the process of phasing in and out articles that approach their end date sale (EDS) to work smoothly. Management has been reluctant to act and the routines have been poorly communicated. During the last year numerous events have taken place that further demands the out phasing process to be enhanced. The IKEA Corporation is currently changing their supply strategy which affects the out phasing routines. The store is transforming its operational ownership from franchise to a corporate ownership, thus decreasing the possibilities to set prices independently. The store is missing space to ensure growth and the Logistics Department at IKEA San Diego is failing a must-pass review, where one of the main issues was – to handle outgoing articles. All these factors are related to the purpose of this thesis and have been explored and evaluated.
The research process has been executed in a cyclic and intimate manner with the sponsor company. Data have been collected through a global benchmark web survey and by continuous observation within IKEA. Once the problems have been identified and evaluated there has been a successive implementation, followed by further examination and new implementations. It is an Action Research based thesis and the method is inspired by
Cunnigham’s Organizational Development theory.
As a result of the authors work the IKEA San Diego store is now experiencing a more efficient and clear routine for how to handle the out phasing process. Administrative tasks have been reduced and improved, management have a higher awareness and a greater proactive attitude and are as result less reluctance to action. The average amount of outgoing articles has during the execution of this thesis been decreased by 35%.
Preface
A master thesis is the final phase in the Master of Science in Industrial Engineering and Management program and is equivalent to 20 weeks of full-time studying. The objective is to independently identify, analyze and solve problems by aid from earlier obtained knowledge. This process is documented in an academic report which is presented to our tutor at the university and representatives of the host company.
This master thesis has been carried out at IKEA San Diego, U.S, henceforth referred to as IKEA SD, during the spring of 2006. The purpose with the thesis has been to help IKEA SD develop and implement routines to manage the out phasing of outgoing articles.
When carrying through a project of this kind, the authors must focus both on solving the problem at hand, which is defined by the employer, and on the academic quality and theoretical foundation. This means that the demands on the report regarding theoretical stringency are higher that what would normally be the case with an industrial project. More specifically, the theoretical part of the report, the outline of the report, the planning and accomplishment of the project and the connection between theory and results must meet the academic standards set by the examining institution. Keeping this in mind, the demands and expectations articulated by the employer regarding value-enhancing results must not be forgotten. This means that it is important to carefully and continuously question the theoretical foundation so that it fits with the specified problem. It is also of utter importance to keep the focus on the given problem and to be aware of that solving the problem at hand is in no way subordinate the academic parts of the project.
Acknowledgments
We would first and fore most like to express our appreciation to the management team at IKEA SD for entrusting us with this challenging assignment. Especially, we would like to thank store manager Johnny Andersen and assistant store manager Lars Ottosson for their continuous support and ideas throughout the project. Thanks to our tutor at the Department of Industrial Management and Logistics at Lund Institute of Technology, Peter Berling, for his guidance during the process of writing this Master thesis. We are also grateful to all the IKEA logistic managers throughout the world who took the time to supply us with valuable information in our survey and without whom this thesis would not have existed. A special thanks goes out to Johan Åkerblom, McKinsey & Company, for his valuable contributions on operational change. Last but not least, we would like to express our gratitude to the entire IKEA SD logistics department for all their helpful training and feedback during this project.
San Diego, August 1st , 2006
Claes Fredlund Erik Biorklund
Table of Contents
1
Introduction
.
... 11
1.1 Background...11 1.1.1 The Company ...11 1.1.2 The Problem ...11 1.2 Purpose...12 1.2.1 Delimitations ...12 1.2.2 Target Audience...13 1.2.3 Confidentiality ...13 1.2.4 Definitions...131.3 The Structure of the Thesis...14
2
The IKEA Story ...16
2.1 The IKEA Organization...16
2.1.1 IKEA United States ...16
2.2 The IKEA Vision and Business Idea...17
2.3 Ownership Structure ...17
2.4 Franchise ...18
2.4.1 IKEA Franchise ...18
2.4.2 Franchise Freedoms and Restrictions ...19
3
Methodology... 20
3.1 Research Strategy ...20
3.2 Research Methods...20
3.3 Working procedure – Choices of strategy...20
3.3.1 Action Research...20
3.4 Working procedure - Choice of Research Methods ...21
3.4.1 Web Questionnaire ...21
3.5 Creditability...24
3.5.1 Validity...24
3.5.2 Reliability ...24
3.5.3 Objectivity...25
3.5.4 Criticism of the Sources ...25
3.5.5 The Creditability of this Thesis...25
4.1 Organizational Development...27
4.1.1 Defining the Need for Change ...28
4.1.2 Focusing and Designing a Program for Change ...28
4.1.3 Implementing the Plan...28
4.2 Implementing and Embedding Operational Change ...29
4.2.1 Understanding and Commitment...29
4.2.2 Role Modeling...30
4.2.3 Capability Building...30
4.2.4 Aligned Systems and Structure ...30
4.3 Key Performance Indicators ...30
4.4 ABC Classification...31
4.4.1 Down Side...32
5
Empirical Background ... 33
5.1 IKEA San Diego...33
5.1.1 History and Facts of IKEA SD...33
5.1.2 The Organization ...33
5.1.3 The Triangle ...34
5.1.4 Sales...35
5.1.5 Logistics...36
5.1.6 The Available Tools at IKEA ...39
5.2 The Product Lifecycle ...40
5.3 Product Range ...41
5.3.1 Analysis of Range...41
5.4 The IKEA Commercial Review...43
5.4.1 Purpose...43
5.4.2 Execution ...43
5.4.3 Commercial Review Blocks...44
5.4.4 Scoring...44
5.4.5 Background...45
5.4.6 Task of Commercial Review ...45
5.4.7 Commercial Review at San Diego (April 2005)...45
6
Defining the Need for Change ... 46
6.1 The Initial Situation at IKEA San Diego ...46
6.2 Underlying Factors ...47
6.2.1 New Discontinued Routine...47
6.2.2 Commercial Review at San Diego (April 2005)...47
6.2.3 Franchise/Corporate...48
6.4 The Problems ...50
6.4.1 Unclear Goals...50
6.4.2 Undefined Strategy...50
6.4.3 Lack of Communication and Information in the Reports...52
6.4.4 Administrative inefficiency and competence shortages...54
6.5 Collecting data ...55
6.5.1 Comparing the Results ...55
6.5.2 Analyzing Survey Results ...55
7
Designing a Program of Change ... 64
7.1 Initial Improvements...64
7.1.1 Short term strategy ...64
7.2 Long Term Strategy...66
7.2.1 Unclear Goals...66
7.2.2 Undefined Strategy...67
7.2.3 Lack of Communications ...70
7.2.4 Lack of Information in Reports...71
7.2.5 Administrative Inefficiency...77
8
Implement the Plan ... 78
8.1 Unclear Goals...78 8.2 Undefined Strategy ...79 8.3 Lack of Communication ...79 8.3.1 Performance board...79 8.3.2 Reports ...80 8.4 Administrative Inefficiency ...80
8.5 Suggested and Upcoming Implementations ...80
8.5.1 Ranges Size ...80
8.5.2 Knowledge Recruiting...81
8.5.3 The KPI Report...81
9
Results ... 82
9.1 Price Investments...82
9.2 Articles with past EDS...83
10
Sources... 85
10.1 Published sources...85
10.2 Electronic sources...85
10.4 Interviews...87
11
Appendix... 88
11.1 Appendix 1 –The Survey ...88
11.2 Appendix 2 – Introduction Letter to Survey ...99
11.3 Appendix 3 – Discontinued Routine ...101
11.4 Appendix 4 – Research Methods...103
11.5 Appendix 5 – Internet Promotions...115
11.6 Appendix 6 – KPI Evolution...116
11.7 Appendix 7 - GADD ...118
11.8 Appendix 8 – Internal Service Protocol ...119
11.9 Appendix 9 – Inventory Form...121
Tables
Table 5-1 Business Areas in the Store...35
Table 5-2 Range characteristics world wide ...41
Table 5-3 Benchmarking Area vs. Sales...43
Table 6-1 defining the need for change ...49
Table 7-1 Designing a program of change ...66
Table 11-1 Quantitative Data...112
Table 11-2 Comparison Quality and Quantity Data...114
Graphs
Graph 5-1 IKEA SD compared to other IKEA's ...42Graph 6-1 Range Size Markethall...56
Graph 6-2 Logistics Experience ...56
Graph 6-3 Average weekly sales < 1...57
Graph 6-4 Time spent on outgoing reports...58
Graph 6-5 Graphs in KPI report...58
Graph 6-6 Specific follow up ...59
Graph 6-7 Left to take strategy...59
Graph 6-8 Trading Left to take quantity ...60
Graph 6-9 Communication throughout the store...61
Graph 6-10 Cooperation aspects...62
Graph 6-11 Actions in relation to EDS...63
Graph 7-1 Example of tracking KPI’s...72
Figures
Figure 2-1 0wnership structure and organisation of the IKEA Group ...17Figure 3-1 Participants Benchmark Survey ...22
Figure 4-1 Outline Organizational Development ...27
Figure 5-1 IKEA San Diego Organization...34
Figure 5-2 Sales per Department FY05 ...36
Figure 5-3 Temporary Logistics Department at San Diego...37
Figure 5-4 New Discontinued routine. ...40
Figure 6-1 Outline Organizational Development ...46
Figure 7-1 Relation volume value for outgoing articles...65
Figure 7-2 Performance Board...71
Figure 7-3 Example of outgoing report...74
Figure 7-4 Example of outgoing report on article level ...75
Figure 7-5 ABC classification...76
Figure 7-6 ABC timeline ...77
Figure 8-1 Implement the plan ...78
Figure 9-1 Price Investments during FY06………...81
Figure 9-2 Outgoing Articles with past EDS.………...82
Figure 11-1 Cunningham’s Feedback loop………...107
Figure 11-2 Flow Chart Questionnaire…….………..110
Figure 11-3 Individual Follow Up on the KPI report……….117
Figure 11-4 The Outgoing Report introductory page………...122
Figure 11-5 Overview on Business area level (BA) or Store Level………..123
1 Introduction
.We start the thesis by introducing the reader to the background of the host company as well as the problem
faced by IKEA SD. We then state the soul purpose of the project in addition to the delimitations that apply to the project. Finally we describe some key words that are frequently used in this thesis and the target audience for whom this thesis is aimed.
1.1 Background
1.1.1 The Company
The Swedish furniture retailer IKEA has made its name world wide by offering a brand that stands for clean, green and attractive design as well as value for money. It is as potent today as it has been at any time in more than 50 years in business. It has unlike many of its competitors managed its international expansion without stumbling and is currently facing its most rapid growth ever.
IKEA SD was opened in 1999, 13 years after the first IKEA store was opened in the USA. During its first 7 years of business it was categorized as a franchise store which implied that it was owned privately and had some restricted freedom, compared to other corporately owned IKEA, in terms of pricing. The store was initially managed by an experienced team of IKEA manages who accomplished the highest local Market share of all the stores in North America. The Down side of this, sometimes, aggressive sales focus was that it inevitably led to a build of outgoing articles and other articles that lost its attention due low gross margin or lack of sales.
1.1.2 The Problem
IKEA has a vision "To create a better everyday life for the many people". A big part of this goal is fulfilled by offering the customer a vide array of products and continuously renew their assortment. The goal is to replace 30% of their range on a yearly basis. Renewing the product range implies two critical processes; phasing out articles, and phasing in articles. If these two aren’t synchronized there will be consequences in terms of excessive stock or shortage of stock which ultimately will be damaging for the business.
At IKEA SD the out phasing process had been an issue for a long period. There were several factors contributing to this problem which together formed the foundation of this thesis.
First, a new corporate routine to make the in- and out phasing process of articles more cohesive had been gradually implemented on a corporate level which required a new approach and monitoring from the individual stores.
Second, at IKEA SD the out phasing process had been an issue for a long period. This was pointed out by an internal quality review where IKEA SD’s Logistics department failed and the main contributor to this was an unsuccessful out phasing process.
Third, the store is handling a turnover that, according to IKEA standards, would be suitable to a store with a warehouse 30 % bigger then the existing one. This makes space very expensive; hence it is critical to have a minimum quantity of old articles.
Fourth, IKEA SD had been a Franchise store, privately managed since its opening but had recently initiated a 2 year transformation in order to change back to a corporate ownership structure. This change unavoidably would imply a shift in pricing strategies and gross margin focus. As a Franchisee there was reluctance for price investments (discounts) at the store which made the out phasing process slower and more difficult.
1.2 Purpose
The main purpose of this Masters thesis was to improve IKEA SD’s existing working routines related to the out phasing process of outgoing articles. The improvements found through the research were implemented continuously in order to make important adjustments as early as possible. By working closely with the management in the store, educate them and increase the information flow it would be possible to improve the process.
1.2.1 Delimitations
The research of this thesis was demarcated to primary manage the improvements of working routines for the IKEA SD store. This was done since the IKEA Corporation as an organization consists of very heterogenic group of stores with different prerequisites and possibilities. To investigate the entire company as an entity would therefore implicate the quality of the suggestions while making the improvements for all the stores, in some cases, less effective. This is not excluding the possibility of our research to be a valuable instrument
1.2.2 Target Audience
There are two main target groups for this thesis. The first target group is the management group and employees at IKEA SD, with the ambition to use our research to enhance their everyday work with outgoing articles. The second group is students at Lund Institute of Technology, Lund School of Economics and other Universities that have an interest in logistic strategies, organizational changes etc.
1.2.3 Confidentiality
As a result of the IKEA confidentiality policies the entire scope of the research will not be presented in this version of the thesis. This implication will in no way compromise the educational or academic value of this Masters thesis.
1.2.4 Definitions
Term Definition
End Date Sale (EDS) A specific date when an article goes out of the regular range.
IKEA SD IKEA San Diego.
Outgoing article Article with a specified End Date Sale.
Triangle IKEA expression referring to the core
departments (sales, logistics and communication and interior design)
KPI Key Performance Indicator.
Left to take Committed volume of articles that are left to take from a supplier.
Locally priced Dollar/ Price investment The stores price (local) compared to Corporate. Expressed in Dollars or %.
Split quantity that is divided among the stored
according to a certain criteria (e.g. sales history)
Showroom IKEA’s furniture section in the store where
furniture is displayed in room settings and in displays.
furniture..
Order point A periodically or dynamically calculated quantity
of stock against which (available stock + on order - reserved stock) is continuously checked. When available stock equals or is less than order point a replenishment order is triggered.
Overstock Articles with 15 weeks stock or more, based on
average weekly sales.
Average Weekly Sales(AWS) The average sales for an article, measured as moving average over the last 4 weeks.
Based on hand (BOH) The number of items of a particular article, currently in the store
IoS IKEA of Sweden
Business Area (BA) The IKEA range is dived in to three levels where the highest level is (BA)
Showroom The area in the store the furniture is displayed.
The product is then either sold in self serve (where the customer picks up the merchandise himself in the warehouse) or full serve (where the merchandise is handed out by a co-worker).
MarketHall The area is where all the non furniture are sold,
here the sales location is at the same place as the display.
Sales Method The sales method (0,1,2) relates to where in the
store an articles has its “home”. This can be Marketplace (0) , Self serve (1) or full serve (2) .
1.3 The Structure of the Thesis
Chapter 1 introduces the reader to background of the thesis while providing a
Chapter 2 gives an overview of the IKEA organization structure in addition to describing
the company’s business idea in closer detail.
The methodological considerations are presented in Chapter 3. Here the authors present the research strategy and methods applied in this thesis followed by a more practical description of how the research was conducted.
Chapter 4 introduces the reader to Cunningham’s Organizational Development theory used
as a platform for the research and other relevant theories, mentioned in the thesis.
In Chapter 5 the authors describe the empirical background of the problem by explaining the organizational structure of the IKEA SD store and the operational systems available.
In Chapter 6 the shortcomings of IKEA SD is discussed and analyzed together with suggestions for improvements.
Chapter 7 describes the development of new tools and routines in order to improve the
results and working procedures.
Chapter 8 is dedicated to explain how the developed tools and routines were implemented
into the IKEA SD organization. The authors furthermore give suggestions for future implementations.
2 The IKEA Story
This chapter will give the reader a short summary of the IKEA organization and culture. We will also discuss the structure of the company as well as trying to describe the diversities between the different franchise concepts.
2.1 The IKEA Organization
The basic IKEA concept was founded over 60 years ago, by a then 17 year old Ingvar Kamprad. He initially started his business by selling products like pencils and Christmas cards to people in his surroundings and shortly after by mail order to customers all over Sweden. The company has since then grown to be considered a retail phenomenon with over 229 stores in 33 countries and with annual sales close to $16 billions (IKEA GROUP). Despite this Ingvar has made sure that the company will never loose touch with its roots, naming it after an acronym for Kamprad's initials and the farm he grew up on, Elmtaryd, in the village of Agunnaryd. Everyday over one million people worldwide come to IKEA to shop from their low price, yet fashionable merchandise. (Kamprad 2003)
2.1.1 IKEA United States
The first American IKEA store opened its door in 1986. The traditional inauguration ceremony of “log sawing”1 was taking place in Philadelphia and the success was a fact. After this 25 new stores have opened in the US and they are planning on expanding aggressively in the next 10 years with approximately 5 new store openings every year. This has left IKEA United States on the second place when looking at IKEAS biggest markets with 11% of their total sales, beaten only by Germany with 19%. By contrast, in Europe, a market of comparable size, IKEA has over 160 stores, accounting for more than 80% of its total turnover. In the United States, as in all other foreign countries, IKEA makes the most of its image as an exotic Swedish store. It keeps the Swedish names on all its products and is famous for the Swedish meatballs served in its in-store restaurants (Intranet, The Economist).
2.2 The IKEA Vision and Business Idea
Ikea vision has ever since the start been to "To create a better everyday life for the many people" with a business idea of “offering a wide range of well-designed, functional home furnishing products at prices so low that as many people as possible will be able to afford them”. This is done by urgently committing to activities like using inexpensive materials in a novel way and minimizing production- and distribution costs as way of keeping retail costs to a minimum. IKEA has also cleverly found the one step in the supply chain where there are no possibilities of economics of scale, the assembly. This way the customer contributes his/her part of letting IKEA offer an “every day low price” (Intranet).
2.3 Ownership Structure
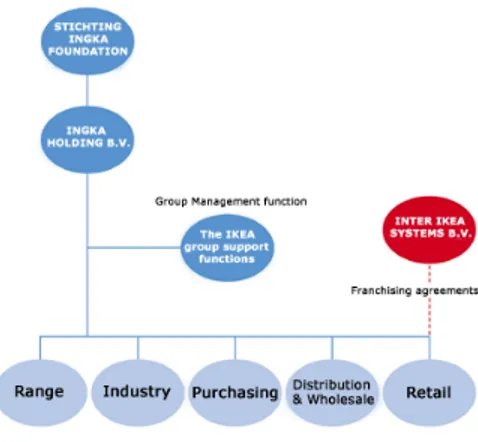
The founder of IKEA, Ingvar Kamprad, has been eager to create an ownership structure and organization, illustrated in fig 2-1, which stands for long-term independence and security. To do this he have had lawyers working continuously for many years to create a labyrinth like owning structure. Or like a journalist from “The Economist” (2006) recently put it:
“Few tasks are more exasperating than trying to assemble flat-pack furniture from IKEA. But even that is simple compared with piecing together the accounts of the world's largest home-furnishing retailer”
Figure 2-1 0wnership structure and organisation of the IKEA Group
The IKEA Group is owned by a foundation called, Stichting INGKA Foundation, which is registered in the Netherlands. The foundation owns INGKA Holding B.V who is the parent company for all IKEA Group companies, from the industrial group Swedwood to the sales companies that own the stores in the various countries.
Inter IKEA Systems B.V, who is the owner of the IKEA concept and trademark, has franchising agreements with every IKEA store in the world. The IKEA Group is the biggest franchisee of Inter IKEA Systems B.V. (Intranet)
2.4 Franchise
2.4.1 IKEA Franchise
Utmost Responsibility for IKEA’s franchise concept belongs to inter IKEA systems BV. Besides being the owner and evolver of the IKEA concept, it’s responsible for granting franchise agreements with all stores, whether IKEA franchise or external franchise (Kamprad 2003). To simplify the description of IKEA’s, sometimes maze like owning structure, Hans Skalin, moreover the architect of the creation, divided it into two colors (Kamprad 2003).
In the blue group the stores are owned by the IKEA Group and are operated by IKEA International. The IKEA group is the single largest franchisee with 207 stores. In this group it’s possible for store managers to become part owners by buying out a maximum of 49% of the store, becoming a sub-franchisee. These types of agreements can be implemented either as a pension plan for old store managers, or as way of increasing the incentives and efficiency at a store. These agreements are restricted by a pre defined time frame. (M. Baron)
The red group consists of stores that are 100% owned by external franchisees. These stores
are governed by inter IKEA systems BV, who also decides where they can locate.
They can usually be found in countries with smaller markets and higher uncertainty. This is done in order to reduce risk, maximize growth and to develop business in small and exotic markets (P. Wendshlag)
At present date, IKEA has 28 stores like these in 15 countries/ territories worldwide. These are Australia (1), the United Arab Emirates (2), Greece (2), Hong Kong (4), Iceland (1), Israel (1), Kuwait (1), Malaysia (1), the Netherlands (1), Saudi Arabia (2), Singapore (1), Spain (3), Taiwan (2), Turkey (1) and the USA (1).
2.4.2 Franchise Freedoms and Restrictions
Depending on the degree of franchising, the IKEA stores have different levels of independency. The more externally franchised the more possibilities to set local prices and decide what to carry in the store. But at the same time it implies less integration with other stores and also fewer services supplied from the IKEA Groups Service Offices. The franchisee is solitary responsible for the construction of the store, marketing and other expenses. The calculated return on investment (ROI) is 5 to 10 years depending on the size of the store and market. All stores pay a franchise fee is 3% on the total yearly turnover. When the stores decides to purchase this franchise owning concept they {at the same time} get clearance to all the information and knowledge {collected} by Ingvar Kamprad and his coworkers over 50 years. Included in the agreement are not only seminars, education, and management in order to educate the coworkers in the “IKEA Way” of working, but manuals that sometimes, strict, sometimes with strong recommendations, tells you how to run and plan your store (Kamprad 2003).
3 Methodology
This chapter helps the reader to understand how the authors have executed their research and what strategies that have been adopted. It only covers the methods and strategies that were applied, while a more general overview of the methods evaluated can be found in Appendix 11.4.
3.1 Research Strategy
In order to gather results in an efficient way, a research strategy had to be adopted. It was important to distinguish between strategy and method. The strategy is the systematic way an action plan is designed whereas the methods are the tools used to accomplish the purpose of the strategy. To gain a deeper understanding of the different concepts an overview of evaluated research strategies is presented in appendix 11.4.
3.2 Research Methods
When collecting information, one or more of several approaches can be used. Each method has its own advantages and disadvantages and this must be carefully considered when deciding upon which method to choose. The chosen research methods should reflect the expected type of results. A background to research methods can be found in appendix 11.4.
3.3 Working procedure – Choices of strategy
3.3.1 Action Research
The first period was dedicated to gather as much information as possible regarding the routines in progress, on handling outgoing articles, and to find the reason why the current process was failing. This was done in order to understand the underlying aim with the Master thesis project and to get the information needed to decide on what research strategies and methods to use. For this purpose a number of semi structured interviews where conducted. Additional information where collected through observation of the day to day work as well as more informal conversations with the managers and co-workers. Once a clear picture emerged of the problems, the authors decided on what research strategy to use. Due too the real-world nature of the problem as well as the drastic need for change the choice fell on Action research. An important part of the thesis was the implementation
process which benefited the sponsor company in terms of proven results and the academy through empirical findings. It was the author’s opinion that when the study was done in so close relation to the research object, Action Research was the most appropriate method. It was requested to have implementations done quickly and that further motivated the use for this approach.
The Action Research strategy is, according to Denscombe (1998), considered the most effective when it comes to addressing problems and making a difference in terms of bringing about actual improvements in practice. The chosen theoretical platform, Cunningham’s theory of Operational Development, is explained in Chapter 4.1. The different steps of his theory are then followed from the analysis (Chapter 6) to the implementation (Chapter 8).
3.4 Working procedure - Choice of Research Methods
In order to gather as much relevant data as possible the authors used a combined research methods, referred to as triangulation, with a heavy focus on a web survey conducted globally within IKEA combined with interviews and observations. Another reason for combining 3 different research methods was that the methods complemented each other and resulted in elevated data quality.
3.4.1 Web Questionnaire
The survey was carried out as a benchmark questionnaire, with a focus towards qualitative data, in order to gather “best practice” examples on handling outgoing articles. The main question that the authors had in mind when constructing the questionnaire was: Is this
information relevant for the day to day work with discontinued articles in our store, and will it make us more efficient. This resulted in an online questionnaire on the IKEA intranet, consisting of 45
questions all carefully chosen to serve the purpose of this thesis. The questions were divided in to 4 Sections depending on responsibilities.
Section A: General Information (Q:2-8) Section B: Logistics (Q:9-26) Section C: Goals and Commitment (Q:27-36)
The questionnaire was posted on the 8th of March 2006 and a cover letter was send out to the Logistic managers at all the selected stores. The answers where collected three weeks later. A copy of the questionnaire can be found in appendix 1.
42 79 230
Respondents Sample size
Population
Figure 3-1 Participants Benchmark Survey
3.4.1.1 Sampling
In order to gather accurate and relevant information with the survey, the authors went trough a rigorous screening process. The sampling method used in this thesis can be classified as the non-probability sampling, Purposive sampling, and the criteria used to distinguish the interesting stores was based on turnover(m3)/store size(m2). This resulted in a sample of stores that faced similar precondition and problems as IKEA SD. One justification for non-probability sampling techniques, according to Denscombe (1998), stems from the idea that the research process is one of ‘discovery’ rather than the testing of hypotheses. This approach was popularized by Glazer and Strauss (1967) and, in various reformulations, provides a foundation for the distinct approach to sampling which characterizes qualitative research.
Also included in the sample was a couple of “good example stores” that was working really well with their outgoing routine and thereby were interesting due to their extensive knowledge. The original population of the 230 IKEA stores worldwide thereby got reduced to a sample of 79 (see Figure 3-1).
3.4.1.2 Sampling Errors
One of the disadvantages of non-probability sampling is that sampling errors can’t be calculated. Sampling error can be described as the degree to which a sample might differ from the population. When inferring to the population, results are reported plus or minus the sampling error.
3.4.1.3 Response Rate
When launching the survey the authors send out a personal cover letter, together with a link to the survey, by the use of email. The cover letter can moreover be observed in appendix 2. In this letter the author, more profoundly described the background and purpose of the survey. They also described the reason why the different stored had been chosen as well as the confidentiality policy. Two weeks after the release of the survey a follow-up letter was send out to the non-respondents in order to increase the response rate. This was also done via email due to the geographical diversity of the sample. To increase the incentives to participate, all the respondents where promised a copy of the final answers. They were furthermore offered a summarized report, based on the questionnaire and a couple of in depth interviews with some of the respondents that did a particularly good job, offering suggestions and recommendations on how to work efficiently with the out phasing of outgoing articles. They where lastly assured full anonymity in regards to their individual answers.
The final response rate was determined to 51% (42 stores) which can be regarded as a satisfactory result for this kind of study.
3.4.1.4 Analysis
The survey was initiated by asking the respondent a couple of general question like range size, number of years with logistical experience and number of articles with past EDS based on hand etc. This was done in order to create a foundation on which the authors could filter the answers in order to draw relevant conclusions. The survey was then designed to address how the different parts of the organization worked with their outgoing routine. analysis
The tool used for the intranet web survey allowed the authors to instantly see how many and what the respondents had answered. It also highlighted the alternative that had the most
answers, making it easy to quickly draw accurate conclusions. Since the authors main focus was to accumulate information significant for the IKEA SD store it was important that the answers received where studied, not as a unity, but compared against the separate answering stores. This was done since important factors like range size, store size, stock value etc would have a big impact on the conclusions drawn from the answers. As a complement to the survey result additional information on the answering stores were gathered in order to shine some more light on the different situations faced by the participants. This was generally done through the IKEA Intranet or by accessing IKEA databases that contained up to date information on all stores. In addition to this the authors contacted the four stores, considered to be working most efficient with outgoing articles, for further in depth interviews. All the participating stores were also encouraged to send any local reports used in their continuous work with outgoing articles. These reports were then evaluated by the authors and, if passing the screening process, posted in a folder shared with all the participants.
3.5 Creditability
As with any kind of research, the methods and conclusions needs to be justifiable and critically reviewed .This segment aims to explain the terms validity, reliability and objectivity. Furthermore the authors will discuss the sources of errors and the creditability of this thesis.
3.5.1 Validity
In a broad sense, validity means that the data and the methods are right. Validity addresses the question, ‘Are we measuring suitable indicators of the concept and are we getting accurate results?
3.5.2 Reliability
A good level of reliability means that thee research instrument produces the same data time after time on each occasion that it is measured and that any variation is only due to the variation in the thing being measured (Denscombe 1998)
3.5.3 Objectivity
To be objective means to minimize the researchers influence on the final research result. But with qualitative research the researcher’s self, as we have argued, is an integral part of the research instrument. Therefore Denscombe argues that the analyses of qualitative date calls for a reflexive account by the researcher, concerning the researchers self and its impact on the research. This means that the researcher in order to attain objectivity must be able to distinguish facts from values and be aware of the importance of adaptability and comprehensiveness.
3.5.4 Criticism of the Sources
In order to be able to make use of various different types of information material, users must be able to critically scrutinize and assess the material using traditional source criticism. They must, in other words, assess the genuineness of the source, which is responsible for the contents, the aim of the publication, and whether it is sufficiently current to be of any use. They must also be able to judge the information on the basis of their requirements in any given situation (lub.se).
3.5.5 The Creditability of this Thesis
Since the authors of this thesis used a combination of different research methods, commonly referred to as triangulation, they thereby enhanced the validity of the result.
A satisfactory level of reliability was furthermore secured throughout the interviews by using a semi structured approach as well as taping them for future documentation. Also the academic literature referred to in this thesis can be can be regarded as objective and valid because of their theoretical character. In order to increase the reliability of the survey results the authors carried out a thorough examination of all the participating stores prior to the launch of the questionnaire. They also tried to reduce some bias in the answers by using a randomized response scale. In order to further secure the creditability of the answers a copy of the results where send out to all the respondents. However, the size of the investigated sample and the number of stores answering could be considered to small to be classified as a representative selection and therefore reducing the creditability of this thesis. The fact that the two authors worked as a team throughout the process of data gathering and analyzing
can however be considered as an effective way of preventing biased thoughts that could possibly affect the result negatively.
A substantial part of the primary information was gathered within the organization of the sponsor company. This narrowed the scope and breadth of independency and might have limited the holistic view that needed to be visualized. However this lack diversification in information gathering was justified by the current time frame faced by the authors.
Any further possible misunderstandings between the interviewers and the interviewees might have compromised the validity of the result.
4 Theory
In this chapter a theoretical framework for organizational development is introduced to the reader which represents the platform for the executed research. The authors also discuss different theories concerning implementation of organizational change and in the end of the chapter different tools and measures to manage change are discussed.
4.1 Organizational Development
The chosen research strategy was as described in chapter 3.3 “Action Research” based on Cunningham’s theoretical platform. Cunningham (1993) presents a theory of key factors within organizational change and development where the process of change is divided into three phases: defining the need for change; designing a program for change; implementing the plan.
1
2
3
Define the need for change
Design a program of change
Implement the plan
Locate problems and Identifying the needs
for change Identify strategic direction Develop an ongoing process of evaluating, updating
Evaluate and improve The new design Outline strengths and weaknesses Identify and evaluate Values and develop a vision Develop an action plan
Test the design Collecting and Reporting data Sorting information
Into categories
Figure 4-1 Outline Organizational Development
The three phases are then broken down in detail where each one consists of a number of suggested steps. The description below is a selection of the suggested steps by Cunningham combined with the input from consultant experts to ensure that the approach was fit for the assignment. This was done to enable a clear focus and limit the research to its core, the organizational and operational transformation.
4.1.1 Defining the Need for Change
Defining the need for change involves: (1) identifying the problems and needs for change, (2) collect information and sort it into categories and (3) collecting and reporting results.
4.1.2 Focusing and Designing a Program for Change
The data gathering or assessment phase of any transformation project can be considered a statement of the need for change. The initial focusing steps and design face, on the other hand, can be considered the encouragement that the organization’s needs in order to meet and discuss the most appropriate changes. This consists of a process where tack groups meet and discuss topics related to: (1) outlining strengths and weaknesses within the organization, (2)Identify and evaluate values and develop a vision, (3) Develop an action plan, (4) Test the design.
4.1.3 Implementing the Plan
The implementation sequences generally involve taking the newly designed “Program of change” and then develop plans and procedures for carrying it out. It involves (1) identification of strategic direction, (2) develop an outgoing process of evaluating and updating and (3) evaluate and improve the new design.
The integral and most difficult element of getting commitment to projects is to allow individuals to articulate them in relation to their roles and responsibilities. In conventional “top-down” planning, goals or objectives are usually performed at the beginning of the process; it is the step on which all steps are based, not the product of those steps. This is the crucial point of the whole process. Action Research focuses on defining workable strategies and implementing them by creating opportunities and reducing restraints. It is a ‘bottom-up” process of developing goals and objectives based on participation and involvement.
Commitment does not only involve the sequence or events for carrying out a project. It also involves understanding who in the organization must be committed to be the change and carrying it out. This is an understanding of the politics of the change. (Cunningham 1993)
4.2 Implementing and Embedding Operational Change
Operational performance improvement programs have earned a bad reputation since they tend to fail. Many deliver temporary gains but few succeed in sustaining the early benefits, and fewer still manage to establish a genuine culture of continuous improvement. To achieve lasting behavioral change, Drew, McCallum and Roggenhofer (2004) argue that managers need to ensure that four interrelated factors are in place: “understanding and commitment”, “role modeling”, “capability building” and “aligned system and structures” (see Figure 4-2 - Conditions for lasting behavioral change). These factors, they continue, can serve as a checklist for the organization by having the coworkers asking themselves the related questions at the given point in the implementation process, in order secure success.
Understanding and commitment ‘…I know what I need to change and I want to do it’
Role modeling ‘…I see my leaders behaving differently’ Capability building ‘…I have the skills to behave in the new way Aligned systems and structure ‘…the systems encourage me to do so’
‘I will change my behavior if …’
Figure 4-2 - Conditions for lasting behavioral change
4.2.1 Understanding and Commitment
Ensuring that people both understand the need for new ways of working and are truly committed to making them happen is central for embedding change in the organization. It is furthermore important that those who bear the consequences of change have ownership of the outcome and take part in meaningful work in order to bring that change about. Change that is a joint effort rather than an imposition from superiors stands a better chance of gaining cooperation and generating enthusiasm.
4.2.2 Role Modeling
The management team must shape the culture by setting expectations about employees’ behavior. In any organization most people take their cue from people with power and influence, and are much more likely to modify their behavior if they see change being modeled by those at the top. For this to work, the leaders must work closer to the front-line. (Reinforce the importance creates wider acceptance)
4.2.3 Capability Building
Any major change effort is bound to stretch both the individuals involved and the organization as a whole. In the process, it will bring to the surface latent skill gaps. To develop the right operational skills, the organization needs to add two core elements to it management infrastructure: a management process that identifies and codifies the skill sets required to manage the operation, and a set of programs (training courses, on-the-job-coaching and feedback) that will support the building of these skill sets and their associated administrative systems.
4.2.4 Aligned Systems and Structure
A big part of the commitment process can be secured by having the right incentives in place. If the staff don’t benefit, management is unlikely to sustain the extra commitment and involvement that will be needed to make the new leaner routines work. The way that people think and act and the systems within which they work need to change at the same time. If systems don’t change to address the root causes of operational problems, people will quickly become frustrated by the gulf between what they are being asked to do and the reality of their everyday experience. On the other hand, if the operating system and management infrastructure have been redesigned but people aren’t fully engaged with the effort, any improvements will eventually unravel.
4.3 Key Performance Indicators
Key Performance Indicators (KPI) is financial and non-financial metrics used to quantify objectives to reflect the strategic performance of an organization. These commonly used calculations can help find areas where an organization can improve and increase profits, or warn of potential problems before one runs into serious trouble.
Rock (1995) argues that the uses of key performance indicators are of particular importance when analyzing trends and when measuring efficiency. He also emphasizes on the fact that these metrics can be a valuable planning tool when working towards goal expressed as key performance indicators and when prescribing a course of action.
Furthermore Eccles (1991) argues the importance of tracking non-financial measures and reinforces the use of these competitive strategies with the statement:
”What gets measured gets attention”.
His point is that the leading financial indicators of business performance has been incorporated into the modern society to the point that they are implicit and thereby percept as more important. This, he considers, can be contradictory and hazardous since metrics like quality, customer satisfaction and market share often reflect a company's economic condition and growth prospects better than its reported earnings do.
The leading indicators of business performance cannot be found in financial data alone.
4.4 ABC Classification
ABC classification is the most widely used methodology to organize and classify articles, due to its ease of data collection, understanding, and limited subjectivity. The application of ABC classification for articles involves grouping them into three simple categories. The categorization requires determining the measurement criteria (e.g., total costs, total volume, and total retail value) and then grouping the articles into A, B, or C depending on these values (Supply Management).
A = Close inventory control (continuous). B =Moderate inventory control (less stringent). C = Low scrutiny inventory control (periodic review).
The original strategy is to order the usually more expensive A articles as often as possible while making the safety stock as small as possible. In the same way C articles should be ordered more seldom while allowing a bigger safety stock. By implementing this differentiated stock control it allows an organization to keep a better overview of their range
while prioritizing the allocations of their scarce resources. The real benefits of this classification are usually not observable unless you have a large number of articles.
4.4.1 Down Side
The disadvantage of the described ABC-classification is that the articles will only be ranked by means of one criterion. This leaves out circumstances where C-articles truly should be ranked as an A article. This could be in situations where you have related articles that are sold together and where you would like to keep a similar service level (Aronsson, Ekdahl & Oskarsson).
5 Empirical Background
In this chapter we will elucidate the history of the IKEA SD store and its organization.We will also discus the basic concept of its business in order to give the reader a comprehensive overview.
5.1 IKEA San Diego
5.1.1 History and Facts of IKEA SD
IKEA SD was opened in September 2000, its result the first year was $81 millions, a result initially planned to be reached after the 5th fiscal year. Today the store is one of the most profitable stores in North America with sales closer to $96 millions and with the highest local market share in the US. The goal is to reach $100 during the FY06. The store currently employs a total of 300 coworkers of which 22 are in management positions. Out of the 300 116 are in full time positions and 148 in part time positions. In 2004 the store had 2.5 million visitors from which 1.18 million where converted into customers, implicating a conversion rate of 46% and an average sales per customer just exceeding $81.
5.1.2 The Organization
The Organizational structure of IKEA SD is of a functional nature (see Figure 5-1). Head of the operations is the Store Manager with the ultimate responsible of the store. Following Managers are reporting directly to him: Assistant Store Manager, Marketing Manager and 10 different Business Managers. The Business Managers (BM) are responsible for a specified function, either a primary activity, such as logistics, operations, sales, Communication & Interior Design (Com&In) and services or a support activity such as, Human Resource and controlling. Subordinate to the Business Managers are several Department Managers with more specified tasks.
This flat structure favors the decision process with a narrow distance from the top to bottom. A common disadvantage of this functional structure is a lack of communication between the different departments. To prevent this, IKEA is emphasizing a lot on the communication between the three core departments referred as the triangle.
IKEA San Diego Organizational Chart 1/2006
Store Manager
BM Furniture Showroom BM Marketplace BM Operations BM CustomerService BM Human Resources
DM Logs Adm BM Logistics DM Warehouse DM Receiving DM Replenishment DM Cash Office DM FSHO/Home Delivery/Carts DM Call Center Ballroom DM Returns DM Loss Prevention DM As-Is/ Recovery Open DM BA 50/Activities DM BA 6/ BA10 DM BA 8 DM BA 9 DM BA 1/ BA 2 DM BA 3/ BA 40 DM BA 4 BM Furniture Showroom Small Business DM BA 5 BM Self-Serve Warehouse DM Self-Serve Warehouse DM Bistro DM Foodservice Restaurant BM Comm-In DM Comm-In Furniture Showroom Open DM Comm-In Marketplace Marketing BM Food Services
HFC PTAG Maintenance Payroll Recruiting Training/IT
Human Resources Manager in training DM Accounting Asst.Store Manager - Controlling - Customer Services -Logistics -Operations
Figure 5-1 IKEA San Diego Organization
5.1.3 The Triangle
There are three main departments in the store: the sales department, the logistics department and the communication and interior department (Com&In). Together, these three units set the goals within the store. As an internal expression within IKEA, they are usually referred to as the trinity (Europe) or the triangle (U.S).
Communication between the 3 parts of the triangle is essential in order to reach each department’s goals as well as the store’s. The sales managers are striving to increase the sales while the logistics are focusing on achieving an optimal inventory level, minimizing costs and maximizing space capacity. The Com&In are responsible for all the decoration and communication in the store, ensuring that the presentation of the products support the forecasted sales.
To be successful in the business, there must be a balance of power and influence within the triangle. (Michael Baron)
Common visions, ambitions, goals and standards shared by all three functions
sales
com&in logistics
IKEA SD has long been considered to be a sales driven store. A number of reasons indicate so. The store has since it opened been led by an experienced team of IKEA veterans with genuine sales background. Also, the store has been franchised, giving the management incentives to maximize the gross margin, something that has been realized with a strong sales focus.
5.1.4 Sales
The sales department is divided into different Business Areas (BA’s) depending on the function group of the products (see Table 5-1). The BA’s are grouped into “Markethall” or “Showroom” depending on its character. BA1,2,3,4,5 and 40 are all a part of Showroom where the articles primarily consists of assembled furniture, displayed in different settings. BA 6,8,9,10 and 50 forms the Markethall where the articles are displayed in greater quantities (pallets or bins) and where customers can take the product instantly from the sales floor. Today there are 9 Business Area Managers covering the 11 BA’s at San Diego.
Business Area
Function
BA 1 Seating & Reclining Furniture
BA 2 Organize, Store & Display
BA 3 Sleeping and storage BA 4 Kitchen & Dining
BA 5 Work IKEA Sh owroo m BA 40 Children's IKEA BA 6 Lighting BA 8 Textiles
BA 9 Cooking & Eating BA 10 Home Organization Markethall BA 50 Oasis
Table 5-1 Business Areas in the Store
The articles demonstrated in the showroom can either be picked up in the self serve, by the customer himself, or delivered thru Full serve, depending on the article. Usually less frequent
BM Furniture Showroom BM Marketplace
DM BA 50/Activities DM BA 6/ BA10 DM BA 8 DM BA 9 DM BA 1/ BA 2 DM BA 3/ BA 40 DM BA 4 BM Furniture Showroom Small Business DM BA 5 HFC PTAG
articles and bulky items can be found in full serve (e.g. kitchens or sofas) while all the top sellers and more convenient packaged items can be purchased through self serve (e.g. shelves, chairs). When an item is bought through full serve, the customer first receives a print-out by a IKEA coworker on the chosen article that involves information such as price and quantity. The customer then brings the print-out to the cashier and proceeds to the full serve where an IKEA coworker delivers them the item of choice. The intention is to have a 80/20 split between these departments since a majority of self serve traffic implicates less handling costs and increases the efficiency.
The relation in sales YTD FY05 between showroom and Markethall is displayed in Figure 5-2 Sales per Department FY05.
Sales FY05 IKEA San Diego
68% 32%
Marketplace Showrrom
Figure 5-2 Sales per Department FY05
5.1.5 Logistics
A lot of IKEA success world wide has been said to be due to its successful logistic model. With a clear focus on low price, it has been and still is an absolute necessity to keep the logistical process effective. The first big breakthrough took place when furniture where packed, transported and delivered without being assembled. Letting costumers assemble there own products led to a significantly reduced transportation cost.
Today, the IKEA concept places great demands on IKEA stores to be rational, flexible and effective. Large purchasing volumes and long-term supplier commitments require stores to handle large volumes of goods with the quickest possible turnover rate. (IKEA Way).
In the phase before the products reach the store, IKEA distribution service makes sure all goods are transported from the suppliers to the stores, via a network of hub and spoke like distribution centrals. There are, however, an increasing number of articles that are being delivered directly from the supplier without going through the distribution centers, in order to save money and decrease lead-time. Once in the stores, in store logistics makes sure that the unloading and arrangement of goods are taken care of.
5.1.5.1 In-Store Logistics
At IKEA, thousands of products are handled daily. The movement of goods must be as efficient as possible, under all circumstances, guaranteeing service to the customers and ensuring that the products they seek are available to buy at all times. Jobs in Logistics account for about 20 -25% of each Store’s co-workers. The goal is to be in full control of the space and the volumes of goods in order to maintain uninterrupted sales. Logistics at San Diego consists of 4 different areas (see Figure 5-3 Temporary Logistics Department at San Diego).
5.1.5.2 Managing Logistics
The sheer volume of goods coming in and out of each IKEA store every day makes running a logistics department an enormous challenge. A manager in this area drives the cooperation between the sales and logistics departments, knowing how to exploit every cubic meter of space. It is also the logistics manager’s responsibility to supervise the ordering of products to the store, ensuring the correct quantities are acquired.
DM Logs Adm DM Warehouse DM Receiving DM Replenishment Asst.Store Manager - Controlling - Customer Services -Logistics -Operations DM Logs Adm BM Logistics DM Warehouse DM Receiving DM Replenishment
Today, the Logistics manager position at IKEA SD is vacant (see Figure 5-3). Instead, the Assistant Store Manager is filling in as a temporary replacement for this position. The present situation, without consistent leadership, has enforced the need of enhanced working routines within the department.
5.1.5.3 Logistics Administration
The responsibility of this department is to maintain all the administration in relation to Logistics while ensuring that the ordering process is setup correctly. They furthermore have to make certain that the Sales department and other departments are supplied with necessary information in order to the best job possible.
5.1.5.4 Receiving & Replenishment
The efficient flow of goods within an IKEA store is one of the key activities that ensures good sales and a high level of availability of goods for the customers. The goal for receiving and replenishment co-workers are to monitor and record deliveries, carefully check delivery notices, sort and separate the goods and get them on to the correct sales area or designated warehouse locations.
As part of a larger team, receiving and replenishment co-workers must then load the goods from the floor onto the stores racks and shelves. An important goal within this department is to maximize the door to floor principle, delivering pallets straight from the trucks to its sell space in order to minimize handling costs. This implies that the pre set sales space capacity of the sales location has to be correct in order to avoid back flow which would result in double handling cost.
5.1.5.5 Stock Controlling
Efficient routines for dealing with stock are an important part of successful store operations. Since there are literally thousands of goods moving in and out of the sales space and warehouse, it is a huge task to keep track of them all. The stock controller does this, establishing routines and procedures that also help keep logistics costs down. Inventory accuracy, inbound checks, and transfer types are all key aspects of the job (Ikea.com).
5.1.6 The Available Tools at IKEA
To manage the order process and goods flow of more than 80000 m3 per year there are several software systems developed to aid in this process.
The basic logistics related tools that are used in the store are following:
MHS – The very fundamental software of IKEA’s business on a store level. It contains
detailed information on article level and enables the user to print reports designed for specific tasks. It is mainly used within logistics. It allows the user to maintain and change information on the article, such as, price sales location and delivery type.
SRS – (Store Requirement System) is a forecasting system module that supports the MHS
System in the store, through the calculation of two major parameters: expected sales and the safety stock factor. By doing this the system can suggest the best possible sales space capacity. SRS furthermore administrate all the transfers and write-offs throughout the store.
WinMHS – An overview system with purpose to display basic information for sales
co-workers. It allows the user to search for an article and receive information such as price, quantity of stock, delivery history and future. The tool furthermore allows the co-workers to book out orders that are sold through “Full Serve” in order to simplify the customers shopping experience.
GADD - is controlling statistic software for managers and sales team members to view and
analyze relevant data. It gathers data from a database containing a wide range of information extracted from MHS. With GADD it is possible to export the reports to Excel and other similar programs which make it easy to work with.
Discontinued Follow Up tool – A globally developed tool accessible through intranet that
enables the user to get information on outgoing articles specified on article level. It includes what is left to receive. This is not the case in North America due to technical reasons.
Together, these different tools permit the user to gain substantial control over the gods flow and ordering process.
5.2 The Product Lifecycle
As within all business, development and renewal is of great importance to IKEA. Each year, 30% of the entire product range is renewed. The product range has to be renewed to satisfy customers and secure future growth. The demand is continuously changing and the business must be adapted to its customer needs. New production technologies and materials are constantly evaluated and developed, which creates new possibilities to improve the existing products and create new ones.
Until FY05 the IKEA range has been renewed twice a year. This has taken place after the two big sale events that are in January and July. In August the IKEA catalogue, which is distributed to +250million household, is released and it has been the strategy to ensure that the new catalogue contains a substantial part of new products. While the out phasing process of articles has occurred twice a year, the in phasing process has been taking place constantly and sporadically. However the majority of articles have been released before the catalogue release. This has created the perception that IKEA is renewing itself only once a year. To change that, a decision was taken last year to create a cyclical and distinct in- and out phasing process called Product Change Date. Starting this year (2006), the IKEA stores will renew their range 6 times a year and the new routine will incorporate the previous separate process, of phasing in and out products, to one cohesive process (see Figure 5-4). If managed properly, the potential benefits consist of less price investments and a consistently fresh and exciting product range.
Figure 5-4 New Discontinued routine.
From gaps and overlaps to a cohesive process. (The figure shows sales of outgoing articles as a
function of time)
Gap –lost sale
Overlap -Costs Outgoing New today tomorrow Aug 1st Dec 1st From To
Phasing out/phasing in as separate processes Æ Phasing out/phasing in as one Problems to Sale start due to overlap Æ Sharp sale start dates Lost sale due to gaps (turnover) Æ Not loss of sale, due to gaps Not clear communication/information flow Æ Clear/visible communication to all to the involved in the supply chain involved in the supply chain
5.3 Product Range
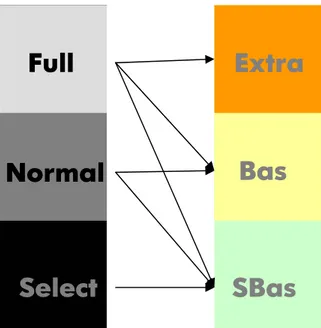
The vision within IKEA is to be able provide one range to all costumers everywhere. But until this goal is feasible the stores can, depending on size and estimated turnover volume, choose between 3 different range sizes. These are selected range, full range and normal range on a store level.
- Selected Range Stores = Only from SBAS, sales driven choice (≈6500 articles)
- Normal Store Range = SBAS +BAS Range (≈8500 Articles)
- Full Range stores = SBAS +BAS + option of EXTRA (≈9000 articles)
5.3.1 Analysis of Range
IKEA SD, is a small but densely trafficked store. The result FY05 was close to 96M$ and the budget for FY06 is set to 98M$. This expanding sales volume is consequently creating a lot of problems for the store since the space is very limited. The IKEA SD store was planned to handle half the turnover today realized. That is one of the biggest issues that the store is facing.
The IKEA range categories that are described above (selected, normal and full) are selected independently for both Markethall and show room. Table 5-2 indicates an overview of all stores world wide. There is a slight predominance of Normal stores both for Markethall and Showroom. IKEA SD carries the normal range size for both Markethall and Showroom.
Range Markethall Furniture
Selected 61 76
Normal 98 78
Full 37 34
Table 5-2 Range characteristics world wide
SBas
Bas
Extra
Select
Normal
Full
A comparison of size (m2) and sales ($) with other IKEA Stores worldwide was conducted in order to explore the unique prerequisites faced by IKEA SD. As can be seen in Graph 5-1, it was clearly indicated that the IKEA SD store was carrying a lot of articles compared to its size. According to the comparison 75% of the stores were larger (m2) than San Diego but at the same time only 20% of the stores carried more articles (# articles). The comparison also showed that 45% of the stores investigated had higher sales ($) than IKEA SD.
IKEA SD compared to other IKEA's woldwide
0 20 40 60 80 100 120 140 160 180
Size (m2) Sales ($) Stocked Range Size (# articles) # of S to res Smaller Bigger
Graph 5-1 IKEA SD compared to other IKEA's
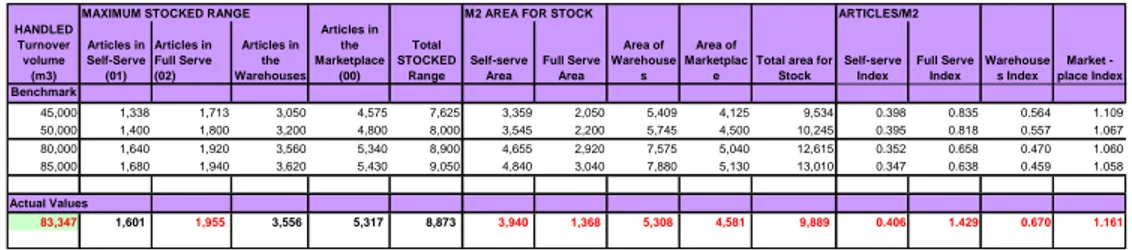
With its 17700m2 the IKEA SD store considered a small store measured with IKEA standards. Despite this fact it carries a Normal product range, which entails a few complications. IKEA SD has a very high rate of articles/m2. As can be seen in Table 5-3, all parts of the warehouse carries to many articles/m2 compared to the benchmark figures (i.e. the standards set within the corporation through Commercial Review). This lack of sales space compared to pre established standards furthermore involves a higher risk of a sold out sales location, implicating the service level for the customer. By standard a sales location in self serve should be able to room approximately the quantity relative to one week of sale. As soon as this number decreases the service level will follow.