Research
2013:01
Authors: Jonathan MullinsSSM perspective
Background
Weld residual stresses (WRS) have a large influence on the behavior of cracks growing under normal operation loads and on the leakage flow from a through-wall crack. Accurate prediction on weld residual stresses is important to make proper decisions when cracks in weld joints are detected. During the latest years, there has been a strong development in both analy-tical procedures to numerically determine WRS and experimental measure-ments of WRS. The USNRC (United States Nuclear Regulatory Commission) has formed a program for validation of WRS predictions through compari-son of numerically calculated residual stress fields in dissimilar welds mea-sured by different methods. The present report describes the results of the project with special focus on the contribution from Inspecta Technology.
Objectives
The principal objective of the project is to compare different WRS pre-dictions for a dissimilar pipe weld with careful measurements on a mock-up weld. The results of the project will make it possible to make recommenda-tions on computational procedures for WRS in dissimilar metal welds.
Results
It is concluded that numerical analysis of weld residual stresses using the finite element method is very useful for the estimation of weld residual stresses in complex geometries and dissimilar metal welds. The validation study increases the understanding of uncertainties associated with different modeling approaches and helps to identify the most sensitive parameters. Some of the conclusions related to modeling of residual stresses are:
• While there was large scatter between the predicted residual stress profiles from different analysis groups, it was also found that ca-reful modeling of material hardening and heat source description resulted in very good agreement with the experimentally measured residual stress profiles.
• In the case of nickel based weld material a modified isotropic har-dening model gave very good agreement with experimental measu-rements and is recommended for analysis of weld residual stresses. • The presence of the repair/back weld leads to significantly higher residual stress magnitudes at the inner surface than the presence of the dissimilar metal weld alone. The effect of significant repair welds on residual stress distributions should be considered.
Need for further research
More research is needed to validate predictions of other weld residual stress geometries, especially weld repairs which can have a substantial influence on the residual stress distribution in piping components.
Project information
Contact person SSM: Björn Brickstad Reference: SSM 2009/2743
2013:01
Authors: Jonathan Mullins and Jens Gunnars
This report concerns a study which has been conducted for the Swedish Radiation Safety Authority, SSM. The conclusions and view-points presented in the report are those of the author/authors and do not necessarily coincide with those of the SSM.
Contents
1 Background ... 2
2 Objectives ... 4
3 Problem description ... 5
3.1 Project Phases ... 5
3.2 Component and Geometry ... 6
3.3 Manufacturing sequence ... 8
3.4 Welding parameters and welding sequence ... 8
3.4.1 Buttering ... 8
3.4.2 Dissimilar metal weld ... 8
3.4.3 Repair/Back Weld... 9
3.4.4 Stainless Steel Pipe Weld ... 10
3.5 Measurements ... 11
3.5.1 Thermocouple measurements ... 11
3.5.2 Welding profile and shrinkage measurements ... 11
3.5.3 Mechanical properties measurements ... 12
3.5.4 Weld residual stresses ... 12
4 Modeling of weld residual stresses during mockup manufacture ... 17
4.1 Analysis steps ... 17
4.2 Heat source calibration ... 23
4.3 Material modeling... 25
4.3.1 Thermal material properties ... 25
4.3.2 Mechanical material properties... 25
4.4 Welding Simulations ... 25
4.4.1 Dissimilar metal weld ... 26
4.4.2 Repair/Back weld ... 27
4.4.3 Stainless steel pipe weld ... 28
5 Results ... 30
5.1 Comparison of Inspecta’s results for phase 1a, 1b and 1c ... 30
5.2 Inspecta’s results after welding of pipe – phase 2 ... 32
5.3 Observations regarding Inspecta’s results ... 33
5.4 Round Robin results published by NRC for all modeling groups ... 34
5.5 Model improvement following publication of residual stress profiles ... 37
6 Comparison of predicted residual stresses with profiles in the fracture mechanics handbook ... 40
6.1 42 mm dissimilar metal pipe weld ... 42
6.2 13 mm stainless steel pipe weld... 43
1 Background
Weld residual stresses have a large influence on the behavior of cracking that could possibly occur under normal operation of components. In case of an unfavorable environment, both stainless steel and nickel-based weld ma-terials can be susceptible to stress-corrosion cracking (SCC). The sustained stress state under normal operation that may drive stress corrosion cracking is typically dominated by residual stresses in the vicinity of welds. Tensile stress on the surface is a necessary condition and a primary driving force for initiation of stress corrosion cracks. The rate of the subsequent SCC growth is to a large extent governed by the residual stress profile through the materi-al. Initiation and growth of fatigue cracks is also adversely influenced by tensile residual stress. If a crack were to grow to a large size then weld re-sidual stress would influence the margin to fracture, though the influence is expected to be limited for ductile steels. Thus, accurate prediction of the magnitude and distribution of residual stresses at welds is important in order to arrive at proper conclusions when evaluating crack growth, inspection plans, assessing leak-before-break margins and in assessments of detected flaws.
The development of numerical modeling for prediction of weld residual stresses has been ongoing for several decades. In the middle of the 1990’s the Swedish nuclear industry started to develop recommended weld residual stress profiles for stainless steel pipe welds and nickel-base dissimilar metal welds [1-3]. These profiles are published as a part of the fracture mechanics handbook SSM 2008:01 [4].
Welding is a complex and challenging process to model. It involves transi-ent heat generation by differtransi-ent welding processes, melting and solidification of materials, and large plastic strain cycles which are generated over large temperature intervals. During the last decade there has been a continuous and strong development in both the procedures to numerically determine weld residual stresses and also in the methods to experimentally measure residual stresses. Particular focus for numerical methods has been on im-proved modeling of material behavior and welding heat sources. Further, faster computers have made it possible to simulate more details in the manu-facturing process.
The particular modeling assumptions and methods used during welding sim-ulation depend very much on acquired experience within the modeling group. It is therefore important to perform validation work to ensure that the modeling assumptions employed by different groups lead to realistic weld residual stress profiles. There is a need to validate the residual stress models and identify the most influential modeling characteristics, in order to estab-lish confidence in the generated results.
Based on the above situation the US NRC (United States Nuclear Regulatory Commission) has set up a program for validation of weld residual stress pre-dictions through comparison of numerically calculated residual stress fields with residual stress fields measured by different methods. The main part of the program is national, but Phase IIb in the program is an international blind round robin for validation of weld residual stress [5]. The present report describes Inspecta’s contribution to the program and general findings from the validation project.
2 Objectives
The NRC International Weld Residual Stress Round Robin is a project with the aim of validating weld residual stress calculations for a dissimilar metal weld in a pressurize surge nozzle mockup. Twelve established groups from around the world have participated in the project where detailed measure-ments of the weld residual stresses are published only after all simulation work has been completed and submitted to the NRC.
The NRC has defined the following aims for the project [5]:
Perform independent confirmatory research on weld residual stress analysis.
Improve computational procedures for residual stress prediction in dissimilar metal welds.
Assess and categorize the uncertainties in the residual stress predic-tions and measurements.
Aims for the Swedish contribution to the project include:
Further develop the methods for weld residual stress simulation, with particular focus on heat source calibration and modeling of ma-terial hardening.
Draw conclusions regarding the accuracy of the presently recom-mended residual stresses, as they appear in the fracture mechanics handbook [4].
3 Problem description
3.1 Project Phases
Weld residual stress were predicted and measured for the different welds in a pressurize surge nozzle mockup, see Figure 3-1. Residual stresses were pre-dicted and reported at different stages during the manufacturing and for the final state.
The validation project was divided into a number of phases where increasing access to information and experimental measurements was provided as the project progressed:
Analysis 1a) Minimal acces to data. Calculations were carried out based
on drawings and welding procedure specifications (WPS) for each weld, and performed with the analysts own material da-ta.
Analysis 1b) Access to thermocouple measurements. Simulations were
carried out with the analysts’ own material data. The basis was drawings and welding procedure specifications, and in addition laser profilometry measurements of the bead pro-files, and thermocouple measurements close to the weld.
Analysis 1c) Access to thermocouple measurement and material data measured by the NRC.
Simulations were based on drawings, laser profilometry measurements of bead profiles, welding procedure specifica-tions, thermocouple measurement data and were carried out using material data provided by the NRC.
After simulation of the dissimilar metal weld including the repair/fill-in weld, results were also requested for simulation of the stainless steel pipe weld (see Figure 3-1):
Analysis 2) Welding simulation of the stainless steel pipe weld using
all available data as listed for Analysis 1c.
For each analysis phase above, NRC requested results at the following stages under the manufacture:
(i) After application of the dissimilar metal weld.
(ii) After application of the repair/back weld and associated grinding of capping.
The following quantities were requested in the submission to NRC for each phase:
Residual stresses in the axial, circumferential and radial directions (at six different through thickness locations as defined in [5]). Elastic strains in the axial, circumferential and radial directions (at
six different through thickness locations as defined in [5]). Temperature histories at the thermocouple locations. Weld shrinkage predictions.
3.2 Component and Geometry
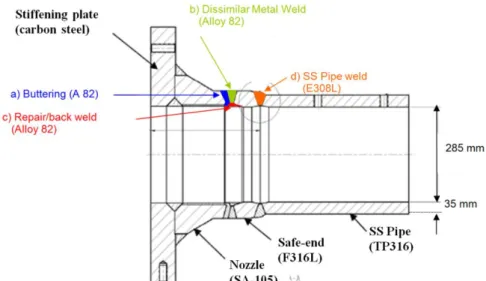
The pressurizer surge nozzle mockup which is the focus of the NRC Interna-tional Weld Residual Stress Round Robin, is illustrated in Figure 3-1 and Figure 3-2. Detailed drawings of the geometry are provided as an appendix in the project problem statement [5]. The mockup consists of a carbon steel nozzle (material SA-105), a short stainless steel ‘safe end’ (material F316L) and a stainless steel pipe section (material TP316). The inner surface of the carbon steel nozzle contains a stainless steel cladding. The nozzle was also joined to a carbon steel stiffening plate which provides roughly the same stiffness as if the nozzle was attached to a pressurizer.
The different parts of the mockup have been joined with welds. Four of these welds are of particular interest with regards to prediction of residual stresses:
1) An Alloy 82 buttering was applied to the end of the ferritic steel noz-zle. This weld is referred to as ‘buttering’ in this report and consists of 137 weld beads. The buttering underwent a heat treatment at 593-649 ºC for three hours before being air cooled.
2) An Alloy 82 dissimilar metal weld was applied between the buttering and the safe end. This weld consists of 40 weld beads and is referred to as the ’dissimilar metal weld’ in this report.
3) An Alloy 82 repair/back weld was applied to the inside to the dissimi-lar metal weld. This weld is referred to as the ’repair/back weld’ in this report. This back weld consists of 27 weld beads and is fully cir-cumferential. The weld represents a fill-in or a large 360º inside repair weld.
4) A stainless steel weld was applied between the safe end and the pipe section. This weld is referred to as the ’pipe weld’ in this report and consists of 28 weld beads.
Figure 3-1 3D illustration of the pressurizer surge nozzle mockup
which is the geometry chosen for the ’NRC International Weld
Resid-ual Stress Round Robin’ [6].
Figure 3-2 Sketch of the pressurizer surge nozzle mockup including
3.3 Manufacturing sequence
Manufacture of the pressurizer surge nozzle mockup involved the following stages:
1) Welding of a stiffening plate to the nozzle (not modeled), before welding of the buttering using Gas Tungsten Arc Weld (GTAW) or TIG welding with Inconel 82 welding wire.
A total of 15 layers were deposited in 137 passes.
2) Post weld heat treatment (PWHT) of the buttering. The ferritic noz-zle is heated to a temperature between 593 ºC and 649ºC for three hours and then air cooled.
3) Welding of the Dissimilar Metal Weld (DMW) between the nozzle and the 47 mm thick safe-end. The weld was deposited by 40 weld beads using a GTAW process with Inconel 82 welding wire. 4) Grinding of the inner surface of the dissimilar metal weld to prepare
for application of the repair/back weld.
5) Welding of the inside repair/back weld, which involved GTAW welding with Inconel 82 welding wire. 27 weld beads were applied. 6) Grinding of the capping passes for both the dissimilar metal weld
and the repair/back weld, to obtain an even surface finish.
7) Welding of the stainless steel pipe to the 86 mm long safe-end. The weld was applied by 28 passes using GTAW and SMAW welding with 308L stainless steel welding electrode.
3.4 Welding parameters and welding sequence
3.4.1 Buttering
The buttering was applied with a GTAW process using and Inconel 82 weld-ing wire of diameter 1 mm. The butterweld-ing contains a total of 137 weld beads in 15 layers. The layers build a buttering of 30 mm thickness which was machined to 14 mm thickness in the weld joint preparation after the PWHT. A detailed description of the welding parameters used for the buttering are provided in Appendix C in [5].
3.4.2 Dissimilar metal weld
The dissimlar metal weld was applied using GTAW welding with Inconel 82 welding wire of diameter 1 mm. The dissimlar metal weld contains a total of 40 weld beads. A sketch of the welding sequence and a summary of the welding parameters is provided in Figure 3-3.
Figure 3-3 Dissimilar metal weld: illustration of the bead sequence
and summary of the GTAW welding parameters. Adapted from [5].
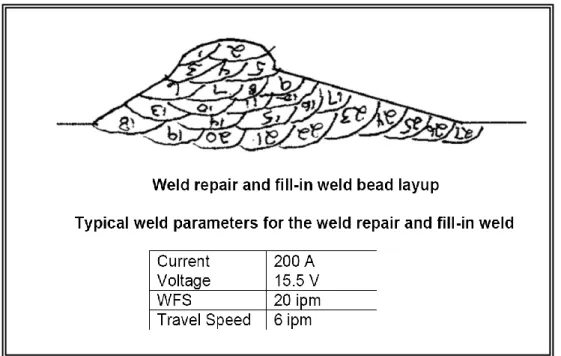
3.4.3 Repair/Back Weld
The repair/back weld was applied using GTAW welding with an Inconel 82 welding wire of diameter 1 mm. The weld consists of a total of 27 weld beads. A sketch of the welding sequence and a summary of the welding pa-rameters are provided in Figure 3-4.
Figure 3-4 Repair/back weld: illustration of the bead sequence and
summary of the GTAW welding parameters. Adapted from [5].
3.4.4 Stainless Steel Pipe Weld
The stainless steel pipe weld was applied with a combination of GTAW (first and second bead) and SMAW welding (remaining beads). The SMAW welding electrode was E308L. A description of the welding parameters is provided in [7]. The welding sequence is illustrated in Figure 3-5.
Figure 3-5 Stainless steel pipe weld: illustration of the bead
se-quence for the TIG and SMAW welding [8].
Pipe
3.5 Measurements
3.5.1 Thermocouple measurements
Thermocouples were used to measure temperature histories during welding of buttering, the dissimilar metal weld, the repair/back weld and the pipe weld:
1. Buttering. Details regarding thermocouple locations in the butter-ing are available in [5]. The measurement results are reported in [9]. 2. Dissimilar metal weld. Details regarding thermocouple locations
are available in [10]. For the dissimilar metal weld there were ten thermocouple measurement locations. Five of the thermocouples were located on the inner surface of the safe-end and the remaining five thermocouples were located on the outer surface of the safe-end. Thermocouple measurements are presented in [11].
3. Repair/back weld. Details regarding the thermocouple locations are available in [12]. Three of the thermocouples (TC1-TC3) were located at top dead center (circumferential position 0º). The two re-maining thermocouples (TC4, TC5) had the same radial and axial positions as TC1 but were located at circumferential positions 45º and 90º. Thermocouple measurements are presented in [13]. 4. Pipe weld. Details regarding the thermocouple locations are
availa-ble in [14]. There were ten thermocouples where there were located on the inner surface of the pipe section and three were located on the outer surface of the pipe weld. Thermocouple measurement results are presented in [14].
3.5.2 Welding profile and shrinkage measurements
Laser profilometry measurements were made after each bead addition for the dissimilar metal weld [15], the repair/back weld [16] and the stainless steel pipe weld [17]. This data could be used to accurately model the bead size. An example of the measurements for the stainless steel pipe weld is given in Figure 3-6, where the laser profiles for each successive pass have been over-laid on each other.
Figure 3-6 Stainless steel pipe weld: series of laser profilometry
measurements, taken after addition of each weld bead, showing the
geometry and size of the beads.
Measurements of weld shrinkage were made during welding of the dissimi-lar metal weld, repair/back weld and pipe weld for several stages of the welding process. The shrinkage was measured by comparing the distance between a series of punch marks.
3.5.3 Mechanical properties measurements
The cyclic temperature transients associated with welding processes imply that material properties as a function of temperature is required up to very high temperatures. The NRC directed measurements of uniaxial stress-strain curves as a function of temperature, for use in Analyses 1c and 2. A 45 mm thick weld joint were filled with Inconel 82 by GTAW to provide weld mate-rial for tests. No cyclic testing or biaxial testing was performed. The data provided were tabulated in [22].
3.5.4 Weld residual stresses
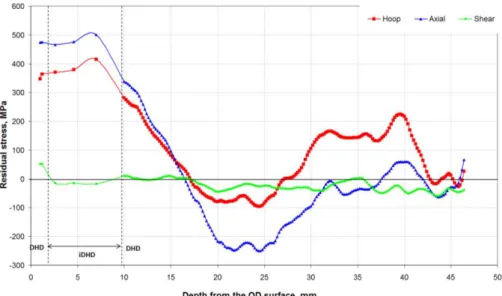
Weld residuals stresses were measured using two methods, deep hole drilling (DHD) and incremental deep hole drilling (iDHD), through the centerline of the dissimilar metal weld, see [27]. Additional neutron diffraction and x-ray diffraction measurements may be published in the future for this mockup, though at the time of writing this report the only results available are for DHD and iDHD.
Measurements were made at two stages of the manufacturing process: (i) After addition of the repair/back weld. Two DHD/iDHD
‘A’ and ‘M’ in [18]. A photograph of the measurement location at the centerline of the weld is shown in Figure 3-7. The results for position ‘A’ (location 1) are presented in Figure 3-8. The results for position ‘M’ (location 2) are presented in Figure 3-9.
(ii) After addition of the stainless steel pipe weld [19]. Hybrid
DHD/iDHD measurements were made where iDHD measurements were made in through thickness positions of high residual stress magnitude and DHD measurements were made in other through thickness positions.
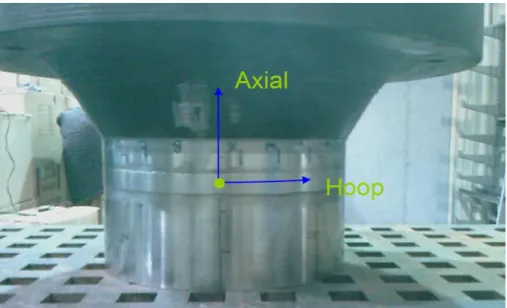
A photograph showing the measurement location is shown in Fig-ure 3-10. MeasFig-urements were made at 345º (location 3) and 165º (location 4) from top dead centre, presented in Figure 3-11 and Fig-ure 3-12, respectively.
Note that in the measurement results reported there is a net tensile, mem-brane, axial residual stress of between 50 and 70 MPa, depending on the measurement series.
Figure 3-7 Component configuration and measurement location in
the weld for the first series of DHD and iDHD measurements,
follow-ing addition of the repair/back weld.
Figure 3-8 DHD and iDHD results at location 1 in DMW centerline
following addition of the repair/back weld.
Figure 3-9 DHD and iDHD results at location 2 in DMW centerline
Figure 3-10 Component configuration and measurement location for
the second series of DHD and iDHD measurements in the Dissimilar
Metal Weld, following addition of the SS pipe weld.
Figure 3-12 Hybrid DHD/iDHD results at location 4 in DMW
4 Modeling of weld residual stresses
during mockup manufacture
4.1 Analysis steps
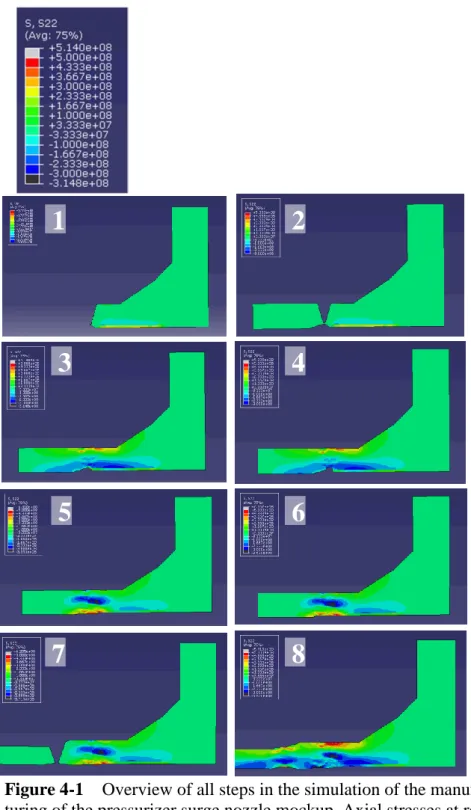
The residual stress simulation process accounted for the following stages in the pressurizer surge nozzle mockup manufacturing process, as illustrated in Figure 4-1 and Figure 4-2:
1. Post weld heat treatment (PWHT) of the carbon steel with buttering (inset labeled ‘1’ in Figure 4-1). The nozzle was heated to a temper-ature between 593 ºC and 649ºC for three hours and then cooled to room temperature.
2. Positioning of the safe end weld (inset labeled ‘2’ in Figure 4-1). 3. Welding of the Dissimilar Metal Weld (inset labeled ‘3’ in Figure
4-1). 40 passes were applied.
4. Grinding of the inner surface of the dissimilar metal weld to prepare for the application of the repair/back weld (inset labeled ‘4’ in Fig-ure 4-1
5. Welding of the repair/back weld (inset labeled ‘5’ in Figure 4-1). 27 weld beads were applied.
6. Grinding of the dissimilar metal weld and repair/back weld capping passes to obtain an even surface finish weld (inset labeled ‘6’ in Figure 4-1).
7. Machining of weld joint and positioning of the SS pipe section weld (inset labeled ‘7’ in Figure 4-1).
8. Welding of the SS pipe weld (inset labeled ‘8’ in Figure 4-1). 28 weld beads were applied.
Each welding simulation involved sequential thermal and stress analyses. An assumption of 2D axi-symmetry was made. Separate finite element meshes were created for each welding process. Stresses and strains were mapped from one mesh to the next. Material removal was simulated using the ‘element death’ method.
Figure 4-1 Overview of all steps in the simulation of the
manufac-turing of the pressurizer surge nozzle mockup. Axial stresses at room
temperature are shown. The stress fields are shown in more detail in
Figure 4-2.
1
8
7
6
5
4
3
2
(1) After buttering PWHT
(2) Positioning of machined safe-end
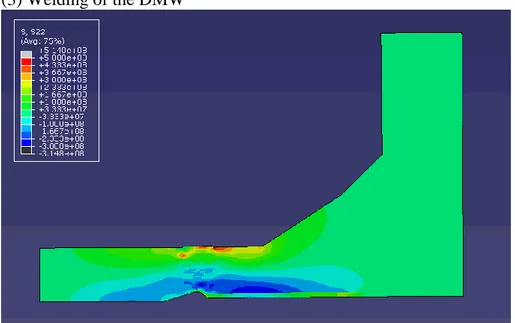
Figure 4-2 The axial residual stress field at room temperature for
the different steps in the manufacturing of the pressurizer surge nozzle
mockup (units Pa).
(3) Welding of the DMW
(4) Machining of inner surface to prepare for the repair/back weld
Figure 4-2, cont. The axial residual stress field at room temperature
for the different steps in the manufacturing of the pressurizer surge
nozzle mockup (units Pa).
(5) Welding of the repair/back weld
(6) Grinding weld caps to obtain final safe-end dimensions
Figure 4-2, cont. The axial residual stress field at room temperature
for the different steps in the manufacturing of the pressurizer surge
nozzle mockup (units Pa).
(7) Machining of joint and positioning of stainless steel pipe
(8) Welding of stainless steel pipe
Figure 4-2, cont. The axial residual stress field at room temperature
for the different steps in the manufacturing of the pressurizer surge
nozzle mockup (units Pa).
4.2 Heat source calibration
The transient heat generated from the welding process is modeled using a travelling heat source. Heat source calibration for GTAW was in Analysis 1a carried out based on the WPS and according to the methodology published in [20]. Since thermocouple measurement data was available for Analyses 1b,1c and 2, this was used for additional calibrations of the heat source. The detailed heat source calibration involved 3D modeling of a distributed, moving, heat source followed by additional calibration to ensure the 3D temperature field was adequately modeled in a 2D axisymmetric analysis. A comparison of modeled and measured temperature distributions for a 3D distributed, moving, heat source is illustrated in Figure 4-3. The case shown is from the NET Bead-on-Plate benchmark [21]. The temperature was care-fully measured by thermocouples (TC); TC2 was located 8 mm from the weld centerline and TC7 was located 15 mm from the stop end and 10.5 mm below the top surface.
(a)
The upper and lower bounds from measurements on four separate mockups are shown and compared to our finite element (FE) results.
Calibration from a 3D geometry to a 2D geometry can be carried out in sev-eral ways. One alternative is to determine a ramp time, holding temperature and holding time for the weld bead under consideration, as described in [20]. Alternatively the out-of-plane heat conduction can be modeled directly with-in the fwith-inite element software by defwith-inwith-ing a user-subroutwith-ine. For a Rosenthal type travelling heat source that is acting on the surface of a semi-infinite slab, the temperature in the slab T is given by
v
x
R
R
q
T
T
exp
2
1
2
0 0(2.1)
where R is defined as,
2 2 20
vt
y
z
x
R
(2.2)
and T0 is the ambient temperature, q0 is the heat input, is the thermal
con-ductivity, v is the velocity of the heat source and is the thermal diffusivity. Furthermore, Fourier’s law allows a decomposition of the heat flux as
z y x
j
q
k
q
q
i
q
ˆ
ˆ
ˆ
(2.3)
The x-component (out-of-plane component) of the heat flux qx is defined from x T k qx
(2.4)
Evaluation of Eq. (2.4) provides the out-of-plane heat flux,
2 01
2
2
exp
2
R
x
R
x
v
x
R
v
R
q
q
x
(2.5)
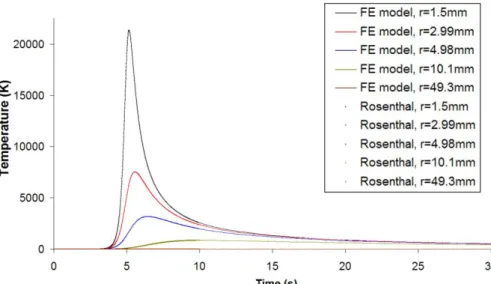
This methodology has been implemented in a user subroutine to the finite element software ABAQUS. The results from a verification analysis for a simple geometry are shown in Figure 4-4. The FE predicted temperatures agree exactly with the theoretical temperatures.
Figure 4-4 Rosenthal heat source: predicted temperature profile
from a 2D FE model at different radii from the heat source. Note that
the predicted temperatures (dotted) agree exactly with the theoretical
temperature profile (lines).
4.3 Material modeling
4.3.1 Thermal material properties
Thermal material properties for each of the mockup materials were provided by the NRC at the beginning of the project. Tabulated data is available in the problem statement [5].
4.3.2 Mechanical material properties
The analyses 1a and 1b were performed using material data proprietary to Inspecta Technology. The NRC published its own material data for use in Analyses 1c and 2. This data is available in tabulated form in [22]. Based on previous investigations [23], an isotropic hardening model was chosen for the different simulations. The annealing temperature was set to 1400ºC for phase 1a-1c of the round robin. Further work on material modeling that was performed after the round robin submissions to NRC is described in Section 5.5.
4.4 Welding Simulations
tering as a part of this project, and further work in this area is recommended since it is an important zone.
4.4.1 Dissimilar metal weld
The bead sequence and finite element mesh is shown in Figure 4-5 for the dissimilar metal weld. The maximum temperature experienced at each mate-rial point during the welding simulations is shown in Figure 4-6 for the case of analysis 1c.
Figure 4-5 Weld bead sequence and finite element mesh for the
dissimilar metal weld. Axial stresses are shown at room temperature
(units in Pa).
Figure 4-6 Maximum temperature at each material point during the
deposition of the dissimilar metal weld (units in degrees Celsius).
4.4.2 Repair/Back weld
The bead sequence and finite element mesh for the repair/back weld is shown in Figure 4-7. The maximum temperature experienced at each materi-al point during the repair/back weld simulation is shown in Figure 4-8 for the case of analysis 1c.
Figure 4-8 Maximum temperature at each material point during the
deposition of the repair/back weld (units in degrees Celsius).
4.4.3 Stainless steel pipe weld
The finite element mesh for the stainless steel pipe weld is shown in Figure 4-9. The bead sequence is according to Fig. 3-5. The axial stress distribution in the pipe weld, dissimilar metal weld and the repair/back weld is shown in Figure 4-10. The maximum temperature experience at each material point during the pipe weld simulation is shown in Figure 4-11.
Figure 4-9 Weld bead finite element mesh for the stainless steel pipe
Figure 4-10 Axial residual stresses at room temperature after addition
of the stainless steel pipe weld (units in Pa).
5 Results
5.1 Comparison of Inspecta’s results for phase
1a, 1b and 1c
A comparison of predicted axial residual stresses for analysis phases 1a, 1b and 1c, with different access to information, is shown in Figure 5-1. Results are shown at room temperature, after the deposition of the repair/back weld. The results are evaluated along a path at the centerline of the dissimilar met-al weld. Measured residumet-al stresses from the iDHD method are met-also plotted. For each analysis phase, good agreement is obtained with experimental measurements. The results predicted were quite stable between all phases of access to information, which indicates that the procedures and data used by Inspecta are quite good. Analysis 1b resulted in a bit higher heat input than analysis 1a.
It is concluded that the axial residual stresses are not very sensitive to rea-sonable differences in heat source calibration (Analysis 1a versus 1b) or source of material data (analysis 1b versus 1c).
In Figure 5-2 the predicted hoop stresses after application of the repair/back weld is compared for the phases 1a, 1b and 1c. The chosen path is along the centerline of the dissimilar metal weld. Measured hoop residual stresses from the iDHD method are included. Note that there is a tendency to overes-timate the hoop residual stresses in relation to the experimentally measured residual stress profiles.
The analysis which gave best agreement with the experimental measure-ments was analysis 1a, where the analyst was forced to perform a blind heat source calibration and supply his own material data.
In analysis 1b, when thermocouple data was provided, the welding heat input was increased and this lead to greater hoop stress magnitudes, particularly in the important region close to the inner surface of the component. Use of the NRC’s material data lead to a small decrease in the hoop stress magnitude between phases 1b and 1c.
Figure 5-1 Phases 1a-1c: Axial stresses along the centerline of the
dissimilar weld after application of the repair/back weld. Results
pre-sented at room temperature.
5.2 Inspecta’s results after welding of pipe –
phase 2
A comparison of predicted and measured axial residual stresses for analysis phase 2, after welding the stainless steel pipe to the safe-end, is shown in Figure 5-3. The results at room temperature are evaluated along a path at the centerline of the dissimilar metal weld. There is good agreement between the predicted and measured axial residual stress profiles.
Note the addition of the pipe weld has led to a decrease in the axial residual stress magnitude on the region at the inner surface of the repair/back weld. This effect is coupled to the unusually short safe-end for the geometry of the mockup. The distance L between the pipe weld and the dissimilar metal weld in relation to the influence length is L Rt 0.75. This beneficial interac-tion effect would not be observed in the case of a long safe end.
Figure 5-3 Phase 2: Axial stresses along the centerline of the
dis-similar metal weld after application of the stainless steel weld. Results
are presented at room temperature.
A comparison of predicted hoop residual stresses for analysis phase 2 is shown in Figure 5-4. The chosen path is along the dissimilar metal weld centerline after application of the stainless steel pipe weld. As with analysis phases 1a, 1b and 1c there is a tendency to over predict the hoop residual stress magnitude in the weld near the inner surface of the component. Comparison with Figure 5-2 show that the magnitude of also the hoop stresses at the dissimilar metal weld is considerably reduced after the appli-cation of the pipe weld. As discussed, this effect can be attributed to unusu-ally short safe-end.
Figure 5-4 Phase 2: Hoop stresses along the centerline of the
dis-similar metal weld after application of the stainless steel weld. Results
are presented at room temperature.
5.3 Observations regarding Inspecta’s results
The comparison of axial stresses for analyses 1a, 1b, 1c and 2 indicate that good agreement between experiment and modeling was obtained for all analysis stages.
The comparison of hoop stresses for analyses 1a, 1b, 1c and 2 indicate that: 1. There is a tendency to overestimate hoop stresses along the
center-line of the dissimilar metal weld, especially at the inner surface of the weld.
2. Inspecta’s material data and NRC’s material data lead to similar predictions of residual stress in the repair/back weld and the dissimi-lar metal weld.
3. The hoop stress magnitude is sensitive to the strength of the welding heat source, particularly in the repair/back weld near the inner sur-face of the component.
Addition of the pipe weld led to a beneficial decrease in the magnitude of residual stress near the inner diameter of the component in the repair/back weld.
5.4 Round Robin results published by NRC for
all modeling groups
The NRC has published a comparison of the residual stress profiles predicted by all modeling groups in the round robin in the different analysis phases [6, 24].
Predicted residual stresses in the axial and hoop directions are presented in Figure 5-5 and 5-6 for analysis phase 1c. The iDHD measurement results are also plotted (round dots). It is observed that there is considerable scatter in the predictions from the different modeling groups.
NRC calculated the ‘averaged’ predictions by models using isotropic or kin-ematic hardening respectively (solid lines). In general modeling based on isotropic hardening lead to better predictions of the axial residual stress than kinematic hardening, though it had the tendency to overestimate hoop stress magnitudes. Additional discussion of the results by the NRC is presented in [24]. Of course it is debatable whether it is a good sensitivity study to calcu-late and compare an average and standard deviations for all simulation mod-els grouped together. However it illustrates the scatter that can be obtained in predictions if not detailed and careful modeling is performed.
It is noted that Inspecta’s result is among one of the groups with closest agreement to the experimental measurements. It is a bit difficult to follow the result from single groups in the plots, but the results by Inspecta are seen in Figure 5-1 to 5-4.
Predicted residual stresses in the axial and hoop directions following addi-tion of the stainless steel pipe weld (phase 2) are plotted in Figure 7 and 5-8 for all modeling groups. Deep hole drilling measurement results are in-cluded in the figures. Note that considerable scatter remains between the different modeling groups.
Figure 5-5 Phase 1c: comparison of axial residual stress predictions
along the centerline of the dissimilar metal weld for all analysis
groups following the round robin [6]. The hardening model used by
each group is indicated in the legend.
Figure 5-7 Phase 2: comparison of axial residual stress along the
centerline of the dissimilar metal weld after application of the stainless
steel pipe weld. Results for all round robin participants are presented
[6].
Figure 5-8 Phase 2: comparison of hoop residual stress along the
centerline of the dissimilar metal weld after application of the stainless
steel pipe weld. Results for all round robin participants are presented
[6].
5.5 Model improvement following publication of
residual stress profiles
An additional modeling phase was carried out by Inspecta to identify lessons learned from the NRC International Weld Residual Stress Round Robin, so that modeling improvements could be made.
The results presented by the NRC demonstrated that one of the most influen-tial parts for the prediction result is the modeling of the material hardening. It was noted that models using isotropic hardening gave good agreement for axial residual stresses though hoop stresses tended to be over predicted. Through analysis of the deformation conditions prevalent during welding, see also [26], together with a literature review of the constitutive response of nickel-base alloys at high temperatures and under cyclic loading, two chang-es to the isotropic material hardening were introduced:
1. The anneal temperature for Alloy 82 were reduced from 1400 ºC to 927 ºC based on a phase transformation that occurs at 927 ºC. 2. The amount of isotropic hardening were limited at higher plastic
strains by specifying a perfectly plastic cut-off stress (which is tem-perature dependent), based on review of relevant cyclic testing data. As discussed in Section 4.2, the procedure for heat source calibration also have large influence on the modeling results, as was seen in the comparison of hoop stress magnitudes between analysis phases 1a and 1b. This conclu-sion from the heat source calibration studies were therefore used for improv-ing the use of results from the thermocouple measurements.
It is concluded that detailed material modeling is important, see also [25]. In the determination of the material hardening model, test data also for high temperatures is important together with cyclic data.
Predictions by this updated isotropic material modeling are presented in Fig-ure 5-9 after the application of the repair/back weld, and FigFig-ure 5-10 and Figure 5-11 after the welding of the stainless steel pipe. The comparisons show a very good agreement with the experimental measurements.
Figure 5-9 Modeling improvement: Predicted axial and hoop
resid-ual stresses along the centerline of the dissimilar metal weld after
ap-plication of the repair/back weld (see insert). The changes introduced
in the modeling results in very good agreement between the predicted
stresses and the iDHD measurement results.
International Round Robin iDHD comparison - after DMW
-400 -200 0 200 400 600 800 1000 0 5 10 15 20 25 30 35 40 45
Depth from inner surface (mm)
Resi d u al Stress (MPa)
iDHD 1 Hoop iDHD 1 Axial iDHD 2 Axial iDHD 2 Hoop FE - axial - centreline FE - hoop - centreline
*Improved high temperature material modelling for both inconel and stainless steel
* Experimental axial stresses have been calibrated to be self equilibriating
Figure 5-10 Modeling improvement: Predicted axial residual stresses
along the centerline of the dissimilar metal weld after final welding of
the stainless steel pipe (see insert). The agreement between predicted
stresses and iDHD measurements is very good.
6 Comparison of predicted residual
stresses with profiles in the fracture
mechanics handbook
The fracture mechanics assessment procedure SSM 2008:01 [4] includes recommended residual stress profiles that are used in assessments in Swe-dish nuclear utilities. In this section an assessment is made to judge if the recommended profiles are realistic and accurate in view of the development within methods for residual stress prediction during the last decade. The recommended residual stresses in SSM 2008:01 are based on finite ele-ment modeling using kinematic hardening and an earlier approach to heat source calibration, see [1] to [3]. More recent developments have led to im-provements in both material modeling for stainless steels and nickel based alloys and in heat source modeling. A comparison is therefore conducted to assess if there is a need for an update of the fracture mechanics handbook recommended residual stress profiles.
It is difficult to make general judgments regarding residual stress profiles that always results in conservatism. It is therefore suggested that best esti-mate residual stress profiles are given as guidelines. Some examples illus-trate the problem. In the case of calculating an inspection interval conserva-tism is associated with greater tensile residual stress magnitudes and lower compressive stress magnitudes. When estimating the crack opening (for ex-ample when assessing VT-testing) conservatism is associated with lower tensile residual stress magnitudes and greater compressive stress magnitudes. Another situation is an assessment based on a ‘least unlikely’ damage mech-anism of combined stress corrosion cracking and fatigue, where a residual stress profile as shown in Figure 5-1 could actually lead to non-conservatism for greater residual stress magnitudes; A small crack could first grow in depth due to stress corrosion cracking and arrest in the depth direction, a bit into the region of compressive stress. The crack would then lengthen, be-coming more and more circumferential. Crack growth due to fatigue, or frac-ture from an overload, could then act upon a much larger circumferential crack than if crack arrest in the depth direction had not occurred, and could result in guillotine break. Based on the discussion above, it is suggested that best estimate residual stress profiles are used in all assessments. However, note that the recommendations in SSM2008:01 are conservative estimations based on the results in ref. [1] to [3].
A comparison between Best Estimate FE predictions (denoted BEFE) and the fracture mechanics handbook recommended residual stress profiles (SSM2008:01) has been carried out for the following selected pipe weld geometries:
1. A dissimilar metal weld, 42 mm thick 2. A stainless steel pipe weld, 13.2 mm thick
3. A stainless steel pipe weld, 19.6 mm thick 4. A stainless steel pipe weld, 37 mm thick.
The analyses performed in this section are made using the improved material modeling for Alloy 82 as described in section 5.5. For the stainless steel pipe welds a mixed hardening model was defined since in a recent sensitivity study [25], mixed hardening was found to give the best overall agreement with experimental measurements on stainless steel pipe welds for a range of welding geometries. For stainless steel the anneal temperature was set at 1000 ºC.
6.1 42 mm dissimilar metal pipe weld
A dissimilar metal weld is evaluated by considering the 42 mm Alloy 82 dissimilar metal weld in the NRC mockup before the repair/back weld is deposited. A comparison of BEFE predicted and SSM2008:01 recommended residual stress profiles is presented in Figure 6-1 for the weld centerline. The BEFE prediction does not include effects of either a repair/back weld or a pipe weld close to the DMW. Note that the stress field is relevant to cases involving a long safe end even when the pipe weld is present. Effects of the pressure test have not been considered, though the influence of the pressure test on the stress profile can be considered small for this geometry. There is good agreement between BEFE and SSM2008:01 for the hoop re-sidual stresses. In contrast, for axial rere-sidual stresses there is a significant difference in the magnitude of the stresses. The magnitude of the
SSM2008:01 recommended axial residual stress varies between 100 MPa, whereas the BEFE prediction gives considerably higher stress magnitudes of between 300 MPa.
It is observed that the stress profiles for dissimilar metal welds recommend-ed in SSM2008:01 generally have rather low stress magnitudes. An update of recommended residual stress profiles for dissimilar metal welds is re-commended.
The difference in the axial residual stress profile in Figure 6-1 has implica-tions for prediction of inspection intervals and final crack shapes as dis-cussed before. The BEFE prediction will tend to slow the growth in depth, relative to the SSM2008:01 recommendation. On the other hand the BEFE prediction will also tend to produce a longer (more circumferential) crack compared with the SSM2008:01 recommendation.
Figure 6-1 Comparison of handbook profiles with Best Estimate FE
predicted residual stress profiles for a 42 dissimilar metal pipe weld
(results room temperature).
6.2 13 mm stainless steel pipe weld
A 13.2 mm thick stainless steel pipe weld was considered for a case with pipe radius to thickness ratio Ri/t of 15. The welding heat input was 1.35
kJ/mm for all passes, and heat calibration was carried out as described in [20]. Mixed hardening was used. The bead sequence and 2D axisymmetric FE mesh are shown in Figure 6-2.
A comparison between the BEFE predictions and the SSM2008:01 recom-mendation is presented in Figure 6-3 along the weld centerline. In this case there is good agreement for the axial and hoop stresses near the inner sur-face. Near the outer surface, lower hoop stresses are predicted by the BEFE calculation compared with the SSM2008:01 recommendation.
Figure 6-2 Bead geometry and axial residual stress distribution at
room temperature for the 13.2 mm thick stainless steel pipe weld.
1 7 6
5 4
2 3
Figure 6-3 Comparison of handbook profiles with best estimate FE
predicted residual stress profiles for a 13.2 mm thick stainless steel
pipe weld (results at room temperature).
6.3 19.6 mm stainless steel pipe weld
A 19.6 mm thick stainless steel pipe weld was considered with Ri/t ratio of
10.5. The welding heat input was 1.3 kJ/mm for all passes, and heat calibra-tion was carried out as described in [20]. Mixed hardening was used. The bead sequence and 2D axisymmetric FE mesh are shown in Figure 6-4. A comparison between the BEFE predictions and the SSM2008:01 recom-mendation is presented in Fig. 6-5 along the weld centerline. The BEFE pre-dictions of both axial and hoop stresses differ from the SSM2008:01 recom-mendation, both in terms of magnitude and profile. This has implications for calculation of inspection intervals and predicted crack shape. Note that the form of the axial residual stress profile for this 19.6 mm thick pipe weld differs markedly from the shape of the profile for the 13.2 mm thick pipe weld in Figure 6-3. A transition from a linear distribution to a ‘sinus’ distri-bution has occurred with the change in thickness. This transition is currently not accounted for by the handbook except for thicknesses greater than 30 mm. An update of the handbook to capture these intermediate geometries is recommended. Further sensitivity and validation studies would be of benefit for quantifying the transition.
Figure 6-4 Bead geometry and axial residual stress distribution at
room temperature for the 19.6 mm thick stainless steel pipe weld.
1 9 8 7 6 5 4 3 2 13 14 12 11 10
6.4 37 mm stainless steel pipe weld
A 37 mm thick stainless steel pipe weld was considered with Ri/t ratio of 4.7.
The welding heat input was 2.14 kJ/mm for all passes, and heat calibration was carried out as described in [20]. Mixed hardening was used. The bead sequence and 2D axisymmetric FE mesh are shown in Figure 6-6. A comparison between the BEFE predictions and the SSM2008:01 recom-mendation is presented in Figure 6-7 along the weld centerline. Note that the BEFE predictions of axial and hoop stresses differ substantially from the SSM2008:01 recommendation both in terms of magnitude and profile. This has implications for calculation of inspection intervals and crack shape de-velopment. An update of the handbook for these thicker stainless steel pipe welds is recommended.
Figure 6-6 Bead geometry and axial residual stress distribution at
Figure 6-7 Comparison of handbook profiles with best estimate FE
predicted residual stress profiles for a 37 mm thick stainless steel pipe
weld (results at room temperature).
7 Recommendations
Recommendations resulting from the work carried out in the NRC Interna-tional Weld Residual Stress Round Robin are summarized below.
Modeling:
Numerical predictions of weld residual stresses for stainless steel and nickel based welds should be based on validated models for welding heat source calibration and material hardening.
In the case of nickel based weld material a modified isotropic hard-ening model gave very good agreement with experimental meas-urements and is recommended for analysis of weld residual stresses. The presence of the repair/back weld leads to significantly higher re-sidual stress magnitudes at the inner surface than the presence of the dissimilar metal weld alone. The effect of significant repair welds on residual stress distributions should be considered.
A beneficial interaction effect can occur between the pipe weld and the dissimilar metal weld in cases where the safe-end is sufficiently short. This can be used in piping design to minimize residual stress magnitudes near the inner surface of the dissimilar metal weld. Recommended residual stress profiles:
An update of recommended residual stress profiles for dissimilar metal welds is recommended to ensure relevant calculations of in-spection intervals and final crack dimensions.
An update of recommended residual stress profiles for stainless steel weld of thickness greater than 13 mm is recommended to ensure rel-evant calculations of inspection intervals and final crack dimensions. Sensitivity studies and experimental validation is recommended for
residual stress profiles for stainless steel pipes with thicknesses in the intermediate range 13-19 mm, since the residual stress profile undergo a transition in this thickness range.
8 Conclusions
It is concluded that numerical analysis of weld residual stresses using the finite element method is very useful for the estimation of residual stresses in complex geometries and dissimilar metal welds. The validation study increases the understanding of uncertainties associated with different mod-eling approaches and help identify the most sensitive parameters. Some of the conclusions related to modeling of residual stresses are:
While there was large scatter between the predicted residual stress profiles from different analysis groups, it was also found that caful modeling of material hardening and heat source description re-sulted in very good agreement with the experimentally measured residual stress profiles.
The evaluation carried out by the NRC indicate that isotropic hard-ening in general leads to greater residual stress magnitudes than kinematic hardening
Inspecta’s contribution shows that a modified isotropic hardening model gives very good agreement with experimental measurements for the dissimilar metal weld.
Residual stresses in the repair/back weld were found to be sensitive to the heat input.
A beneficial interaction effect occurs between the dissimilar metal weld and the pipe weld, if the length of the safe-end is selected ap-propriately. This can be used in piping design to minimize residual stress magnitudes near the inner surface of a dissimilar metal weld.
The comparison of handbook weld residual stress profiles with best esti-mate FE predictions using improved modeling, shows that there is a need for updating the recommended stress profiles in the fracture mechanics handbook SSM 2008:01.
9 References
[1]
B. Brickstad and L. Josefson,”A Parametric Study of Residual Stressesin Multipass Butt-Welded Stainless Steel Pipes”, SAQ FoU-Report
96/01
[2] P. Delfin, B. Brickstad and L. Josefson, “Residual Stresses in
Multi-Pass Butt-Welded Bimetallic Piping, Part I”, SAQ FoU-Report 98/12
[3] P. Delfin, B. Brickstad and J. Gunnars, “Residual Stresses in
Multi-Pass Butt-Welded Bimetallic Piping, Part II”, SAQ FoU-Report 99/06
[4] Dillström P. et al.,“A combined deterministic and probabilistic
proce-dure for safety assessment of components with cracks – proSACC Handbook”, SSM Report 2008:01, Swedish Radiation Safety
Authori-ty, 2008.
[5] US NRC, ”International Weld Residual Stress Round Robin Problem
Statement”, Version 1, Office of Nuclear Regulatory Research -
Divi-sion of Engineering - Component Integrity Branch, December 14, 2009.
[6] Kerr, M. Fredette, L. ’Phase II International WRS Round Robin Data
Analysis’, Presented at PVP2011, Special Meeting for Residual
Stresses, 2011.
[7] ’Stainless Steel Weld Information for International Weld Residual
Stress Round Robin Analysis’, Email communication from Howard
Rathbun to Jonathan Mullins, 08-06-2010.
[8] ’Pass Map’, Email communication from Howard Rathbun to Jonathan Mullins, 08-06-2010.
[9] ’Buttering_Weld_Temperatures.xls’, Email communication from Howard Rathbun to Jens Gunnars, 01-03-2010.
[10] Batelle Drawing no. CG482478-214 Rev B, ’Safe End Weld
Thermo-couple Locations’, 2009-06-09.
[11] ’OD_Weld_Temperatures.xls’, Email communication from Howard Rathbun to Jens Gunnars, 01-03-2010.
[12] Batelle Drawing no. CG482478-217 Rev B, ’Back Weld
Thermocou-ples Location 1’, 2008-11-24.
[13] ’ID_Weld_Temperatures.xls’, Email communication from Howard Rathbun to Jens Gunnars, 01-03-2010.
[14] ’Thermocouple information’,Computer files from email communica-tion sent from Howard Rathbun to Jonathan Mullins, 08-06-2010. [15] ’ID_Weld_Bead_Profilometry.xls’, Email communication from
How-ard Rathbun to Jens Gunnars, 14-12-2009.
[16] ’OD_Weld_Bead_Profilometry.xls’, Email communication from Howard Rathbun to Jens Gunnars, 14-12-2009.
[17] ’Laser profilometry data’,Computer files from email communication sent from Howard Rathbun to Jonathan Mullins, 08-06-2010. [18] ’ Intnl Round Robin before SS weld.xls’,Computer files from email
communication sent from Howard Rathbun to Jonathan Mullins, 23-02-2011.
[19] ’ DHD and iDHD Intl RR AFTER SS weld.xlsx’, Computer files from email communication sent from Howard Rathbun to Jonathan Mullins, 23-02-2011.
[20] W. Zang, J. Gunnars, P. Dong and J.K. Hong, “Improvement and
Val-idation of Weld Residual Stress Modelling Procedure”, SSM Report
2009:15, 2009.
[21] Smith, M.C., Smith, A.C.,”NeT bead-on-plate round robin:
Compari-son of transient thermal predictions and measurements”, International
Journal of Pressure Vessels and Piping, vol 86, pp96-109, 2009. [22] ’ Phase 2a Mockup-Materials.xls’, Computer file from email
commu-nication sent from Howard Rathbun to Jonathan Mullins, 23-02-2011. [23] J. Mullins and J. Gunnars, “Influence of Hardening Model on Weld
Residual Stress Distribution”, SSM Report 2009:16, 2009.
[24] Kerr, M., Rathbun, H.J., ’NRC/EPRI Weld Residual Stress Finite
Ele-ment Analysis Validation’, Presented at PVP2011, Special Meeting for
Residual Stresses, 2011.
[25] Mullins, J., Gunnars, J. “Welding simulation: Relationship between
welding geometry and determination of hardening model”,
PVP2012-78599, Proc. ASME 2012 Pressure Vessels and Piping Conf., 2012. [26] J. Mullins and J. Gunnars, “Deformation histories relevant to
multi-pass girth welds: temperature, stress and plastic strain histories”,
Proc. of ECRS 8, 2010.
[27] A.H. Mahmoudi, S. Hossain, C.E. Truman, D.J. Smith and M.J. Pavier, A New Procedure to Measure Near Yield Residual Stresses
Using the Deep Hole Drilling Technique, Experimental Mechanics
2013:01 The Swedish Radiation Safety Authority has a comprehensive responsibility to ensure that society is safe from the effects of radiation. The Authority works to achieve radiation safety in a number of areas: nuclear power, medical care as well as commercial products and services. The Authority also works to achieve protection from natural radiation and to increase the level of radiation safety internationally.
The Swedish Radiation Safety Authority works proactively and preventively to protect people and the environment from the harmful effects of radiation, now and in the future. The Authority issues regulations and supervises compliance, while also supporting research, providing training and information, and issuing advice. Often, activities involving radiation require licences issued by the Authority. The Swedish Radiation Safety Authority maintains emergency preparedness around the clock with the aim of limiting the aftermath of radiation accidents and the unintentional spreading of radioactive substances. The Authority participates in international co-operation in order to promote radiation safety and fi nances projects aiming to raise the level of radiation safety in certain Eastern European countries.