Project SEISMIC SAFETY
Characterization of seismic
ground motions
for
probabilistic safety
analyses of nuclear facilities
in Sweden
SUMMARY REPORT
SKi
STATENS KARNKRAFTINSPEKTION SWEDISH NUCLEAR POWER INSPECTORATEApril 1992
VATTENFALL
~
VBBconsulling Lld A company of the VBBgroup
Project SEISMIC SAFETY
SUMMARY REPORT
Characterization of seismic
ground motions for
probabilistic safety
analyses of
nuclear facilities in Sweden
The project SEISMIC SAFETY is sponsored and directed by
the SWEDISH NUCLEAR POWER INSPECTORATE (SKI) with the assistance of
VATIE N FALL.
SYDKRAFT and OKG Project management: VBB
Postal address po. Box 5038 S-102 41 Stockholm Sweden
Visiting address Telephone Telefax Telex Partner of
2, Linnegatan + 4687827000 + 46 86609217 10477 VBB S SV\I6::P
29, Biblioteksgatan + 46 8 104656 10623 VBB S
industrial plant of today. The risk of a nuclear accident in Sweden,
caused by an earthquake, may thus be considered to be low.
The two latest reactors Forsmark 3 and Oskarshamn 3 have been
analysed and designed to resist a specified earthquake. For the older
reactors no corresponding analyses or designs have been made
initially. Their general design is robust.and was considered to provide
enough safety with regard to earthquakes of the magnitude
reason-ably to be taken into account.
In the last ten years period the demands on safety with respect to
nuclear power has increased. This fact has necessitated studies of
possible incidents with a lower and lower probability. In order to
ob-tain a complete picture of the risk, it is therefore also necessary to
evaluate the seismic safety for the older reactors and to apply this
knowledge during operation and in connection with alterations of
existing plant design.
The basis and the methodology used in the design of Forsmark 3 and
Oskarshamn 3 with respect to seismic safety is not in all parts suited
to be employed for the older reactors. The methods imply a number
of simplifications which may be a practical approach in connection
with a new design but which might cause too conservative
judge-ments of existing designs. The development of methods is therefore
a vital part in the analysis.
The Swedish Nuclear Power Inspectorate, Vattenfall AB, Sydkraft AB
and OKG AB have performed such a development of methods in a
joint research programme: "Project Seismic Safety" ("Seismisk
Saker-het"). The aim of the project was to develop methods for calculating
the ground response to be used in the safety analysis of nuclear
power plants in Sweden, as well as to demonstrate its application to
the power plants at Ringhals and Barseback. The project also
includ-es a survey of geological and seismological conditions in the regions
around the power plants studied.
The project "Seismic Safety" has now been finalized and the result is
presented in this report. The project has in all essential parts reached
the aims put up. The methods developed within this project are useful
not only for nuclear power stations but also when considering seismic
risks within other areas.
dast ett f~tal handelser finns registrerade i historisk tid, vilka skulle ha kunnat skada en modern industrianlaggning. Risken for en karnkraft-olycka i Sverige orsakad av en jordbavning kan darfor bedomas vara I~g.
De tv~ senaste reaktorerna Forsmark 3 och Oskarshamn 3 har berak-nats och konstruerats for att klara en specificerad jordbavning. For de aldre reaktorerna har inte motsvarande berakningar eller dimen-sionering gjorts. Den allmant robusta konstruktionen har ansetts ge tillracklig sakerhet med hansyn till jordbavningar av den styrka det funnits sannolik anledning att rakna med.
Under den senaste 1 O-~rsperioden har kraven pa karnkraftens saker-het okat, vilket medfort att handelser med allt lagre sannoliksaker-het stude-ras. For att riskbilden skall bli komplett, m~ste saledes aven den seis-miska sakerheten for de aldre reaktorerna analyseras och eventuellt beaktas under drift och vid utformning av anlaggningsandringar. De underlag och metoder som anvants vid konstruktionen av Fors-mark 3 och Oskarshamn 3 betraffande seismisk sakerhet ar inte i alia stycken lampade att anvandas for de aldre reaktorerna. Met6derna innefattar ett antal f6renklingar, vilka kan var praktiska i samband med nykonstruktion, men som skulle ge on6digt konservativa bedomningar av befintliga konstruktioner. Metodutveckling ar darfor en nodvandig del av ett analysarbete.
Karnkraftinspektionen, Vattenfall AB, Sydkraft
AB
and OKG AB har genomfort en s~dan metodutveckling i ett gemensamt forskningspro-jekt, Seismisk Sakerhet. Projektets malsattning var att utveckla meto-der for berakning av markskakningsforlopp att anvandas vid saker-hetsanalys av karnkraftverk i Sverige samt att demonstrera deras tillampning pa kraftverken i Ringhals och Barseback. Projektet skulle aven innefatta oversikter over geologiska och seismologiska forhMan-den i regionerna kring de studerade kraftverken.Projekt Seismisk Sakerhet ar nu avslutat och resultatet redovisas i denna rapport. Projektet har i allt vasentligt n~tt de uppstallda malsatt-ningarna. De utvecklade metoderna ar anvandbara inte endast for karnkraftverk utan aven for seismiska riskbedcSmningar i andra sam-manhang.
STEERING COMMITTEE Per Bystedt Fritz Kautsky Lars Gunsell Lars Bennemo G6ran Larsson Anders Lorup Mikael Landelius Alf Engelbrektson Eystein Husebye Fred Nilsson SKI (Chairman) SKI
State Power Board State Power Board Sydkraft
Sydkraft OKG
VBB (Project Manager)
Oslo University (Scientific Adviser) Uppsala University (Scientific Adviser)
P4672-001 Project
May 1989
SEISMIC SAFETY
SUMMARY REPORT
CHARACTERIZATION OF SEISMIC GROUND MOTIONS FOR PROBABIUSTIC SAFETY ANALYSES OF NUCLEAR FACIUTIES IN SWEDEN
CONTENTS
1. INTRODUCTION
2. BASIC OBJECTIVES AND RESULTS
3. METHODOLOGY
3.1 General approach
3.2 Assessment of occurrence frequency distributions of seismic events
3.3 Development of characteristic ground
response spectra for various classes of events 3.4 Assessment of the spread of spectral values
3.5 Construction of Envelope Ground Response Spectra 3.6 Generation of synthetic ground motion
time-histories
3.7 Site specific ground motion characteristics for Barsebiick
4. CONCLUDING REMARKS
4.1 Uncertainty ranges
4.2 Comparison between the proposed ground response spectra and the original design spectra
4.3 Comparison between the proposed spectra and spectra from other Intraplate regions
REFERENCES LIST OF SYMBOLS APPENDICES
1 ENVELOPE GROUND RESPONSE SPECTRA FOR A TYPICAL HARD
ROCK SITE
2 SYNTHETIC GM TIME-HISTORIES FOR A TYPICAL HARD ROCK SITE
3 ENVELOPE GROUND RESPONSE SPECTRA FOR BARSEBACK
4 SYNTHETIC GM TIME-HISTORIES FOR BARSEBACK
5 REPORT TO THE SMIRT CONFERENCE IN ANANHEIM, CALIFORNIA, AUG. 1989 Page 1 4 7 7 8 11 15 16 17 18 21 21 23 26
1. INTRODUCTION
The study project SEISMIC SAFETY is sponsored and directed by the Swedish Nuclear Power Inspectorate (SKI) with the assist-ance of VATTENF ALL, SYDKRAFT and OKG. The basic objec-tive of the study is to evaluate the seismic risk relating to the Swedish nuclear facilities, including characterization of possible earthquake-induced ground motions at an extremely low probabi-lity level. Since the intention is to identify and account for the specific geological and seismological conditions in Sweden and adjacent areas and to utilize, judiciously, well-documented empi-rical relationships and data from other regions, it is anticipated that the study will generate an improved specification of the seismic load, compared with the design load specified during the end of the 70's, on a less selective basis, for the third reactor units of the Forsmark NPP and the Oskarshamn NPP and for the intermediate spent fuel storage CLAB.
The present project is thus a fundamental part of a comprehen-sive seismic risk evaluation concerning the Swedish nuclear facilities. This evaluation comprises the following main tasks:
Pre-evaluation of the seismic risk associated with selected structures and components. (Conservati ve estimates, based on the above-mentioned design loads, performed mainly in connection with the installation of the filtered containment pressure-relief systems FIL TRA in the reactor systems, com-pleted before 1989).
The present project, comprising two phases:
*
*
The main task, aiming at the presentation of a complete set of seimic load data, reviewed against the state-of-the art, in mid 1989.
A subsequent phase of supplementary review and refine-ment, based on a selective processing of data from recent events in Scandinavia and an additional input from inter-national sources.
Assessment of seismic responses and capacities of safety related structures and components within the Swedish nuclear plants. Quantification of the seismic contribution to the risk associated with each plant. The assessments are based on the seismic load input presented as a result of the main task mentioned above, to be adjusted, if necessary, on the basis of revisions carried out during the refinement period.
The present study has been documented in the following series of reports:
Report No. 1: Probabilistic assessment of seismic ground
motion characteristics for Swedish hard rock sites.
Report No. 2: Seismic response spectra for characterization of ground motions in Swedish hard rock.
Report No. 3: Synthetic time-histories for characterization of ground motions in Swedish hard rock.
Report No. 4: Characterization of seismic ground motions for Barseback NPP.
Report No. 5: Geological aspects on seismic hazard assess-ments for the Ringhals and Barseback NPP sites.
In these reports the models and procedures employed for the ground motion characterization and the probabilistic assessments are described and resul ts are presented.
The present Summary Report starts with the presentation of a fundamental outcome of the work reported in the above docu-ments: the characterization of ground motions for a "typical hard rock site". The objectives of the study are judged to be most easily explained and illustrated by these results which can then serve as a background for the description of the applied basic methodology and of further processing to account for specific site conditions etc.
The results presented in Report Nos 1-3 are relating to "a typical Swedish hard rock site" with the following basic seismo-logical and geoseismo-logical characteristics:
The "seismicity" is defined by "the average Fennoscandian seismicity function". (The word seismicity is used ina broad sense in this report, implying the rate of occurrence of
earthquakes, past and expected, over the entire scale of
magnitudes and other characteristics). The derivation of the seismicity function is described in Report No. 1.
The transmission of the seismic waves from the source to the surface of the ground is through hard rock with the average properties of Swedish basement rock in respect of its effects on the wave propagation.
Since the large scale geological and seismological conditions around the individual nuclear plant sites are not very different as regards their expected effects on the seismic ground motion, the results obtained for the "typical hard rock site" can be taken as a basis for the characterization of the ground motions at the individual sites, after appropriate transformations to account for specific local conditions, seismological as well as geological. Within the scope of the present project such considerations have
been made for Ringhals NPP and Barseback NPP. On the basis of
seismicity considerations accounted for in Report No. 1 and geological studies accounted for in Report No. 5 the following conclusions have been drawn:
The characterization of ground motions for the "typical hard rock site" is directly applicable to the Ringhals,site without any modifications.
The same characterization of ground motions can be taken as representative for an imaginary outcrop of the basement rock at the Barseback site. The characteristics of the ground motion at the building foundation levels can then be deter-mined by assessment of the transformation of the seismic waves from the real basement rock through the existing layers of sedimentary rock and surface deposits as described in Report No. 4.
Site specific ground motion characterizations for the Forsmark and Oskarshamn nuclear plant sites are not within the scope of the present project. The ground motion characteristics for the "typical hard rock site" are, however, applicable also to these two sites as a basis for assessing the corresponding site specific characteristics by appropriate modifications, to account for pos-sibly deviating local seismicity and other conditions.
In Report No. 1 the probabilistic parts of the assessment of ground motion characteristics for the "typical hard rock site" are accounted for. In Report No. 2 it is described how the spectral characteristics are related to the fundamental source and wave path parameters, viz. the seismic moment and the focal distan-ce. In Report No. 3 the generation of synthetic ground motion time-histories is described.
Report No. 5 contains descriptions of the near-field geological conditions at Ringhals and Barseback and analyses of the near-field from a seismotectonic point of view.
2. BASIC OBJECTIVES AND RESULTS
The overall purpose of the Swedish study is to provide a reliable basis for the prediction of the responses of nuclear structures and equipment at various defined levels of extremely low proba-bility. For this purpose the ground motions (GM) at the sites of the facilities had to be predicted at various specified probability levels, closely to the extreme levels associated wi th the ultimate
capacities of structures and equipmen~ For th~ nuclear plants
the qualification levels are set at 10- and 10- annual events
for the exceedance of the containment integri ty limit and the safe shutdown and core cooling limit, respecti vely.
For engineering purposes the ground motions have been charac-terized by means of ground response spectra and corresponding synthetic GM time-histories (accelerograms etc.). Response spectra were provided for various ratios of structural damping. The spectra were outlined for a horizontal (principal) and for the vertical GM direction. The time-histories were produced for the vertical and two statistically independent orthogonal horizontal directions. Basically, the ground motions were characterized for
a generalized "typicall1 hard rock site with an outcropping
basement rock, and site specific conditions were then accounted for, where necessary, by modelling strata of sedimentary rocks and soil overlying the basement rock, for example.
For the sake of brevity the following description of the Swedish study starts with a demonstration of results in the form of a set of ground response spectra which will then be referred to as a basis for further explanations of objectives and applied methodo-logy.
The co-called I1Envelope Ground Response Spectra", displayed in Figure 1, may also be referred to as "Uniform Hazard Spectra". The spectral values represent limits of single-degree-of-freedom
re~ppnse~6hat are _~pected to be exceeded at the frequencies of
10 ,10 and 10 annual events per site, respectively. Since
the exceedance of a certain spectral value may derive not only from one but from several types of earthquakes, from strong distant to moderate near-field events, the combination of modal responses obtained from one single envelope spectrum implies a certain approximation. However, in the actual case of a fairly uniform regional seismicity distribution, the envelope spectra become rather narrow and can be used with a good approxima-tion for multi-degree-of-freedom structures, particularly for the large buildings of the nuclear plants, for which the fundamental (rocking) modes of vibration are quite predominat. Due to this realistic feature of the envelope spectra, the corresponding synthetic GM time-histories can be generated and generalized for each probability level, and it is not necessary to use several event specific spectra.
An example of such a synthetic time-history is displayed in Figure 2. For the sake of realism the strong motion duration has been chosen so as to represent the typical duration of the
shear-wave phase of near-field earthquakes with magnitudes of 5 - 6
which category contributes predominantly to the seismic risk associated with the Swedish nuclear plants.
A complete set of Envelope Ground Response Spectra for the
"Typical Hard Site" is enclosed as APPENDIX 1. The
corre-sponding spectra for Barseback are presented in APPENDIX 3. The synthetic seismograms displayed in APPENDIX 2 and 4 constitute two complete sets of GM time functions to be used as input loads for computing structural responses at the various
defined spectral exceedance levels. The seismograms of
APPENDIX 2 are relating to the "typical hard rock site" and those of APPENDIX 4 to the Barseback site.
The numerical values are stored on discettes compatible for IBM
pes.
The seismograms have been given a sufficient degree of realism to be used not only for linear elastic response calculations but also for calculation of nonlinear response and effects of repeated cyclic loading. As regards the realism of the seismograms it has to be accepted that the lowermost frequency waves cannot always be simulated in a completely realistic manner only by random phasing. However, it appears that the seismograms for Horizontal Direction No. 1 and those for Vertical Direction are fairly realistic also in respect of the lowermost frequency waves. This is most clearly manifested in the velocity and displacement time-histories. The seismogram for Direction No. 1 shall there-fore be used with priority to represent the horizontal ground motion along a principal axis of the ground motion. In case the structural response has to be determined for ground motions along two principal horizontal axes the seismograms for Direc-tion No. 2 shall represent the moDirec-tions along the second principal axis, orthogonal to Direction No. 1.
/""
X :;V"" X V ' - X I I / i l VV
f'., !/17
Iv
/ 'KI
A~V
WJill
~/
v
I><
V "'11~~
~
~
t/v
t::~""
~
v
I><
v
lJl1
K~
K
'"
!/~
~
~ ~ b'~
~
1"'- Vl/
"'-~
It'
l'\l/
I' 0.1 ./ k !::::~kJ
v
r-p
t":~
./ l'-.t:,k' !'" 0.001K
""K
[)k
¥""-/
DK
~l{'t/
Dk
J
l't
/ / t'-~/~/
"-.~r"'/ ~ll
0.1 1.0 10 100 FIGURE 1: Frequency (Hz)Envelope Ground 'Response Spectra for a (princi-pal) horizontal GM dir'Sction'6relating t?]
exceed-ance frequencies 10-, 10- and 10- annual
events per site and damping ratios 0.005, 0.02, 0.05, 0.07 and 0.10.
Ac.cel_r_t1on IffI/ ... 2)
3 . 0
:::
,
,~
r~"II~~~~~I~-'
r.
h~
IhnJdl
,t
1!~ I~ll~, ~~,,~
I, .0".. •--0.0 10.:5 T 1.... e.1
::::1
z=~
0 . 0 , 0;;r:-:
~ = = a.ooo c::::::::;::> ... - 0 . 0 1 0 0 , 0 10.:SFIGURE 2: SynthetiC GM time-histories corresponding to the
response spectra for the exceedance frequency 10- 6•
3. METHODOLOGY
3.1 General approach
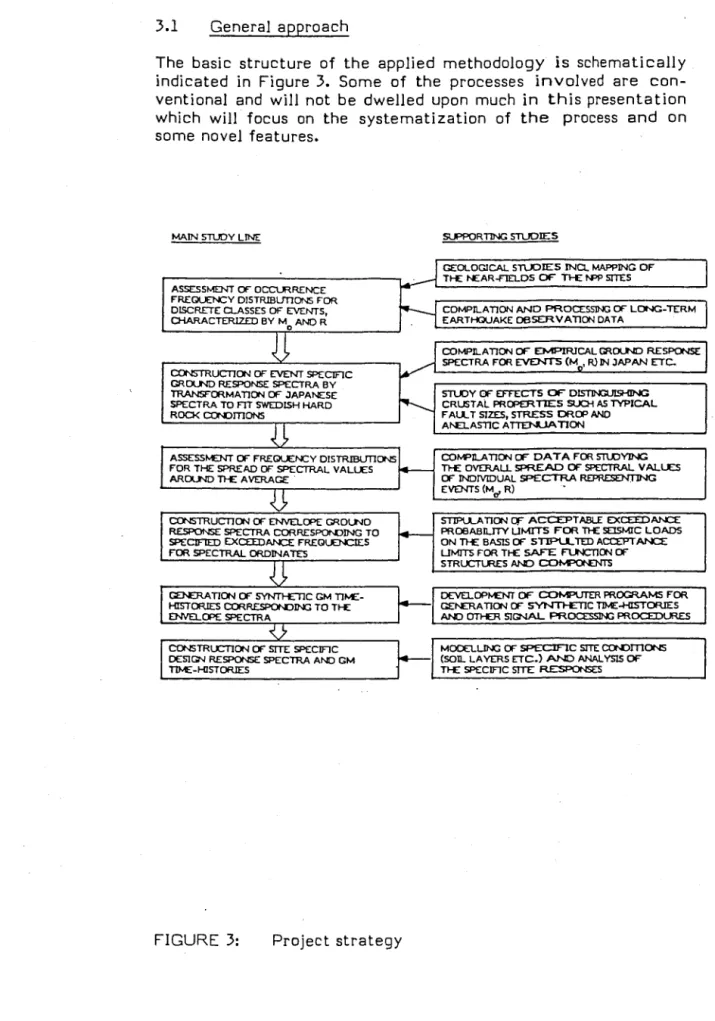
The basic structure of the applied methodology is schematically indicated in Figure 3. Some of the processes involved are con-ventional and will not be dwelled upon much in this presentation which will focus on the systematization of the process and on some novel features.
MAIN STUDY LINE SUPPORTING SlUDIES
GEOLOGICAL STUDIES [No.. MAPPING OF Tt-E I'£AR-FlELOS OF"" TI-E N>P SITES ASSESSMENT OF OCCURRENCE
FREQUENCY DISTRlBUTlONS FOR
DISCRETE O-ASSES OF EVENTS,
N
CDMPn..ATION ANO PROCESSING OF LONG-TERM D-lARACTERlZED BY Mo AND R . EARTHQUAKE OBSERVATION DATAU
o
COMPn...ATION OF EMPIRICAL GROLND RESPONSE CONSTRUCTION OF EVENT SPECIFICSPECTRA FOR EVENTS (Mn , RlIN JAPAN ne.
GRDLND RESPONSE SPECTRA BY TRANSFORMATION OF JAPANESE
r----
S1U:lY OF EFFECTS OF"" OISTll'GJlSHlNG SPECTRA TO nT SWEDISH HARD CRUS TAL PROPERTIES SUCH AS TYPICAL RDO< CtJ!'-OmONS FAll.... T SIZES, STRESS DROP AND.!J
At-ELASTIC A TTEt"-.JA TIONASSESSMENT OF FREGlUEN::Y D1STRIBUTlDNS
f.-
COMPILATION OF DATA FOR STU)YING FOR THE SPREAD OF SPECTRAL VALUES n£ OVERALL SPREAD OF SPECTRAL VAU£S ARDLND n£ AVERAGE . OF INDlVIDUAL SPECTRA REPR.ESENTJNG~
EVENTS (Mo' R)CONSTRUCTION OF ENVELOPE GRDLND S11P\...LA nON q:-ACCEPT ABLE EXCEEDAN::£ RESPONSE SPECTRA CORRESPONJING TO
f4-
PROBABn...rrv UMITS FOR n-E SEISMIC LOADS SPECIFlED EXCEEDANCE FREQu:::NCI£S ON 1l-E BASIS OF STlPU... TED ACCEPT AN::£.FOR SPECTRAL ORDINATES UMITS FOR Tt-£: SAFE F1...NCTJON OF
U
STRLJCTU'U:S AND CO~GEN::RA TION OF 5YNTl-£T1C GM TIM:- OEVEl...OPr-£NT OF COMPUTER PROGRAMS FOR HISTORIES CORR£SPON:)INJ TO TI-E: GENERA nON OF SYNT1-£TIC TlME-HlSTORIES ENVELOPE SPECTRA AND OTI-ER S1CNAL PROc:ESSN:; PROCEDURES
0
CCNSTRLCTlON OF SITE SPEcznc MODELLINJ OF SPEClF IC SITE CCN)mONS
DESI~ RESPONSE SPECTRA AND GM (son... LAYERS ETC_) AND ANALYSIS OF TIIvE-HlSTDRlES n£ SPEcznc SITE RESPONSES
FIGURE 3: Project strategy
E17/15fc-01a
3.2 Assessment of occurrence frequency distributions of seis-mic events
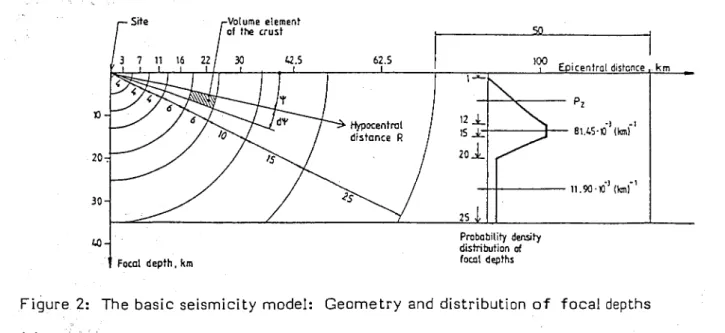
The geometrical characteristics of the seismic hazard model are illustrated in Figure 4. The probabilistic calculations can be summarized as follows:
Over the entire significant range of earthquake sizes and locations the events were categorized in respect of the
seismic moment M and the focal distance R. The width of
the classes were de~ermined so as to be approximately equal
in respect of the ratios between GM values at the upper and lower boundaries of each class of Mo and R.
Large scale seismicity zoning and seismotectonic considera-tions resulted in the choice of an average Fennoscandian function of epicentral density, directly applicable to at least two nuclear plant sites (Ringhals and Barseback) with respect to the seismicity.
For each volume element of the crustal model (Figure 4) the occurrence rates of the various classes of events were determined on the basis of an epicentral density function, indicated in Figure 5, and the probability density distribution
of focal depths (Figure 4). The epicentral density function
was derived from available catalogues, covering earthquake events in Fennoscandia for a period of almost 500 years. Since, in the basic model, the occurrence of all sizes of earthquakes are assumed to be randomly distributed over the entire Fennoscandia, the calculations could be simplified by • regarding hemisperical volume elements, each with the same proportion of the total frequency of earthquakes affecting the site at the centre of the model, either when regarding a certain size of earthquakes or when including the entire significant range of sizes.
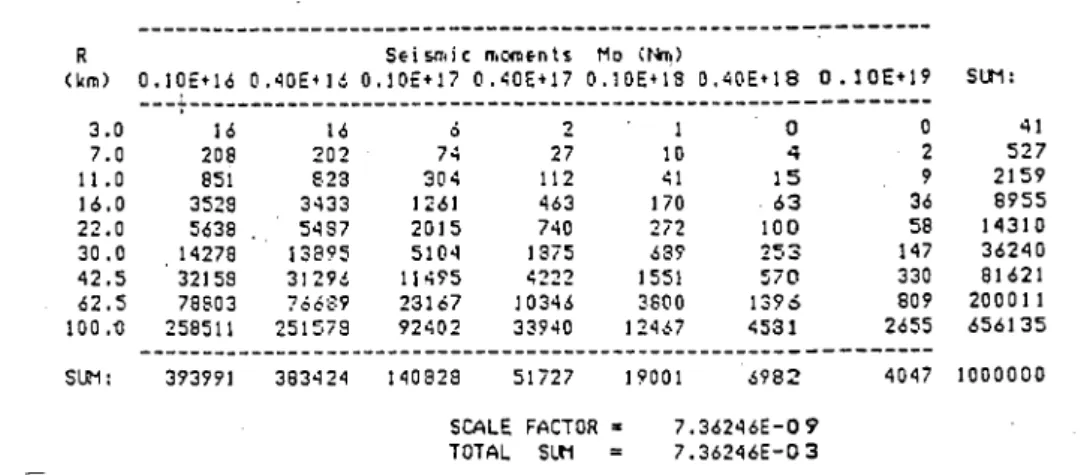
The result of this first step of the probabilistic assessment was a matrix of occurrence frequency values for each selected class of events characterized by a certain combination of the seismic moment M and the hypocentral distance R (Table 1).
o R (km) 3.0 7.0 11.0 16.0 22.0 30.0 42.5 62.5 100.~ SUM: S~isn,jc n.ooe-n t $ Ho (tfl,)
O.IOE+16 O.40E+160.IOE+17 O.~OE+17 O.IOE+18 0.40E+18 O.10E+19
-
---
---- ---- ----- ------------- -------------- - - - ----- - ------ ---16 16 6 2 I 0 0 208 202 74 27 10 4 2 851 523 304 112 41 15 9 3529 3433 1261 463 170 ·63 36 5638 5487 2015 740 2i2 lOO 58 14278 13895 5104 1875 68S' ~..
~ ~ . . I~ 147 32158 31296 11495 4222 1551 570 330 78803 76689 23167 10346 3600 1396 809 258511 251578 92402 33940 124~7 4531 2655 --------- --------------------- ---393991 383424 140828 SI i27 SCALE FACTOR=
TOTAL SLtI 19001 6982 7.36246E-09 7. 36246E -03 4047Table 1: Incremental recurrence rate values E17/l5fc-Ola SLN: 41 527 2159 8955 14310 36240 81621 200011 656135 1000000
20.
30
40
The reasons for using the seismic moment M as the fundamental source parameter are mainly relating to itC§ direct relationship with the mechanism of a fault slip: the released energy, the stress drop, the displaced area, the displacement. Since all these factors are interrelated through the seismic moment and deter-mine the character of the emitted waves, it is appropriate to use the seismic moment as the basic earthquake size parameter. As regards the probability assessments, the choice of M as the basic probabilistic parameter does not really improve theOquality of the database, since the sizes of the historical events, both in Fennoscandia and in other regions, are usually expressed in terms of magnitudes that are in turn sometimes estimated rather roughly, from intensity observations etc. However, magnitude scales are different and since a homogenization must be carried out on this point under all circumstances, this homogenization can very well have the form of a transforma tion from magni-tudes expressed in the various scales to the equi valent seismic moments.
so
I
lOO E ic@ntral distance km
Focal depth _ km FIGURE 4: E17/15fc-Ola -+--~-- Pz . . / - - - - . J . -81.4S-X)-1 (Ioni' Probability density distribution of focol depths
Geometrical division and distribution of focal depths adopted for the calculation of hypocentral densities of occurrence
~s ,---.---r---~----_r---r_----~---r_----r_----~
~~
(J "C Circles Clt'OOOd
E
New England average§
c: the 1904 epicentre:I
I
I~ ~ ~'iiR.~~~==ii~fj~~~~~~~~
~
E
R = 2000 km / " . Western Scandinavia'" R = 500 kill - - . j - J
.:: .::J. R = 300 kill ----t----J .... (mainly Norway)
0" , ',~.
GlDl 7 ... ,
(J ~ ~ +-=-~~~~~--~~~~--~~~~--~~----~--~
c: .., Ringhals cirde. R=2501un
.go..
~!i (J c: IJ-I )( Gl W ~ Ringhals circle. R=200 km Barseblick drcle. R = 200 km R~ SOO-f---IV R= 2 000 -+---+../ 1J~;---~---t---1---~---+---~---+-~~~L---_4 ~~1_----_+----_+----~~----+_----~----~---+_----+J--~~ Seismic moment M 1J-111-___-+ ___
t-_ _ 1-___-+ ___
+-___+ ____
+-___ ~o=---_4 'IJ~ FIGURE 5: E17 /15fc-ola lOll. 10"The adopted average Fennoscandian epicentral density function compared with curves connecting data points relating to various geographical zones.
3.3 Development of characteristic ground response spectra for various classes of events
The model used for the development of "event-specific" ground response spectra is based on the processing of empirical data from more seismic regions to suit the typical conditions in Sweden. The main rationales for the choice of this approach are the obvious lack of local data concerning ground motions gene-rated by strong earthquakes, of the sizes judged to be decisive in
the risk analysis of nuclear facilities, and the fact that
generalized empirical e?<pressions for effects of differential geological and seismological conditions indicate a moderate influence on the shapes of the ground response spectra .
. . , .• ~ .
A fairly comprehensive and well-defined database in the form of
empirical ground response spectra, mainly from Japan, is now
generally available (References B-ll). Since earthquakes with
sizes that are extreme for Swedish conditions occur with a relatively high frequency in the more seismic zones in Japan, the empirical support for outlining response spectra concerning an intraplate region such as Fennoscandia is likely to be as strong as the corresponding support for extreme earthquake predictions in the 'more, seismic regions, provided that the above-mentioned transformation is accurate.
;"'J
The characteristic, response spectra for Swedish conditions are therefo're obtained by, modifications of. the corresponding Japa-nese'spectra with respect to the influence factors that are expected to affect the spectra differently. These factors are
associafed with~ differences of source parameters such as stress.
drop :cand)aultc"area, and of wave propagation effects like anelastic attenuation. Since the resulting differences are mode-rate, the transformation of the Japanese spectra has been based on' generaliied, best-estimate valu'esof the influence factors • • '" ' . . . t .
F.b~",the transforr+l~tion
of ground response spectra from onegeological region to another the differential source and wave path 'characteristics must be identified and quantified, at least relatively. This can be achieved on the basis of empirical relationships arid simple energy consideration, coupling the seis-mic wave amplitudes to the most important source and wave
path paramet13rs. We will start from a Fourier amplitude
spectrum .formUla of the type suggested by Aki(Ref. 25):
, ':., (" ( )2n)-1/2 (" )
FO=Const·FOO'1+ flfc ·Af,R (1)
w~ere the displacement wave amplitude F 0 is a function of the
"zero frequency amplitude" F ,the "corner frequency" f and
the "anelastic attenuation fuRccr.\on" A( f ,R). These
param~ters
are related to the stress drop SO, the fault slip area S, the seismic moment M , the focal distance R and the shear modulus
G through the fo~lowing relationships, deriving from various
empirically supported models of faulting and wave transmission.
3/2 M = Const· SO· 5 o . M = Const· G· F DO· 5 ,~ 0 ~" '
-1/2
1/3, f '.
=
Const· 5=
Const· (SO/M ).c~ , 0 , ." 1}"". R . fO•5 A(f,R)
=
exp - -'-'Q----OS'Vs
(2) (3) (4) (5)j.vhere QOS is the rock quality factor and
Vs
is the shear wave;.yeI9clty.
We may select SO and G to constitute our differential source iJ'arameters. Within the frequecy range of major interest f is large compared with f , and Eq. 1 can be written:
'-)1_' .- ' 1 . 1 , . . . C
rO:,::Const. F DO • (f/fc)-n • A(f,R) =
n
+2
l-n
-n 1 - 3 -
3" (
)
=
Const . f .G •
SO • Mo A f,R (6)A Japanese ampli tude spectrum obtained for a certain cfass of M " .. and,R can thus be transformed to fit other geological coonditions by scaling the spectral ordinates with respect to the
r~tios::be~weenthe, respective v.alues of SO, G and Q S v.s~ the
.latter product to' account for dIfferential wave path
~ondl1.lOns.
For;' the transformation from of Japanese to Swedish conditions
~ " ~ ""_'''N .. _.., .. ~'" _. . .... ~ ... ".: • . ,< • . ' ' " . " , . "~. - •
the~,'r?~ios'were_: set .at" SOs!SOJ.·
=
3, Gs/.GJ = 2 .and(Q.". v) !(Q- 'v)-=4, based on tYPIcal generallzed geologIcal
co~illti§n~:,m~,s~e~tI"al
de'cayvalue n = 2 was taken as the most .._ probabie average. ' - ,.
~;,-.--. ; ". .... ':-, . .
FoIj the transformation of a response spectrum it is not suffi-cient:to consider. the '.wave amplitudes, however, since , the amplification of the response also depends on the duration of the
strong motion. Since the d,LJration is determined by the extension
of ~,b.~J?0Jt,s-lip, the scaling -factor can be obtained from Eq. 7: '
-: , ..
_._
.... -... -... --_....
to~It~;'~(S~/s;)1/2
=
(SD J/SOS)1/3=
0.7 (7)A shorter strong motion,duration tends to reduce the amplifica-tion of lower-frequency responses. The order of that reducamplifica-tion was--estimated by studying time-histories and corresponding response spectra typical of near-field earthquakes with magni-_, tudes"of 'the, ord,er qi' 5-6, which is the category giving the
i pr~Ciom'inant statistical contribution. It was concluded that the
reduction of the Japanese spectral values, due to the reduced strong motion duration, essentially neutralizes the effects of the differential stress drop and attenuation for frequencies below
la Hz. The moderate influence of the differential attenuation
is, of course, only applicable to the near-field.
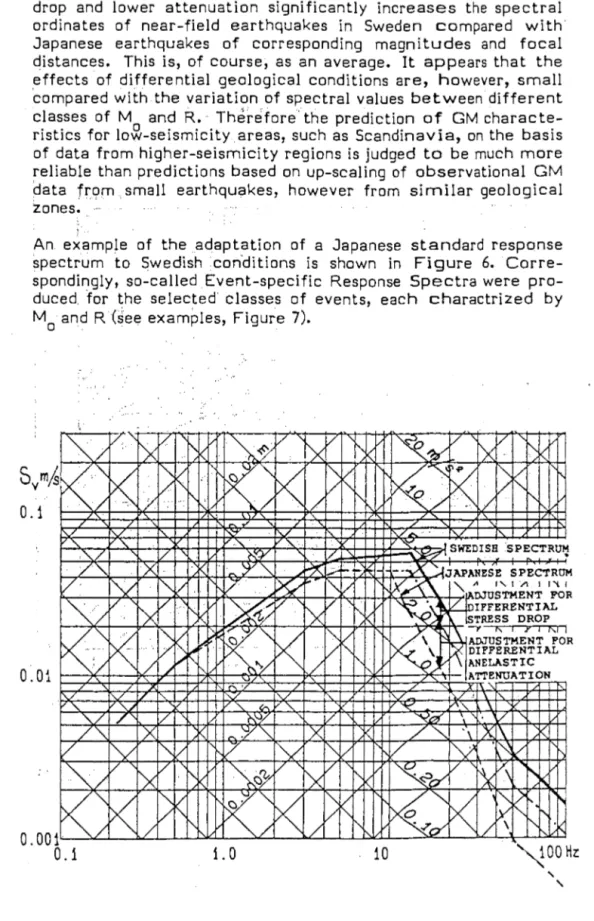
For the spectral range of higher frequencies the higher stress drop and lower attenuation significantly increases the spectral ordinates of near-field earthquakes in Sweden compared with Japanese earthquakes of corresponding magnitudes and focal distances. This is, of course, as an average. It appears that the effects of differential geological conditions are, however, small compared with the variation of spectral values between different
classes of M and R. Therefore the prediction of GM
characte-ristics for lo'£-seismicity areas, such as Scandinavia, on the basis of data from higher-seismicity regions is judged to be much more
reliable than predictions based on up-scaling of observational GM
data from small earthquakes, however from similar geological zones.
An example of the adaptation of a Japanese standard response spectrum to Swedishcon'ditions is shown in Figure 6. Corre-spondingly, so-called Event-specific Response Spectra were pro-duced. for the selected classes of events, each charactrized by M and R (see examples, Figure 7). o .
"
"'/
V ~
V f'~~
VD<:
V l"lt~
Vrx
V f'K~
K
1"-
K .
K:
K
I~k
~.~
K
D
K
]'\V
V
,To / L 1",L
I". /
l/
"
y . / I""" . / ./"'" '\, '\, ~ --'" ...'S:.: SWEDISBSPECTR~ ~"v/ ~ 1'-,.~ v:: J:'7 /~ .XV'
Iv
I"-V
""/
V'x
/ 1"/0.01
>(~
k:
'"
V ,.../
~~
/ / -./ 1,\"
" j /"
V /~ XV
Y
I'"
V~/
VIx
V"
K"K
/ /DK
I" 10.00
0.1
~~ ~ 127
~
1"-V
)j§;
VX
V~
K"-
K
..!"
'/
. y
/
.". L"
r-..'Y""
"
/",:t''''
X ,7IV
1"-'\w
/Ix
VK:
K
I"
V
/ 1.0 ~ r-/t'S / i"~<
"
V f'.K
I"10
-~ ~JAPANESE SPECTR OM~
" " " 1 / 1 1 1,\ 1 :,aDJUSTMENT Fa R~
tlIFFERENTIAL STRESS DROP ~ --y K 1 l' 1 KI i>{i
""-"':St:?L L~V
~
~
ADJUSTMENT FO R DIFFERENTIAL ANELASTIC ATTENUATION ~ ."'. ~ ~ ~ '.1.x
~~
'N
V 1\ /'X
'-\
~~
><
L
l"-
~
K
t-t'-.. i' I' t::,'k
~OOHz:,
'\FIGURE 6: Example of the adaptation of a .Japanese response
spectrum to fit Swedish geological conditions.
'\lV'iSJ'iS)
\Y/ LEJ.!.!2J
,.";, •... . SEISMIC'SAFETV HORIZONTAL RESPONSE SPECTRA
.;, : '''II!IINIC ~ .... - a.OESI I .... I
LOCAL. I BNmIIH I ICAINITIJ:l!"'!IIl - I. I
. ~ .:,
IWI'IN5 RATIO: O.O!!
fOCAL DI&T AHCE: :I .7 U · tl 22 30 IIG toa I k_J
-" Velocity (115 ) . . Displ. . ( I) ,,' Ace.
'./s82)-1.0,
f-..-.7"-V
'~vII
v-,'-"-,, "- "-"""
~'"
V .~./ V .' _""-L V . ;: /~ . X .. I~~ " 'X / " ,..x
..
~VI'v
I""V l7·v
I)t;:'
v"\
Iv
. 1'\1/~/v
!XV
~~ . / V ~v f\ ~VIX
f\ I""k
'- ~ I'\v " I) .... IL: V I";K"
' ... 0/K
l/~
K
~
-~
P<
~
Vf\ ./ I' ." f\ )-. V
0.1
' - /"
A / V V\ ~V/
I'v
P\.J
V
0.01
~
k
"-J ~ ./ , , / / ' \.-V
~
0.001
0.1.
FIGURE 7: ~v.
K
E17/15fc-01a IX':""
/ "- ~~ . \ I/, ~ V ~ -.\ ,\ V' IL: X V-~" V X/"-'
~ !2;f\
1"\ 6-'~17/
Iv
V
I"'VV ,
IV
['\1/'''''
~
v.
~
i'"~
~
~.~ ~ V \1\
~
I' V \.. f'< V~
~
'"
1//,
~
["~
l"'-f>.
~
~~~
t1 ['\1'~
i\
K
~ ['-k-.-..,
"
-"-~ :-::~-,
V ~ V ~ V' ~ X .' L ...:7''''-
····X k-X'_'-"'-f\ [)<--
D<'V17
l'\ D....,.. V~ ~ [\n
VI',"-)(
v
I...:~~v
rx
V~
~~
P\
f\~ P<--: ~ /K:
><
I""K
~
><
;~
:><~
/ '\",V
~r-. / /'"
~"~
1.010
100 Frequency (Hz)Examples of Event-specific Ground Response
Spectra
3.4 Assessment of the spread of spectral values
Since the various selected events and their corresponding characteristic response spectra have been classi fied only with
respect to the "fundamental parameters" M and R, it is not
surprising that there is a considerable spreaJ> of spectral values around the average. This spread has been assessed in a genera-lized way, once more on the basis of Japanese data (Ref. 2), reprocessed to suit the conditions pertaining to in the Swedish model. Thus the combined effects of other parameters than the fundamental are considered, though without identifying their individual contributions, that would not be possible at the present state-of-the-art. A considerable part of the spread is probably due to errors in the data acquisition and processing system, including the uncertainty associated with the use of various magnitude scales and transformations between such scales.
On the basis of the Japanese data a generalized distribution function, normalized to the mean spectral value as unity and independent of the frequency of Vibration, was thus developed (Figure Ba and Bb). 5 4 3 2 '" e . c 1 0 ~ ... 0.5 u 0.4 u 0 ::: 003 c 0 0.2 ~ ~
..
:; 0.1 ] .c « 0.05 O.()I. 0.03 0.02 . ...--:-... . /'-.
I
/.-.-.-.
'.
\
0.1"'"
.
.
\
\
.
.
\
\
.
.
\
\
.
0.2 03 OS Period.s.
\
\
.
.
"
"
'"
2 3 4FIGURE.Ba: A characteristic ground response spectrum for a
E17/15fc-Ola
certain class of M and R and its 5-percentile o
, ~:: . (":" " .~
0.".
~---, ' \ ~ ,~. Co. ~ :c .8 e Co...
v 0.'" 0." O.t 0.1 0.' O.~ 0.' ~ 0.) ,..,..
" ~ :1,0.2 W o. , ~o~ 0.0, .OO~ : (' , O.OOt OOOO!i , 1 I • ~'. . SpHtrol velocity raHc Sv IS. mean
,FIGURE8b:. Cumulative probability distribution of spectral ordinates.
'3.5 Construction of Envelope Ground Respons Spectra
On the basis of the derived occurrence frequency distributions for discrete classes of events, the Event-specific Spectra of these classes and the relative distribution of spectral values, the frequency of exceedance of a certain spectral value was deter-mined for each class of events. The overall exceedance frequen-cies were then determined for various spectral values by adding the contributions from each class of events.
For each selected probability level the so - called "Envelope Response Spectra" were finally constructed by interconnecting discrete spectral values, corresponding to the given level, ob-tained from the overall exceedance frequency distributions
men-tioned above. On the basis of empirical relationships between
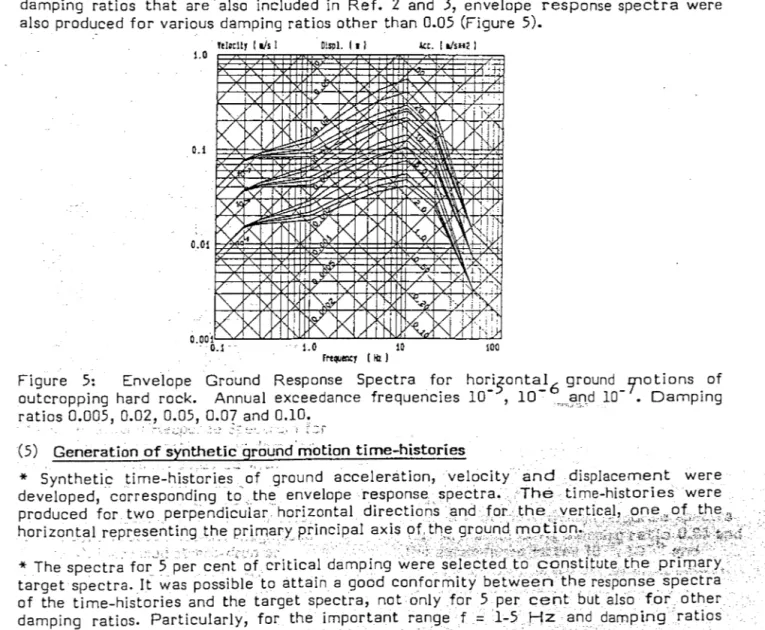
response spectra for various damping ratios, which relationships are also included in some of the above-mentioned Japanese publications, Envelope Response Spectra were also produced for various damping ratios other than 0.05 (Figure 1).
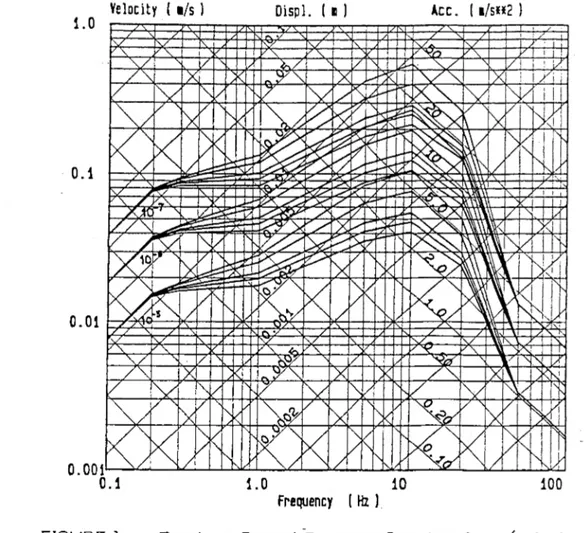
3.6 Generation of synthetic ground motion time-histories Synthetic time-histories of ground acceleration, ,velocity and displacement were developed, corresponding to the Envelope
Response Sp~~ctra (see Figure?, for example). The time-histories
were produced for two perpendicular horizontal directions and for the vertical, one of the horizontal representing the primary principal axis of the ground motion. The basic' demands were satisfied as follows:
The spectra for 5 per cent of critical damping were selected
to constitute the primary target spectra. '
As demonstrated in
Fi:g:~'~e9'Tt
was possible to:attain a goodconformity, between' the response' spectra " of the time-histories and the target 'spectra, not only for,,5 per cent but also for other damping ratios. Particularly, foithe important range f= 1-5 Hz and damping ratios below O.02,;the agree-ment is remarkably good.
. '. . "-,,-'
The time-histories could be given a realistic duration of the various phases 9fptrongmotion, implying .that the'y may be used not only for linear,;but also for non-linear response calculations, witnout causing any major deviafions from a realistic response, e.g. accumulated residual • strain and
dis-place'ments etc.' ' ,
Since the relation between a velocity response spectrum for zero-damping and the corresponding Fourier acceleration
ampli-tude spectrum is very close, a typical spectru m of the latter
type was used as a basis for each iterative procedure of time-history generation., A rpnd9r;nphase distribution was assumed.
The transient character o{~>the, time-history was obtaine'd by
multiplying the'~ stationary' trrne-history
by
an ' intensity, timefunction, based on empirical 'data and given as strong motion duration typical of the largest earthq'uakesof any statistical significance.
·'f"· 1.0 0.1 0.01 FIGURE 9: _1Nl; ""no: '.0115 0.02 O.O!! 0.07 0.10
EXCITATION HIaIr hent.l-t
Velocity (1/5 I Oispl. (. J ltc. ( Il/su2 J
~
-/ft'
C\~j-~
:{.
_..
""
'""
- T-r-x
X ,~..
"
Ix
v: -
:x
1/ V"/
7 V I" H IV ~..-."'-/
'rx
'\:"/
l~
If
6t~~~
Ix
,7K:
>(
"
/"~
~~
~
/!J~
.~~
K
! /'"
/ 1/.... r<i . ~, / " , / "- ~. v_ V~
V /'9'''
X/"
1\>( ~/b-
~ 7- V I"- / ~~ ,\ 1"-./~
"x
~'l-/'>t
"
~/ ,~\>(~
>(
"/
<."
><j
I"<~
>(
"'
~
~" / " / V / . / / "<'d 17v,,·
X /" X 1.0 ' . 10 100 Frequency' ( Hz IComparison between Envelope Ground Response Spectra, generated by the ground motion time-history displayed in Figure 2, and corresponding target spectra. (Damping ratios 0.005, 0.02, 0.05, 0.07, 0.10)
3.7 Site-specific ground motion characteristics for Barseback
Starting out from the ground motion characteristics derived for the "typical hard rock site", the corresponding characteristics were determined for Barseback, taking the speci fic seismological and geological conditions of that site into consideration. Basi-cally two aspects were considered: the seismici ty aspect and the wave propagation aspect, the latter being the most obvious concern, since the Barseback plant is founded on soil deposits which, though extremely dense, cannot be equalized with hard rock. Furthermore, there is an intermediate 2 km thick layer of sedimentary rocks overlying the hard basement rock below the
plant:" ' .
In order to investigate whether the "average Fennoscandian seismicity function" could be used as a reasonably conservative
basis for the probabilistic considerations relating to Barseback, potentially differentiating factors were examined. On the basis of available, fairly detailed, information from site investigations and general geological mapping, the near-field of Barsebi:ick was scanned with respect to the existence of potent ial earthquake sources. Hypothetically, the existence, even within the Barse-back area, of steep fault planes in the basement rock, as discovered in other parts of SW Scania, was considered, and the earthquake catalogues were reviewed, looking for any sign of increased seismicity or connections between the location of the epicentrci of historical earthquakes and indicated or suspected faults.
The geological investigations and considerations, as well as the historical records, did not supply any indications, pointing at Barseback or SW Scania as a zone deviating signi ficantly from the rest of 'southern Sweden in respect of seismic hazards. Therefore the "average Fennoscandian seismicity function" was adopted for Barseback, most likely implying a portion of conser-vatism as in its application to the Ringhals site.
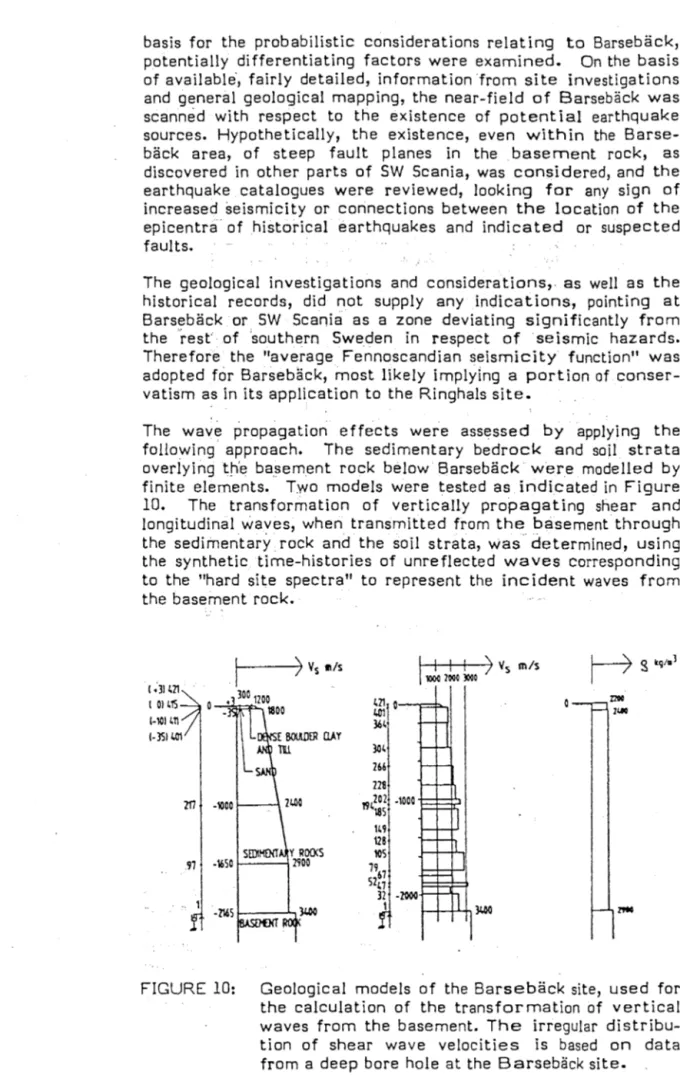
The wave propagation effects were assessed by applying the
following approach. The sedimentary bedrock and soil strata
overiying the basement rock below Barseback were modelled by finite elements. Two models were tested as indicated in Figure
10. The transformation of vertically propagating shear and
longitudinal waves, when transmitted from the basement through the sedimentary. rock and the soil strata, was determined, using the synthetic time-histories of unreflected waves corresponding to the "hard site spectra" to represent the incident waves from the basement rock.
I ~31 411 I 01415 1-101411
f----...,)
Vs IllsI
I I I ) Vs m/s 1000 2000 3000 411 0 = > -1,01 364 304 266 228 1'14202 -1000 185 149 128 105 1967 5247 ]2 1FIGURE 10: Geological models of the Barseback site, used for
the calculation of the transformation of vertical waves from the basement. The irregular distribu-tion of shear wave velocities is based on data from a deep bore hole at the Barseback site.
E17/15fc-Ola
An example of the results is shown in Figure 11, in the form of Envelope Response Spectra relating to various levels and, for comparison, the corresponding response spectrum relating to outcroppingrock at the "typical hard rock site".
~ ;; i , Velocity 11/5 J Displ. I.) Ate. (a/sH2 J
1.0
"
"
~I'l , "-/ .' ~/ /""""
v /." X ~" X ~~ I~ " \ X I / ,!V
:'\[/7
IV
::.:;/ ~ 3) I~ ~ 1"[/ .,' :' c~/
:/Ix
,
'\J,
~
i2<
~,...t'<~
~)
v'\
,><t
'>()
~
'\~;'~
K
li
"'-~~
~
:x
1"'-[/ b-' ~,
~~~ V'" 0':1 •.,
., /L'-J '. ~,y V -.i ~v , . [ " ' - ~ ~" X /"-, l ~ ?/V
'\v 7IV
"'-/
V
"-xA
'\
1\
~/
.,IX
1 ~VvIx
,
~
/ 'f\<
~
<:
>(
'\[/~"
K
)K
K~
>(
"'>
/'">\,
/.,
, y '/ / !' ~"." .' I '1, • 0.01 ' . ."
'< ~"
~ ':. "'-/ r...'V / ~ / /"'- .. x':::v"-,
., X/"
XV>
. -~..
V
'\v
7
IV
"V
VV
' \ /""'/
/ ,.IX
.,
~~
v·rx/
~c7
, /rx
/ . 0.00K"'->(
)K
K~
K
"K
~
>(
i"'-/ /"
/"\ / /.'
L L 1 . " . .0 ,~ '1.0 10 ;'.,' f~cy ,( HI J 100 FIGURE '11: " ~ " . , :' :.Envelope groljld response spectra for the
probabi-lity.level 10.- , damping ratio 0.05 and horizontal
direction., Curve 1: Curve 2: . Curve 3: Curve 4: Curve 5: \ ,"
,iTypical hard rock site" Barseback El. +3 m
Barseback El. Zero (MWL) "Barseback El. -10 m
Barsevack El. -2165 , (basement)
;" I
The effects of amplification due to the wave transmission from
hard to ~ofter rocksJseyident over the entire spectral frequency
range. Wi thfn the important frequency range 1-5 Hz this "site
amplification" amounts to 30
a
40 per cent. Waves withfrequencies exceeding about 4 Hz are additionally amplified when propagating through the soil strata.
'1"' •.•. ~ .... .
. ' I "
-Th~:'order of amplification was found to be in good agreement with observations from similar sites in Japan (Ref. 26).
4. CONCLUDING REMARKS
4.1 Uncertainty ranges
The ground response spectra developed for the characterization of ground motions in Swedish hard rock have been derived basically from empirical data, including the bases for the
trans-formation' from Japanese to Swedish response spectra. The
spread of data has been accounted for by a probabilistic treat-ment of' the fundatreat-mental parameters, but for other parameters average or' other, characteristic values have been accepted. Effects of the inevitable spread of such parameter values from case to'- case' 'are judged' to be reasonably well accounted for by the application of a general spread of spectral characteristics, which spread has also been empirically assessed.
However, the averages of the parameter values were assessed by best 'estimates.<'Therefore, some of the most' important para-meters or 'functions have been selected for examinations as regards the sensi,tivity of the results to parameter variations.
1 - :-,' ;~·J~>t·· ~
. ,
.,
The following 'functions or parameters have been studied:
~ , . ' ~( .
*
*
*
*
*
The,"basi~-seismicity function" or "epicentral density
func-tion" (A curve based on "local seismicity" was compared with
the spectrum curve based on the average . Fennoscandian seismicitYiinorder. to quantify a possible range of
conserva-tism).-' ,. '
The upper boundary (:'cut-off") magnitude or seismic moment.
(The cut-off w~s moved from ML
=
6.5 to ML=
7.0.)The Japanese response spectrum formulation.
(A
less conservative formulation, given in Ref. 8.-was tested.)The characteristic stress drop and the spectral decay factor . n. (The ratio SDS/SD J w-as doubled.)
The "rock quality factor" Q and the anelastic attenuation
function. (The ratio QoS/Q oJ ~as doubled.)
Except for the "seismicity function" and the alternative spec-trum formulation, only parameter deviations tending to increase the responses were tested.
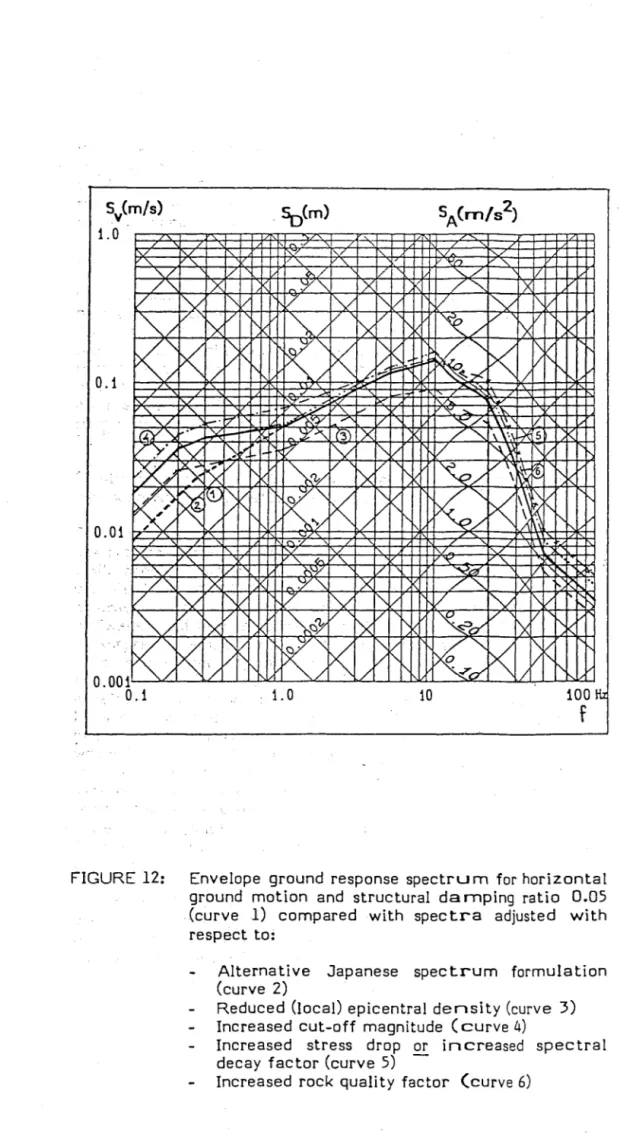
The results of the sensitivity tests are summarized graphically in spectral form in Figure 12.
The conclusion is that the sensitivity of the spectral values to parameter variations is moderate and that the proposed spectra appear to have theappropriate position for being regarded as the best estimates when taking all the most probable parameter variations together. Particularly, within the frequency band 2-5 Hz which is of major importance for the reactor buildings and systems, the sensitivity of the spectrum towards the uncon-servative side appears to be small.
"""""
,
-,
""
,
,,/
V -~ / ~L / " X :;V~ X ~~x
v
Lv
"V
l7
Iv
I" VV
~ I"v-~
V [2<: V f'~/
Vlli
V I'~
V2<
V I' v 0.1K:
k
I"K .
K;
K
I" V-V,"
k
I'V VV
~p<
VI' / I' ./: ~~
,L I'I...-'<.
.J'\2"--."
~z ~ ~ ...::. ~ "'-./ 1<--[:i"" ~~ " V ~ ..l\:. ~ laY) ~ t- ~ J'"SL -~ L~ hl-.\ 1-;X5V7~
Kt
I'; V.t7'"
Iv
I"-V
V
~ I"Vv~
~
~
V"
~'V
v
!XV
I'~/
V\~
~ I' f'"/ )
~
l~ I"k
K~
K
I"K
~
K
\\
~KI'
~~
V
V \ / i" / I' ) V - 0.01,
V\"
~ , , , / v ' ~'Y V -~ !." / " \ X :7" X L~ )<V
Iv
I"v
V
Iy
I"V
V
LY'
I'V ~~/
VIX
V I' ~vrxV
i"~
vIx
v I'kv I"K
f'. V I'- . Vl'
V
i" V 1"1'K"K
r,v
LL
I' 1 0.00 0.1 1.0K:
K
L~
K
.L 10 100f
FIGURE 12: Envelope ground response spectrum for horizontal
E17/1Sfa-Dle
ground motion and structural damping ratio 0.05 (curve 1) compared with spectra adjusted with respect to:
Alternative Japanese spectrum formulation (curve 2)
Reduced (local) epicentral density (curve 3) Increased cut-off magnitude ( curve 4)
Increased stress drop or increased spectral decay factor (curve 5)
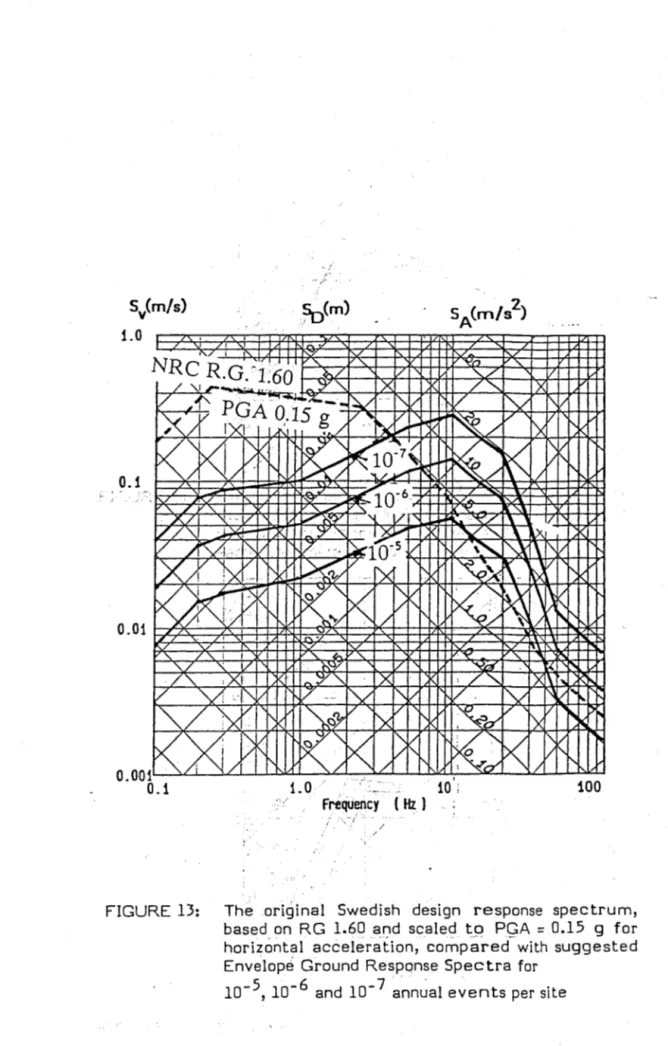
4.2 Comparison between the proposed ground response spectra and the original design spectra
In Figure 13 the horizontal Envelope Ground Response Spectrum, (for the damping ratio 0.05) is compared with the design
spec-trum specified for Forsmark 3 and Oskarshamn 3. This desi_~
spectrum was intended to represent the probabili ty level 10 , and the anchor point of the spectrum, the peak ground accelera-tion, was therefore assessed with that probability level as a target.
For frequencies exceeding about 10 Hz the agreement is rather
good between the ~iginal design spectrum and the new spectrum
for the level 10- '. For low frequencies the original design spectra are associated with much lower probabilities, not to say that they are unrealistic, even for extreme events. Within the important range 2-5 Hz, (the range of fundamental frequencies
of reactofbuildings and containments) the original design
sp~Btruni _gPpears to corr~spond to the probability range of
10 - 10 annual events per site.
Similar relations· are obtained when comparing the original and neW spectr_afor the vertical direction of motion.
L"~'
... ";
".',
.-_/
-
~Obviously,the specification of a design basis earthquake on the basis of the generalized spectra given in USNRC Reg. Guide 1.60, anchored ata peak ground acceleration, may be quite unrealistic, particularly.when the seismic hazard is expected to be predominantly related tonear-field earthquakes as is the case in .SV{edenand in many other intraplate regions. This should not be"surp·rising, since the NRC RG 1.60 Spectra are intended to cover a great varietY.of seismic events, including large distant
earthquakes. The scaling of the spectra to· the peak ground
acceleration may, however, become quite misleading, particular-ly when near-field earthquakes give the predominant seismic hazard contribution. In the near-field, before the high-frequency waves have attenuated very much, the peak ground acceleration is determined to a large extent by these waves which are not very strongly related to the lower-frequency waves of a
spec-trum. Parameters such as the peak ground velocity which are
more strongly related to the low frequency waves and thus to the fundamental fault mechanism, constitute more appropriate anchor points.
The most reliable spectrum, corresponding to a certain type of events, is, however, determined on the basis of direct empirical relationships between the whole spectral function and the
funda-mental event specific parameters, e.g. M and R, as in the
present study and in the basis for the Japane~e standard spectra.
, . / I f ' . , / '\. . .F.../ 'X" 1/ V~~V
ry~jV"1'-0.01 ' . / '\. '\. i i I , / " Vv
V·"
1/.V'V1
Dk
O.001~~/
0.1 fb(m) '. r..~7v
, 7""-
XI\r" 1.0 100 , frequency (Hz)FIGURE 13: The original Swedish design response spectrum,
based on RG 1.60 and scaled to PGA = 0.15 g for
horizontal acceleration, comparecfwith suggested Envelope Ground Response Spectra for
10- 5, 10- 6 and 10- 7
ann~al
events per siteE17/15fc-Ola ! ' I I
I
" II.
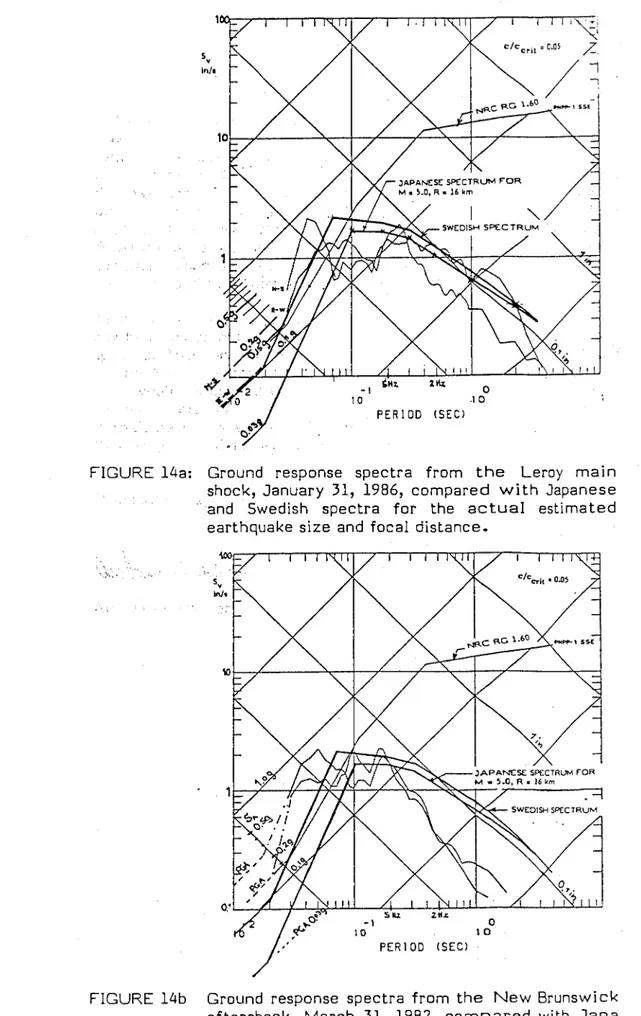
". ~ . I I t " IFIGURE 14a: Ground response spectra from the Leroy main shock, January 31, 1986, compared with Japanese ... and· Swedish spectra for the actual estimated
earthquake size and focal distance.
PER 100 (SEC)
FIGURE 14b Ground response spectra from the New Brunswick
aftershock, March 31, 1982, compared with Japa nese and Swedish spectra for the actual estimated earthquake size and focal distance.
4.3
Comparison between the proposed spectra and spectra from other intraplate regionsIn the long-te~'m perspective the outline of response spect'ra for
Swedish hard rock sites' on'the basis of data from interplate regions may _obviously be regarded as a temporary approach, to be validatedCllld probably improved in the light of an increasing databasefromintraplate regions which are similar to Fennoscan-dia from a geological and seismotectonical point of view. A few
near-field re~ords from recent earthquakes in Eastern, North
ArTlerica",have 'already been compared with Swedish "event-SP1%ific" I-espo'nse spectra for the actual seismic moment (about
10 Nm) an,d focal ,distanc~ (about 16 km). ,
; . -__ "_ ' , : : " , c,,",';':"" " , ' " , . ; " . _ .
,-" " ' : \ '
As demonstrated' in Figure 14 the spectra of the North-American ear,thquakes do not deviate very much from the proposed Swedish spectra.Thecontehi of high-frequency waves in the near':'field of the North-'American earthquakes was, however, even greater than wou.1cl be predicted by, the Swedish spectra. More data are needed to clarify if this was due to an extreme stress drop or if
it shall be:-,taken
as
an indication that the wave content withinthis rangeis'still somewhat underestimated.
Stockholni'May, 1989 Alf Engelbrektson . ' ;,.'''' .. E17/15fc-01a , I' i: I J