EXAMENSARBETE INOM SAMHÄLLSBYGGNAD, AVANCERAD NIVÅ, 30 HP
STOCKHOLM, SVERIGE 2021
Estimation of the characteristic
in-situ compressive strength class
of concrete structures: A case
study of the Skuru bridge
SARA AHMADIYAN
DANIEL MEHARI
KTH
0
Estimation of the characteristic in-situ compressive strength class of
concrete structures: A case study of the Skuru bridge
A thesis project owned by COWI
Examiner from KTH: Raied Karoumi
Supervisors from COWI: Anton Barraza Bergstrand & Filippo Sangiorgio Written by: Sara Ahmadiyan & Daniel Mehari
i
Abstract
It is inevitable that Structures become older and their intended use changes or the structural codes regulations change. In some regions the damage from seismic activities is a possibility. It becomes, therefore crucial to assess the structural capacity of such structures. The purpose of this study is to assess the different methods used for testing and estimating the
characteristic in-situ compressive strength which is the most vital parameter required in structural assessment.
The focus of the study is for existing structures where there is no prior knowledge about the concrete strength. This study first investigates and evaluates the merits and demerits of these methods for investigation of the condition of in-situ compressive strength of concrete in existing structures. A case study of the Skuru bridge that was built in 1914 was utilized for this study. The study is based on information of the construction data and some results from prior investigation performed by the company COWI. Afterwards, non-destructive tests were carried out with the UPV and Rebound hammer to assess the quality of the concrete.
In addition, the study assesses the use of different interpretation methods with regards to reliability and practical application. The results were interpreted in accordance to the European codes, Swedish codes and other interpretation methods. The difference of the results from the different interpretation methods are compared and evaluated for reliability and efficiency.
The test results confirmed that the concrete consisted of the same strength class. However, the results from the different interpretation methods are dissimilar. The reason for obtaining different results is because the methods depend on different methodologies. The study showed that some methods can sometimes overestimate the results and become unsafe for structural assessment. On the contrary, the other methods can yield lower but safer estimates. Moreover, the use of small number of cores is evaluated for various methods. The reasons are because in practice, the preference is to avoid large number of cores. As a result, it is
recommended to apply care and proper judgment in selection of the methods and
interpretation of the results. It is also recommended to consider the methods with respect to the aim of the investigation, their limitations and assumptions.
iii
Sammanfattning
Samtida befintliga konstruktioner blir äldre och de dimensionerade lasterna ökar med tiden. Ifatt med detta ändras även kraven för större laster. Därför bör regelbundna inspektioner och förbättringar genomföras. I vissa områden kan det även förekomma seismiska rörelser som i sin tur förorsakar skador på strukturer. Av bland annat dessa anledningar är det därför viktigt att bedöma bärförmågan för befintliga konstruktioner. Syftet med arbetet är att granska de metoder och tillvägagångssätt som finns för att kunna bedöma den karaktäristiska
tryckhållfastheten för betong i befintliga konstruktioner. Tryckhållfastheten är den styrande parametern för materialet under tillståndsbedömningar.
Huvudfokuset med arbetet är att bedöma den karaktäristiska tryckhållfastheten för befintliga konstruktioner som saknar information om nuvarande tryckhållfasthet. Till en början utfördes en noggrann litteraturstudie för alla applicerbara metoder. Därefter gjordes en undersökning och bedömning av för- och nackdelar med vardera metod. Syftet med dessa metoder är att kunna mäta den nuvarande tryckhållfastheten för befintliga konstruktioner.
Efter en ingående litteraturstudie, valdes de icke-destruktiva metoderna Ultrasonic pulse velocity och Schmidt Hammer. Dessa metoder applicerades senare på Skuru bron i syfte att utföra icke-destruktiva tester för att bedöma betongens kvalitet. Tidigare
konstruktionshandlingar samt provtagningsrapporter från Skurubron som byggdes år 1914, har legat till grund för detta arbete. Företaget COWI är ansvariga för Skurubron projektet och har tillhandahållit all information om bron.
Vidare, redovisar detta arbete olika beräkningssätt för samtliga metoder utifrån olika standarder och tolkningsmetoder. För varje tolkningsmetod har evalueringar och analyser utförts med avseende på tillförlitlighet och praktisk tillämpning. De redovisade
beräkningssätten har använts för att räkna fram resultat från destruktiva och icke-destruktiva tester. Resultaten tolkades i enlighet med europeiska koder, svenska koder och andra
tolkningsmetoder. Skillnaden mellan resultaten från samtliga tolkningsmetoder jämförs och utvärderas med hänsyn till tillförlitlighet och effektivitet.
Testresultaten från UPV och Schmidt Hammer bekräftade att betongen består av samma tryckhållfasthetsklass. Resultaten från de olika tolkningsmetoderna var dock olika.
Anledningen till att det blev olika resultat beror på att varje tolkningsmetod utgörs av sina egna metodiska procedurer. Resultaten visade även att vissa standarder kan övervärdera resultaten vilket kan resultera i fel bedömning av den karaktäristiska tryckhållfastheten. Å andra sidan, resulterade vissa tolkningsmetoder i lägre men säkrare uppskattning av tryckhållfastheten.
Utöver detta, utfördes det beräkningar på de destruktiva testerna utifrån olika
tolkningsmetoder. Beräkningarna baserades dels på att räkna på ett mindre antal kärnor. Skälet till detta är att man i praktiken vill undvika att borra ett stort antal kärnor. Resultaten visade att korrekt bedömning och försiktighet vid val av metod och tolkningsmetod behöver implementeras. Det rekommenderas även att överväga metoderna med hänsyn till
v
Acknowledgements
First and fore most we would like to convey our heartfelt thanks to our supervisor, Professor Raied Karoumi for the support and guidance during the writing of this thesis work.
We would like to recognize the invaluable assistance from KmK instruments in providing material and technical expertise during the conducting of tests.
We would also like to pay our gratitude to our supervisors: Anton Barraza Bergstrand from COWI and Dr. Filippo Sangiorgio, Project Manager Civil Infrastructures at AECOM Nordics, formerly specialist civil structures at COWI. It is whole-heartedly appreciated that your great advice and support for our study contributed to the success of this work.
Our special regards go to our families who have constantly being supportive and without their support and motivation, this thesis would not have been possible.
0
Table of Contents
1 Introduction ... 5
1.1 Research question and objectives ... 6
1.2 Scope of thesis and limitations ... 6
2 Literature study ... 9
2.1 Methods of testing of in-situ compressive strength ... 9
2.1.1 Non-destructive methods ... 9
2.1.2 Semi destructive methods ... 21
2.1.3 Destructive methods ... 45
2.1.4 Summary of advantages, disadvantages and limitations for all the methods ... 50
2.1.5 The influence of the factors that affect the readings. ... 53
2.2 Interpretation of results ... 54
2.2.1 EN 13791:2007 ... 54
2.2.2 EN 13791:2019 ... 56
2.2.3 Assessment of the EN 13791:2007 and EN 13791:2019 ... 59
2.2.4 TDOK 2013 0267... 63
2.2.5 The GCSC method ... 64
3 Methodology ... 73
3.1 Case study of Skuru bridge ... 73
3.1.1 Previous investigations ... 73
3.2 Planning and undertaking of tests ... 74
3.2.1 Planning and testing of destructive tests ... 74
3.2.2 Planning and testing of non-destructive tests ... 74
3.2.3 Statistical analysis procedures ... 76
3.3 Determination of test regions ... 77
3.4 Simulations of samples with varying number of cores ... 77
3.5 Estimation of in-situ concrete strength according to TDOK... 77
3.6 Estimation of in-situ concrete strength according to EN 13791:2007 ... 78
3.7 Estimation of in-situ concrete strength according to EN 13791:2019 ... 78
3.8 Estimation of in situ concrete strength according to the GCSC method ... 78
3.9 Estimation according to DIN 13791:2017 and Netherland study ... 79
4 Results ... 81
1
4.1.1 Ground penetration radar (GPR) scan test result ... 81
4.1.2 Rebound hammer test results ... 82
4.1.3 Ultrasonic pulse velocity test results ... 82
4.2 Results of destructive tests from previous investigations ... 83
4.3 Results of estimation of concrete strength ... 83
5 Discussion ... 91
5.1 Method of testing ... 91
5.2 Comparison of results ... 91
5.3 Recommendations ... 94
5.4 Possible future study ... 94
6 Conclusion ... 95
7 References ... 97
8 Appendices ... 100
8.1 Detail calculations of estimation of characteristic in situ compressive strength ... 100
8.1.1 Calculations according to TDOK ... 100
8.1.2 Calculations according to EN 13791:2007 ... 100
8.1.3 Calculations according to EN 13791:2019 ... 101
8.1.4 Calculations according to EN 13791:2007, Alternative 1 for Rebound Number ... 101
8.1.5 Calculations according to EN 13791:2007, Alternative 1 for UPV ... 102
8.1.6 Calculations according to EN 13791:2019 for correlation using Rebound hammer .. 104
8.1.7 Calculations according to EN 13791:2019 for correlation using UPV ... 105
8.1.8 Estimation of CSC according to the graphical method ... 106
8.1.9 Estimation of CSC according to Netherland method ... 107
8.2 UPV-results ... 108
8.3 Schmidt hammer results ... 110
8.4 Outlier tests ... 114
8.4.1 Schmidt hammer outlier test ... 114
8.4.2 UPV test results Grubb test ... 115
8.4.3 Core results Grubb test ... 116
8.5 Matlab codes used for creating combinations ... 116
8.6 Results of estimation of in-situ compressive strength for 3 cores of different methods ... 118
8.7 Relation between coefficient of variation with number of cores ... 118
8.8 Relation between coefficient of variation with number of cores for different methods ... 119
1
List of symbols and abbreviations
Abbreviations R – Rebound hammer Q – Q value
UPV – Ultrasonic pulse velocity CSC – Concrete strength class BO - Break off
GCSC - Graphical concrete strength class method NDT- Non-destructive test
Symbols
D - spring constant [kN/m]
Eforward - the energy before the impact [J] Ereflected - the energy following the impact [J] X0 - displacement triggering the impact [mm] xR - displacement after the impact [mm]
𝜌 - Density [kg/m3] λ - Wave length [mm] f – frequency [cycles/s]
PBo – BO force at the top [KN]
h- height of cylindrical core for break off test
M - Moment at the top of cylindrical core for break off test D - diamater of cylindrical core of the break off test
S - depth of Neutral axis of the cylindrical core of break test
σ - stress from the the pull-out load
τ – shear stress from the pull-out load D - bearing diameter of pull-out d - insert diameter of pull-out
2
fp - pull-out strength [MPa] F - pull-out force [N] A - surface area [mm2]
d1 - diameter of the head of pull-out insert [mm] d2 - inner diameter of bearing ring [mm]
h - distance from the pull-out insert head to the concrete surface [mm] fc - the compressive strength [MPa]
F - the maximum load at failure [N]
Ac - the cross-sectional area of the core on which the compressive force acts [mm2] fck,is – characteristic in-situ compressive strength [MPa]
fm(n),is – average in-situ compressive strength [MPa] k2 – 1,48 [-]
s – standard deviation of the samples [MPa] fis,lowest – lowest value of core strength [MPa] k – factor from Table 3 in EN13791:2007 [-]
fc,m(n),is - average in-situ compressive strength [MPa] kn – confidence number from EN 13791:2019 [-] fc,is,lowest - lowest value of core strength [MPa] M - value from Table 7 in EN 13791:2019 [MPa]
fc,m(m)is – average of strength values from correlation [MPa]
fc,is,reg – strength values corresponding to indirect tests from correlation [MPa] fc,is – in-situ core strength [MPa]
m – number of indirect tests in a test region [-] n – number of samples [-]
t0.05 – t-score for 95% confidence limit [%] sn – standrad deviation of n samples [MPa] R – spread limit [%]
3
fkk – characteristic compressive strength [MPa]
fck,inf,is,cyl -Lower characteristic in situ compressive strength of core results (5% fractile) [MPa]
fck,sup,is,cyl -Upper characteristic in situ compressive strength of core results (95% fractile) [MPa]
fcm-Average value concrete standard cylinder compressive strength at 28 days [MPa] fcm,is,cyl -Average in situ cylinder compressive strength of core test results [MPa]
fcm,is,cyl(to)-Average value of the in situ compressive strength of cylinder core results at the time to [MPa]
βcc(t-) - Coefficient which depends on t- [-] t- - Backward time propagation [s]
Cm - Most probable value for C [MPa] Csup - Upper bound for C [MPa] Cinf - Lower bound for C [MPa]
C - Strength class for concrete at the age of the core drilling test [MPa] Cd - Design value of C [MPa]
C70 - Set of CSCs for which is valid the probabilistic condition P(C [ C70) = 70% [MPa] C0 - Strength class for concrete at the age of 28 days [MPa]
C0,d - Design value of C0 [MPa] C0,inf - Lower bound for C0 [MPa] C0,m - Most probable value for C0 [MPa] C0,sup - Upper bound for C0 [MPa]
C0,R - C0 known from the original construction plans [MPa]
C0,70 - Set of CSCs for which is valid the probabilistic condition P(C0 [ C0,70) = 70% [MPa] fck,cube – In-situ cube characteristic compressive strength [MPa]
fcm,cube (Y) - Mean of the logarithm of in situ core test results [MPa]
𝑛- number of cores [-]
s(Y) - Standard deviation of the logarithm of in situ core test results [MPa] tn-1 - The value if t distribution for degree of freedom [-]
smin - represents minimum standard deviation recommended from the results of experiments [MPa]
4
k3 – factor from DIN 13791:2017 [-]
5
1 Introduction
The compressive strength in existing structures is the most important parameter required in appraisal of old structures (Alwash 2017). According to RILEM, the increase in structures showing signs of deterioration, has raised the interest in the area of testing the in-situ compressive strength to a great deal.
The design life of many bridges in the Europe is reached (Europa.eu 2019). For instance, 75% of the bridges owned by Trafikverket are 50 years old. Many of the bridges’ design loads were lower than today’s standard loads (Pantura project 2013). Further, the introduction of the high-speed railway requires the evaluation of the bridge’s capacity for increased
dynamic loads. Those factors are expected to increase the demand of assessing existing structures.
In this thesis the ‘existing’ structures refers to the condition where there is no prior knowledge about the compressive strength of the concrete.
The assessment of condition of existing structures can be performed for following reasons: 1) The evaluation of structural capacity of existing structures in order to plan for
different use or for complying with new standards. 2) The assessment of seismic damages
At the beginning of an investigation, the assessment of the characteristic compressive strength is performed with various methods of testing. The selection of those methods depends on the purpose of the testing and the required accuracy of the results. Therefore, the proper planning of the test methods can enable smooth execution of the investigation. The different methods of testing have different advantages, disadvantages and limitations. The factors that affect the results have to be considered during and after the execution of tests. The selection of appropriate methods of testing should be followed by interpretation methods that are practical and have reliable accuracy. The interpretation methods have different estimation procedures and requirements. Therefore, different interpretation methods produce different results.
Furthermore, the obtained interpretation results feature tradeoff between accuracy and
economy. In professional practice the preference is to use small number of cores to minimize cost and avoid damage. Hence, the choice of the application of the methods needs careful assessment of the required safety level of the estimate and the implication of the costs. The use of large number of cores is not practical for most of the cases. However, large number of cores are required to estimate the compressive strength using correlation. Additionally, the minimum number of cores required for estimation of characteristic
compressive strength according to the new EN 13791:2019 has practical limitations because of the large number of cores required. On the other hand, the reliability of the use of small cores is questionable for all methods because of reliability issues. In spite of this fact, according to RILEM much of the current practice relies on taking small number of cores. In this study the estimation of the characteristic in-situ compressive strength is assessed for the application of different interpretation methods. Furthermore, the scatter of small number of
6
cores for different cases of interpretation methods is evaluated. Sefrin and Weber studied the results of the different versions of EN 13791 and found out that the statistical methods used in some of the standards are not reliable.
In this study various testing and estimation methods are applied in a case study of Skuru bridge. The scatter of the estimation is presented and the methodological differences of the methods and their outcomes are analyzed. In addition, the effect of the small number of cores is evaluated for different methods by simulation studies combining the different cores to form different samples. We hope this limited thesis will help enhance the understanding about the discipline of assessment of existing structures significantly.
1.1 Research question and objectives
The aim of the thesis is to evaluate the different methods of testing and estimation of in-situ compressive strength of concrete in existing concrete structures. Various methods of testing are compared with respect to their advantages, disadvantages, and limitations. The scatter of the results of different methods of interpretation are analysed.
The research questions in the thesis are:
- How to determine the characteristic in-situ compressive strength of concrete in existing structures?
- Which methods of testing are efficient with respect to practicality? - Which interpretation methods are efficient with respect to practicality?
- How are the European codes, Swedish code, German code and Netherland study applied in practice?
- What are the differences between the test methods?
- What are the differences between the interpretation methods?
1.2 Scope of thesis and limitations
This thesis includes literature study, methodology, results, discussion, recommendations and conclusion. The scope of the thesis is to assess various test methods and approaches of estimation of the characteristic in-situ compressive strength of existing structures.
The study is based on previous investigations performed on the Skuru bridge. The methods of testing were opted based on the availability and accessibility. The methods adopted to
estimate the compressive strength are EN13791:2019, EN13791:2007, GCSC method, DIN EN 13791:2017 and a method based on a Netherland study.
The results obtained from each interpretation method are compared and presented. The thesis includes discussion on the methods, results and make valuable recommendations.
7 The following were limitations for this thesis study:
- Limitation of the instruments/equipment supply - Cost
- Accessibility
9
2 Literature study
2.1 Methods of testing of in-situ compressive strength
2.1.1
Non-destructive methods2.1.1.1 Rebound hammer
The surface hardness of concrete is one of the factors that indicates the quality of concrete. In 1930s, masses activated with energy were caused to hit concrete in order to assess the
concrete member’s compressive strength. The surface dents were counted as measurement of the strength of the concrete. Later, the measurement of the rebound distance of the masses were adopted as measurement of the strength (Bungey et al. 2006).
The rebound hammer method is developed by the Swiss engineer Ernst Schmidt in 1948. The method was developed in the Swiss federal material testing and experimental institute of Zurich (Malhorta & Carino 2004).
Schmidt hammers are categorized into N type and L type according to the intensity of energy of the impact to the concrete. The N types are suitable for high energy impact and for
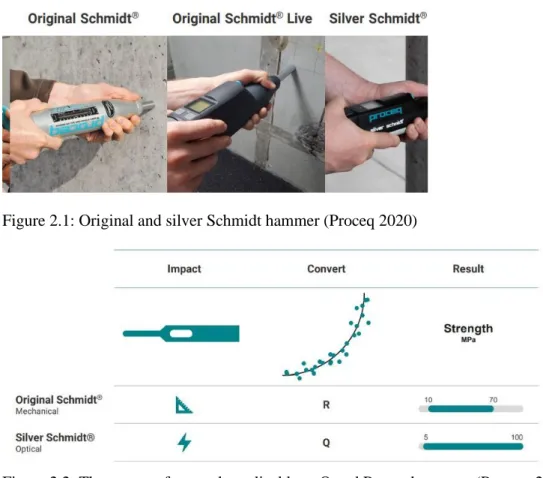
members with sizes greater than 100 mm thick. The L types are suitable for low impact energy and for brittle concrete for member sizes less than 100 mm thick (Proceq 2020). The other classification of Schmidt hammers concerns the way the surface hardness is measured. Accordingly, the hammers are classified into Original (R) or Silver (Q) types which are shown in Figure 2.1. The R-hammers measure the rebound distances and the Q hammers measure the velocities of the impact. Schmidt hammers that measure R-values are called original Schmidt hammers and those measuring Q-values are called silver Schmidt hammer.
The Q hammers have more accuracy and are applicable for wider compressive strength ranges (10-100 MPa) as shown in Figure 2.2. It is common that the Schmidt hammers in practice can be equipped with enhanced functionalities of electronic and software
capabilities. Today, it is common to find Schmidt hammers which can store the data and perform post-processing of the data (Proceq 2020).
10
Figure 2.1: Original and silver Schmidt hammer (Proceq 2020)
Figure 2.2: The ranges of strength applicable to Q and R type hammers (Proceq, 2020) 2.1.1.1.1 Principle and theory of method
The theoretical relationship between the rebound results and the compressive strength of concrete is difficult to justify. Hence, the accuracy relies on empirical correlations of the results with the actual strength of the crushed core samples (Bungey et al. 2006).
Schmidt hammers can weigh about 1.8 kg (Figure 2.1). The main components of a basic Schmidt hammer are a plunger, a hammer mass, a spring, a latching mechanism and a rebound scale. The latching mechanism locks the hammer mass to the plunger and the rebound scale registers the distance of the rebound of the hammer mass. The rebound scale ranges arbitrarily from 1-100. The measured value of the rebound scale is called the rebound number (Malhorta & Carino 2004). Modern Q-hammers have differential optical absolute velocity encoder, which measures the velocity accurately (RILEM 2012).
The rebound number is the output of the measurement of the Q and R types of Schmidt hammers. The theoretical computation of the rebound number is the percentage between the distance travel and the velocity of the mass before and after the impact. The following equation represents the theoretical relationship between the forward and rebound travel distances. Equation (2.1) depicts the calculation for the R-value hammer.
𝑅 = 100 ∗ √𝐸reflected 𝐸forward = 100 ∗ √ 1 2𝐷𝑥⁄ R2 1 2𝐷𝑥⁄ o2 = 100 ∗ 𝑥R 𝑥𝑜 (2.1)
Where D is a spring constant, 𝐸forward is the energy before the impact, 𝐸reflected is the energy following the impact, 𝑥o is the displacement triggering the impact and 𝑥R is the displacement after the impact.
11
For the Q hammers the Rebound number is the percentage of the forward velocity of the rebound. Equation (2.2) represents the computation of rebound number for Q types.
𝑄 = 100 ∗ √𝐸reflected 𝐸forward = 100 ∗ √ 1 2𝑚𝑣⁄ R2 1 2𝑚𝑣⁄ o2 = 100 ∗ 𝑣R 𝑣o (2.2)
Where the rebound value Q is expressed as a function of the respective kinetic energy before (𝐸forward) and after (𝐸reflected) the impact. The two quantities depend on the mass m of the
hammer and on the respective velocities immediately before (𝑣𝑜) and after (𝑣𝑅) the impact (Breysse 2012).
The R value is the measurement of the energy of impact without the loss of energy during impact. However, in reality R-values are affected by friction on the guide rod, friction of the drag pointer on the slider scale, the influence of gravity, and the relative velocities between the unit and mechanical parts. Therefore, R values need to be compensated for the factors that are affecting the result. However, the Q value measurement is not affected by those factors and correction is not needed for friction or the impact direction. (Denys Breysse, 2012). The Q-hammers can also automatically account for the carbonation depth though the calibration is still required (RILEM 2012).
2.1.1.1.2 Method of testing
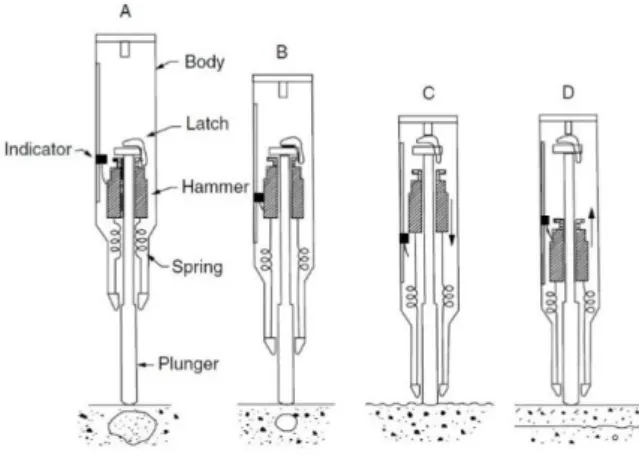
The test is performed by holding the hammer perpendicular to the surface of the concrete (A) (Figure 2.3). As the test starts, the body of the hammer is pushed towards the concrete (B). As the body is pushed towards the concrete surface, the mass of the hammer moves away from the concrete resulting in the stretching of the spring (C). When the limit of the upwards movement is reached the latch is automatically released. As the latch is released the energy stored in the spring propels the mass towards the concrete and produces impact with the surface. However, the hardness of the concrete surface makes the mass rebound and the sliding scale travels with the rebound and records the resulting distance (D) (Malhorta & Carino 2004).
Figure 2.3: Schematic cut view of Schmidt hammer showing the operational stages A,B,C and D (Malhorta & Carino 2004).
2.1.1.1.3 Factors affecting test results
The readings show significant variation because of the differences in the local conditions of the concrete such as: presence of cracks, voids and the type of aggregate at the surface.
12
Therefore, a number of readings should be performed and the average of the readings is considered as the measurement (Bungey et al. 2006).
The results of hardness tests can also be affected by the characteristics of the mix, the member and the direction of application of the impact. (Bungey et al. 2006).
Although the effect of cement content on Portland cement is negligible, differences in other cement types may be significant. Super-sulfated cement and high-alumina cement can result in 50% and 100% stronger correlation strength than Portland cement. For coarse aggregates the correlation of strength depends on the type and source of aggregate. Cement paste gives higher rebound number and there is difference in results between different types of
aggregates since their hardness varies. The results also differ for light weight and dense weight aggregates (Bungey et al. 2006).
The Figure 2.4 Shows the influence of aggregate on the results.
Figure 2.4: Influence of aggregate on the result (Bungey et al. 2006)
The effective mass of the member, slenderness, the boundary conditions and stress state affect results because of the vibration and movement that can be caused by the impact of the hammer. The test assumes full compaction since the performance of the test requires smooth and well-compacted surface. Troweled surfaces can result in overestimation of the results and the method is not suitable for open textured and exposed aggregate surfaces. The most
favorable surfaces are those formed by formworks and other surfaces may require grinding to get representative results (Bungey et al. 2006).
Carbonation effects are insignificant for young concrete. However, the carbonation increases with the age of the concrete and can be as high as 20 mm for old concrete. Carbonation results in overestimation of results of the correlation due to formation of hard carbonated skin. The hardness of the surface of concrete is higher when dry. Wet surfaces can result in lower strength of about 20%. The effect of moisture in wet conditions should be accounted for during tests. Temperature effects are insignificant in normal practice of hammer tests. However, the effects of extreme temperatures on the readings need particular attention. The EN 12504-2 limits the temperature to 10-35℃ (Bungey et al. 2006).
13
Figure 2.5: Influence of moisture content on the result (Bungey et al. 2006)
The direction of the impact on the concrete surface affects the test results. The most favorable condition is when the direction is horizontal. If the impact direction is up or down on horizontal surfaces or at inclined angles correction of the results for gravity are necessary (Breysse, 2012).
Figure 2.6: Influence of orientation of hammer on the result of original hammers
The presence of porous concrete hidden under the surface and very small cover of reinforcement can affect the result of rebound number (Brencich et al. 2020).
The use of hammer method should be accompanied by the consideration of the factors that account for the effects on the results. The use of hammer method should not be regarded as substitute of standard compression tests but rather a way of comparing different concrete samples and assessing the quality of concrete (Malhorta & Carino 2004).
2.1.1.1.4 Standards and correlations
The influences of the various variables mentioned in section 2.1.1.1.3 make it unlikely to adopt a general calibration curve. The calibration should be based on samples from the same type of concrete and under the same conditions of the concrete that is to be investigated. The number of factors that could affect the result makes the method least reliable for
determination of compressive strength. The accuracy of the results obtained depend on the elimination of the influence of the various factors which are usually disregarded during calibration (Bungey et al. 2006).
The calibration of the compressive strength need correction for orientation of the impact for R type of hammers as shown in Figure 2.6. The carbonation can increase the measured strength as much as 50% more than the actual strength. The best way to account for the
14
effects of carbonation is to correlate the results with the specimens from the specific concrete under test (RILEM 2012).
It is essential that the hammers are calibrated with standard anvil mass for the proper functioning. The calibration is necessary because the results can be changed due to wear of the mechanical parts (Bungey et al. 2006).
In existing structures, a properly calibrated device can give results with an accuracy of 30-40% of the in-place strength according to FHWA guide (FHWA 1997). According to Malhotra the results can have accuracy up to + 25% (RILEM 2012).
There are several standards and guidelines that provide guidance on the procedures of the application of the methods and interpretation of the results.
-ASTM C 805, A standard test method for rebound number of hardened concretes ,1994 -EN 12504-2, Testing concrete in structures-Part 2, Non-destructive testing-determination of rebound number,2001
- EN 13791, Assessment of in-situ compressive strength in structures and precast concrete, Brussels,2007
-ACI 228-1R-03, In place methods to estimate concrete strength, Report aby ACI committee, 2003
The requirements for number of readings vary among the various standards. EN 12504-2 recommends a minimum of nine readings taken over an area not exceeding 300 mm square, with minimum spacing of 25mm from each other or from an edge. ASTM C805 (59) requires that minimum of ten readings per location (Bungey et al. 2006).
2.1.1.1.5 Advantages and limitations
The method is widely used because of its simplicity, speed and low cost (RILEM 2012). The rebound number is sensitive to change in quality of concrete and inadequate mixing or segregation. That makes it a reliable and quick method for checking of uniformity of
concrete. It enables low-cost assessment of quality with smaller number of drilled cores. The tests results are more consistently reproducible than any other NDT method. The method is also suitable for determining the areas of poor concrete quality for optimizing the number of cores (Bungey et al. 2006). The method has a stronger connection with the mechanical properties than any other NDT technique (RILEM 2012).
The main disadvantage of the method is the poor reliability in estimation of compressive strength due to influence from various factors affecting the results as mentioned earlier. Moreover, the method only enables the assessment of the mechanical property near the concrete surface. The estimation of strength requires calibration with destructive tests. Even with calibration it is not reliable to depend only on this method (Bungey et al. 2006).
The method cannot be used on frozen concrete surfaces. Slenderness of the member can limit the applicability of the method. EN 12504-2 recommends that a member should be at least 100 mm and firmly fixed in the structure.
15 2.1.1.2 Ultrasonic pulse velocity
The interest of determining the properties of concrete without destructing the material, has been a universal desire (Malhorta & Carino 2004). The first two countries that developed the pulse velocity after World War II were England and Canada (Alwash 2017). During 1960s, the pulse velocity methods moved from being tested in laboratories to become used on site. Ever since this method was developed, various countries have begun to introduce and standardize this procedure (Malhorta & Carino 2004).
The ultrasonic pulse velocity (UPV) method is a non-destructive and acoustic method that is used for several purposes such as evaluation of concrete quality regarding its compaction, Young-Modulus and texture. Further on, this method is also used for evaluating the cracks, the compressive strength, and the characterization of the concrete (Helmerich et al. 2007). This technique is a stress wave propagation method that generate wave pulse velocities with an electro-acoustic transducer through the concrete (Alwash 2017). The transducers are placed on each side of the concrete to send ultrasonic waves from one side of the concrete to the other. The wave velocity is then calculated by measuring the duration of flow time for the waves to pass through the concrete (Karahan et al. 2020).
The UPV is a fast, easy and popular non-destructive method. The method is also considered to be successful for verifying the quality and strength of concrete in distinct parts of the structure component or in the structure itself (Ariöz et al. 2009).
2.1.1.2.1 Principal and theory
There are different types of mechanical wave propagations during the application of an impulse to a medium and large surface. These wave types consist of longitudinal waves also called compressional or P- waves, transverse waves, also called shear or S-waves and Rayleigh waves, also called surface or R-waves. These various waves have dissimilar velocities, the quickest waves are the compressional waves and the lowest waves are the surface waves (Alwash 2017; Malhorta & Carino 2004).
The P-waves spread through the robust medium in a way that is analogous to sound waves that distribute in the air. The velocities in concrete that belong to the shear and surface waves are approximately about 55 to 60 % respectively of the P-waves velocities. The density and elastic properties of the material determine the particular velocity of the wave. For a solid, isotropic, homogenous and elastic medium, the compressional wave velocity is calculated according to equation (2.3):
V = √𝐾𝐸𝜌 (km/s) where: (2.3) V= Compressional wave velocity
K = (1−𝑣)
(1+𝑣)(1−2𝑣)
v = Poisson’s ratio
E = Dynamic modulus of elasticity [N/mm2]
16 (Bungey et al. 2006; Malhorta & Carino 2004).
In the above formula, the K-value is comparatively insensitive to deviations of the Poisson’s ratio, hence the variation in ƿ (density) and E (Elastic modulus) give more substantial effect on the compressional wave velocity (V) (Bungey et al. 2006; Malhorta & Carino 2004). Additionally, the arrival time (t) of the compressional waves from the transmitting transducer to the receiving transducer (according to Figure 2.7) could be measured. Similarly, the distance between the transducers, path length (l), is measured and finally the UPV of longitudinal waves, Vp, is easily calculated according to equation (2.4):
Vp = 𝐿
𝑡 (2.4)
(Abbas Alwash 2017).
Figure 2.7: Schematic diagram of UPV (Alwash 2017).
Finally, the velocity of the propagating wave motion is related to the wavelength λ and the frequency f: V = λf. The wavelength l, is ascribed as a distance e.g., mm and the frequency f, is ascribed as hertz or cycles/s. An increase in the wave frequency results in a decrease for the wavelength and contrariwise. For the concrete material the higher limit of compatible
frequency is approximately 500 kHz with a measured wavelength of 10 mm. These numbers are in the range of the coarse aggregate particles for concrete. A frequency of 20 kHz can traverse 10 m, meaning that larger pathlengths can be crossed with lower frequencies (Malhorta & Carino 2004).
To run the UPV test, the equipment comes with one transducer, one receptor, pulse generator, an electronic timing device and an amplifier. The soundwaves go from the transmitter to the receptor and the electronic timing device measure the time interval passing between the transducers (Branco & Brito 2004; EN 12504-4:2004). Figure 2.8 presents the development of transducers that has been taking place during decades
For the test running on concrete, transducers with frequency ranges from 25 to 100 kHz are being used. Different resonant frequencies are applied to different sizes and different
properties of the concrete specimens. For small sized specimen, high-strength concrete and short path lengths, high frequency transducers (higher than 100 Hz) are required. For large
17
specimens, concrete with large size aggregates and longer paths, low frequencies are used (lower than 25 Hz) (Malhorta & Carino 2004).
Figure 2.8: Development of transducers (Proceq)
2.1.1.2.2 Method of testing
The basic concept behind the method is to measure the time required for the sound waves to go from one side of the concrete to the other (Branco & Brito 2004). During the time the sound waves travel through the concrete and reach the receptor, it transforms into a convoluted waveform that includes reflected shear waves or compressional waves. The compressional waves are the fastest, therefore they arrive first at the receptor (Malhorta & Carino 2004).
During the testing, it is essential to ensure complete connection between the concrete surface and the transducers. A thin layer of connection medium is applied to the concrete surface to make sure perfect coupling between the concrete and transducers. Afterwards, the transducer and receptor are pressed against the surface of the concrete to finally record the transit time of the soundwaves. The transit time reading is repeatedly recorded to avoid errors. Finally, the distance between the transducers is measured in order to calculate the ultrasonic pulse velocity (Alwash 2017).
The arrangement of the transducers can be accomplished in three different configurations (EN 12504-4:2004):
- The transducers are placed on opposite sides of the concrete surface, called direct transmission, see Figure 2.9.
- The transducers are placed between adjacent surfaces, called semi-direct transmission, see Figure 2.10.
- The transducers are placed on a single surface, called indirect or surface transmission, see Figure 2.11 (RILEM 2012).
The difficulty with the first configuration is the access to the opposite surfaces of the concrete, but still, this method is the most accurate one and should be chosen. The second configuration, semi-direct transmission, is effortless to use but the challenge here is to define
18
the distance between the transducers. The direct transmission technique is a more accurate choice than the semi-direct. At last, the indirect technique is easily applied for in-situ configuration since the accessibility to one face is facile, but this technique is less accurate (RILEM 2012).
Figure 2.9: Direct transmission Figure 2.10: Semi direct transmission Figure 2.11: Indirect (Malhorta & Carino 2004). (Malhorta & Carino 2004). (Malhorta & Carino 2004). 2.1.1.2.3 Factors affecting test results
There are factors that affect the UPV test result and therefore it is important to make sure that the pulse velocity readings are reproducible (Malhorta & Carino 2004). Further on, the factors that affect the testing are the aggregate, water cement ratio, cement type, the coupling between the concrete and transducers and the presence of reinforcement.
The aggregate content affects the relationship between the compressive strength of concrete and pulse velocity, meaning that a high aggregate substance results in high pulse velocity. The water content results in lower compressive strength of concrete and at the same time increases the pulse velocity. Additionally, the cement type and the age of the concrete could impact the compressive strength and the pulse velocity too. All these factors generate ambiguity in the interpretation of the UPV results (Trtnik et al. 2008).
As mentioned earlier, there should be enough coupling between the concrete and transducer. That is necessary to prevent formation of air pockets that may occur and cause errors in the results. Furthermore, that is something vital to deliberate since only a minor amount of energy is enough to disturb the results. To eliminate these air pockets and guarantee proper contact between the surface and the transducers, a thin layer of petroleum jelly could be used, which has also been confirmed to be a great coupling (Bungey et al. 2006).
In order to reduce the measurement uncertainty, the test is replicated at different positions in a small area where the test is performed (Alwash 2017). The transit time should be repeated until a minimum value is achieved (EN 12504-4:2004).
This technique necessitates accurate measurement with the instrument being used, because the transit time that is measured is very short. The UPV technique is based on the
measurement of sound waves, therefore any interfering wave can disturb the measurement. Therefore, adequate care is needed to realize accurate readings (Malhorta & Carino 2004). In addition, the location of the reinforcement affects the duration of the waves. In places where the reinforcement is placed, the duration upsurges noticeably. Further, there are difficulties that arise when this method is being used on an existing bridge structure due to
19
the location of the load-bearing elements. Semi direct transmission or indirect transmission are performed when it is impossible to conduct direct transmissions. This will thus increase the wave flow and consequently decrease the velocity of the wave propagation (Karahan et al. 2020). It is therefore better to perform the test readings in areas where the reinforcement is not located, or else correction factors must be applied (Malhorta & Carino 2004).
2.1.1.2.3 Standards & Correlations
The European and American standards do not specifically mention how many readings should be performed, rather it declares that enough readings should be completed in order to obtain the minimum value of the transit time. The American standard (ASTM C597, 2002) indicates that the indirect transmission should be avoided due to the uncertainty of the measured path lengths and that the calculated velocity is affected by the surface layer of the concrete.
The properties of concrete that influence the pulse velocity are the density and elastic modulus. These properties are in turn related to water cement ratio, age of concrete and type of aggregate. The strength of concrete is most affected by the water cement ratio and it affects the strength more than the type of aggregate. Thus, correlation of the strength of the concrete to the pulse velocity should be performed for a specific concrete mix. So, to assess the strength of the concrete using the pulse velocity for unknown concrete is not reliable (EN 12504-4:2004). Correlations with regard to different w/c ratios are illustrated in Figure 2.13 and correlations to different aggregate types are illustrated in Figure 2.14.
The correlation is done by performing the UPV tests at the same location of the drilled cores in order to obtain a data set of pairs of results (EN 12504-4:2004). An example of correlation between velocity and cylinder compressive strength is illustrated in Figure 2.12.
It is worth mentioning that some concrete bridges have w/c ratios beyond the ranges
illustrated in Figure 2.13 and this would result in a more complex situation. It would then be better to apply another method for assessing the strength of the concrete (Sangiorgio 2021). From a statistical point of view, the 95% confidence limit for the compressive strength is around + 20 % of the mean value performed on one test (Bungey et al. 2006). Moreover, according to Bungey et al. 2006, the reliability of the absolute strength correlation is poor and this test method should be combined with other methods for evaluating the compressive strength of the concrete.
At last, one must consider the path lengths and aggregate sizes to perform the UPV test. There are two limitations that are deemed necessary:
Path length of 100 mm for concrete having maximum aggregate size of 30 mm 150 mm for concrete having maximum aggregate size of 45 m (Bungey et al. 2006).
20
Figure 2.12: Correlation of pulse velocity and compressive strength (Malhorta & Carino 2004).
Figure 2.13: Correlation to different w/c ratios (Malhorta & Carino 2004).
Figure 2.14: Correlation to different cement type- fine and coarse aggregate type (Malhorta & Carino 2004).
2.1.1.2.3 Advantages & limitations
The main advantages with UPV are the ease of application, non-destructiveness and low operational costs. The limitations of the method are the reliability of the correlation,
accessibility to two opposite surfaces and temperature variations that must be considered. The temperature variations between 5 and 30°C have insignificant effect on the readings, but
21
temperatures outside this range need to be considered in calculations using correction factors. Additionally, the absolute strength of correlation to the drilled cores is poor (Bungey et al. 2006; Alwash 2017)
2.1.2
Semi destructive methods 2.1.2.1 Penetration resistance methodPenetration resistance test is a type of surface hardness test; however, more depth of the concrete is assessed than the rebound hammer method. In the professional practice, the tests are known by the manufacturer name called Windsor. The methods cause localized failure which does not affect the structural strength of the member. There are two types of tests namely, probe penetration test and pin penetration test. The correlation to compressive strength is not affected by many factors as rebound hammer and ultrasonic pulse velocity tests. The advantages of this method are that the results can be immediately available and the test is less damaging and disruptive (Bungey et al. 2006).
Steel probes are utilized in the probe penetration test while steel pins are used in the pin penetration test. The steel probes are driven with high energy actuated by powder and the probe penetration depth is affected by the concrete strength and type of aggregate. However, steel pins are driven by low energy actuated by spring and the intention of the test is to only assess the mortar. If the aggregate is encountered, the result should be disregarded (Malhorta & Carino 2004).
Like other surface hardness methods, penetration test results indicate the relative strength of concrete in a structure. The determination of absolute strengths is possible only by correlation with actual strength of the same concrete determined by destructive tests (Malhorta & Carino 2004).
2.1.2.1.1 Windsor probe test
The use of penetration resistance tests became well established after the development of a device called the Windsor probe. The device was developed during 1964-1966 jointly between Port of New York authority and the Windsor machineries co. in USA. The aim of the development was to measure the compressive strength by the depth of penetration of probes by powder actuated drivers (Malhorta & Carino 2004).
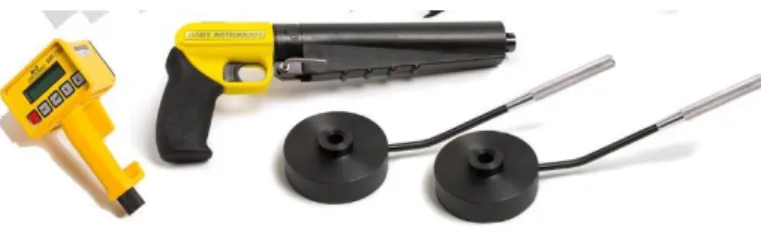
The Windsor probe test measures the surface hardness of the concrete and the result relates not only to the compressive strength in the localized area but also the sub surface strength of the concrete. The method is used for the estimation of concrete strength and quality by measuring the depth of penetration of the probe driven in to concrete by a powder actuated driver (Malhorta & Carino 2004).
22
Figure 2.15: Windsor probe test kit (James instruments 2020)
2.1.2.1.1.1 Principle and theory of the method
The penetration of the probe subjects the concrete to complex dynamic compressive, tensile and shear stresses. This makes the theoretical explanation of the relation of mechanical properties with the stresses very difficult. As per the suggestion by Windsor equipment manufacturers, a subsurface compression bulb is responsible for resistance of penetration. The surface becomes crushed by the tip of the probe and the shockwaves cause spalling during penetration. Hence the kinetic energy is absorbed by crushing at the tip, by the friction along the probe and the compression of the concrete in the bulb.(Bungey et al. 2006).
However, it is suggested that the energy that is dissipated by the compression of the concrete in the bulb has a higher percentage of the energy before impact compared to that which is lost due to friction and crushing. Figure 2.16 illustrates the compression bulb formed during the test. Although it is not proven, the claim is consistent with the reasonable assumption that the result of the measurement relates to the property of the sub-surface concrete rather than the surface concrete (Bungey et al. 2006).
The range of strength that can be measured by the probe penetration test is reported to be 40-80 MPa (Bungey et al. 2006). It was also found from experimental tests that the probes can break or bend if the strength is more than 80 MPa (Pascal 2000). However, the manufacturers claim the range of use as 10-110 MPa for the silver type of probes, which are utilized for high strength concrete (James instruments manual).
Figure 2.16: Compression bulb (Bungey et al. 2006)
2.1.2.1.1.2 Method of testing
The parts that constitute Windsor probe are a powder-actuated gun or driver, hardened alloy-steel probes, loaded cartridges and a gauge which measures the depth of penetration of
23
probes. Figure 2.15 shows the test kit of a probe penetration test. The probe tips (Figure
2.17) have different diameters for use with light concrete or normal concrete. The probe is
driven by the firing of the powder charge which propels the probe with an energy of 79.5 m-kg. The amount of powder is adjusted as per the strength of the concrete (Malhorta & Carino 2004).
The procedure of the application of Windsor probe is simple. The surface that receives the probe must be smooth. If the surface is coarse, it should be grinded to smooth texture. The actuator is prepared according to the manufacturers guidelines and the test is performed according to relevant standards. The probe is driven through the holes of the locator plates that are placed on the concrete surface. After the probe’s penetration is complete, the area is cleaned of debris and another plate is placed on the surface of concrete as shown in Figure
2.18. The measurement of the exposed length of the probe, commences by placing the
calibrated measurement guage beside the probe. The measuring guage can be manual or electronic depending on the type of the equipment (Malhorta & Carino 2004).
Figure 2.17: Penetration resistant probe Figure 2.18: Measuring height (Bungey et.al. 2006) (Bungey et.al. 2006)
There are two power settings which are related to two types of probes. The low power setting is used with gold type of probe that is applicable to light weight concrete with strength up to 19 MPa. Similarly, the silver probes can test high strength concrete up to 110 MPa (James instrument Windsor probe manual).
2.1.2.1.1.3 Factors affecting test results
The hardness of aggregate is an important factor that affects the results of the test. Therefore, the hardness of the aggregate is used as an important factor for calibration of the results which the manufacturers commonly include in the equipment manuals. However, the type of aggregate also affects the results significantly. It is observed that crushed aggregates result in higher strength than rounded aggregates. The difference in strength of bond at
aggregate-24
matrix surfaces can affect the depth of penetration. Moisture content, aggregate size (up to 50mm) and aggregate proportion have smaller effect than aggregate type and hardness.
Figure 2.19 illustrates the effect of aggregate type on probe results. The results should be
calibrated with the same aggregate type of the concrete under the test (Bungey et al. 2006). Carbonation can change the mechanical characteristics of the concrete to a certain depth and consequently the probe results may get affected. It is observed that the strength results from probe tests become overestimated for old concrete. That may be due to the microcracking between the cement paste and the aggregate. Moreover, the stress history of concrete can result in overestimation of the strength because of the cracking from the service loading. In both cases, the higher strength result occurs as a result of the effect from the
above-mentioned phenomena on the compressive strength tests. Yet, the effects result in negligible probe results (Malhorta & Carino 2004).
Surface conditions such as texture and moisture content do not affect the results. However, hard surfaces can give non-representative low penetration values (ACI commite 228 report).
Figure 2.19: Influence of aggregate type (Bungey et.al. 2006)
2.1.2.1.1.4 Standards and correlations
The development of the correlation between the penetration and strength is difficult because of the two power levels. This makes it necessary to prepare separate calibration curves for the two power levels (Bungey et al. 2006).
Manufacturers provide correlation curves for estimating the compressive strength, however those curves are not reliable. It is necessary to correlate the results of the test with the type of concrete being investigated (Malhorta & Carino 2004).
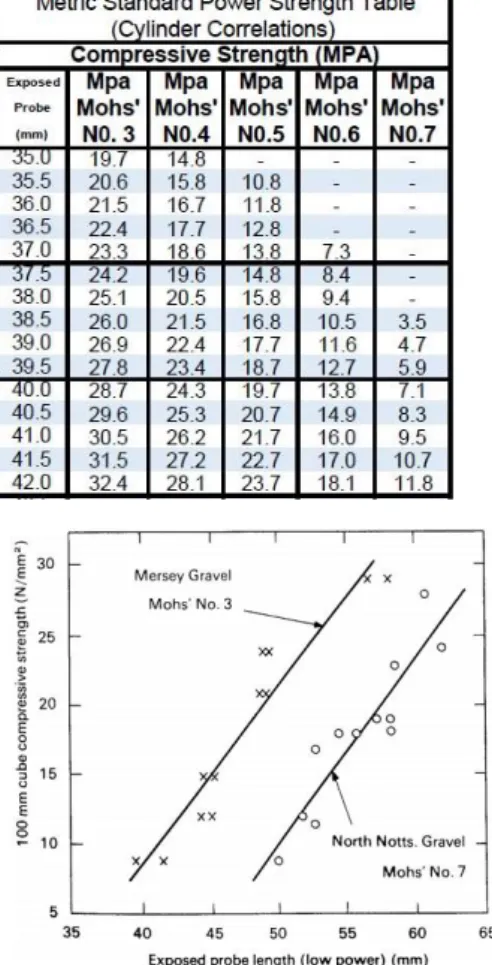
A calibration of strength from the manufacturer can be presented in table forms for low and high-power tests as illustrated in Table 2.1 or as graphs shown in Figure 2.20. The tables further indicate the strength for different Mohr’s hardness of aggregates (James instruments 2020).
The standards that cover the test include:
-ASTM C803/C803M- The standard initially was issued in 1982 and later the part regarding pin penetration test was added in 1990
25
-BS 1881-207- The BS standard states that 3 readings are required at a location. The 95% confidence limits are +20% .
Table 2.1: The strength for different Mohr’s hardness of aggregates.
Figure 2.20: Typical calibration for low power range (Bungey et.al 2006)
2.1.2.1.1.5 Advantages and limitations
The test has high combined rating with respect to reliability, simplicity and economy and its correlation is affected by small number of variables (Malhorta & Carino 2004). Further, the test is not affected by operator skills. The variability indicated is a COV of about 5% and a coefficient of correlation of 0.98 for a single set of three tests (Bungey et al. 2006).
However, the test causes minor surface damage which may require patching. Although the method has many inbuilt safety measures, the operation of the equipment requires wearing of safety protection (Malhorta & Carino 2004).
The method gives more direct assessment of concrete at larger depth than rebound hammer. In addition, the results are comparable to accuracy of small dimeter cores and could be used as an option to coring (Buney et al. 2006).
The application of the method has limitations of minimum edge distance to avoid cracking of concrete. The test should satisfy the requirements of minimum distance between the probe locations and the minimum size of the structural members. The distance of the reinforcement especially less than 100 mm could have effect on the depth of penetration (Malhorta &
26 Carino 2004).
As mentioned earlier, the method can indicate the strength at larger depths of concrete, however the limitations of edge distances means that the method cannot be used as
replacement of rebound method unless the results from rebound are unsatisfactory (Bungey et al. 2006).
2.1.2.1.2 Pin penetration method
The method was studied by Nasser and Al-Manaseer in the 1980s for determination of removal of formwork. This method is standardized in ASTM C803 in 1990 as an addition to the standard released in 1982.
The kinetic energy that drives the pin probe is 1.3% of the energy that powers Windsor probe. The low energy released cannot break aggregates and therefore the test can only measure strength of the mortar in the concrete. The test also is not sensitive for compressive strength above 28 MPa which limits its use for such ranges of strength (ACI committee 228 report).
2.1.2.1.2.1 Method of testing
The apparatus of the testing equipment consists of a pin within the shaft of the body of the tester as illustrated in Figure 2.22. The pin is held against a spring that is compressed during test preparation. As the spring is released on commencement of the test, the pin is driven in to concrete. Figure 2.21 depicts a pin penetration test. The penetration of the pin into the
concrete is related to the strength that the concrete has attained (Malhorta & Carino 2004).
27
Figure 2.22: Schematic diagram of pin penetration testing apparatus (Malhorta & Carino 2004)
2.1.2.1.2.2 Standards and correlations
The method gives good accuracy of correlation for lightweight concrete between 3.1-24 MPa. The test is considered as the only test that does not require correlation for lightweight
concrete (Bungey et al. 2006). Figure 2.23 presents an example of correlation between pin penetration depth and compressive strength.
Figure 2.23: Correlation of pin penetration with compressive strength (Malhorta & Carino 2004).
2.1.2.1.2.3 Advantages and limitations
The method has advantages of speed, simplicity, low cost and low damage. The depth of penetration is unlikely to be larger than 8 mm, hence it is not affected by reinforcement depth. The limitations of the method are the applicable strength range, the type of aggregate and mix type. There is no known effect of temperature. However, carbonation poses
difficulty in strength determination as shown by variability of COV of 18% in carbonated or old concretes (Bungey et al. 2006).
28 2.1.2.2 Break off method (BO)
The break off test was developed in Norway in 1976 by Johansen. Johansen’s research indicated the method as a way of testing the in-place strength for form removal. In 1977 researchers at NTH and the Research group for cement and concrete in Norway developed and patented the method. (Malhorta & Carino 2004)
In 1984, Darl-Jorgegsen and Johansen reported that the results from BO test can detect variability in curing better than the pullout method. In 1979, Johannsen published a paper on the use of BO method on asphalt pavements made of vacuum concrete. The report concludes that the results of BO tests are comparable to that of flexure beam test.
In the same year, Carlsson studied the BO methods use in the field and concluded that the method had gained acceptance in the field work. In addition, Naik recommended the drilled core method as the preferable method (Malhorta & Carino 2004).
The Figure 2.24 shows a test kit of Break off test.
Figure 2.24: Break off testing apparatus (James instruments) 2.1.2.2.1 Method of testing
The BO tester set comprises of the load cell, a manometer and a manual hydraulic pump. The load cell can be adjusted for high and low strength concrete. There are two different types of tests depending on the preparation of the cylindrical core. In the first type of the test a sleeve is inserted into fresh concrete to form the cylindrical core. Whereas for the other type of test, a cylindrical core is drilled. The testing apparatus is illustrated in Figure 2.25. The sleeve should be inserted by twisting and rocking action at spacing of 150mm. After the necessary depth is reached, the BO specimen should be tapped at the sides and at the top to ensure that the compaction and the localized conditions are not affected. In the case of the sleeves, the concrete bleeding is a problem (Malhorta & Carino 2004).
During the test the sleeve is removed except the sleeve ring and the debris is cleaned from the cylindrical slit and groove. The load cell is placed in the groove and the load is applied slowly until the specimen is broken off. The manometer reading can be correlated with the compressive strength of the cores from the concrete under investigation (Malhorta & Carino 2004).
In the case of drilled core tests, the concrete surface should be smooth enough to fix the vacuum plate of the drilling machine. The drilling core barrel should be maintained vertically
29
during drilling until a depth of 70 mm is reached. A groove is provided at the top for placing the load cell (Malhorta & Carino 2004).
Figure 2.25: BO test apparatus 2.1.2.2.2 Principle and theory
The break off method is dependent on breaking of the cylinder core parallel to the surface. The cylindrical core is subjected to a force at the top of the cylinder which creates a cantilever moment at the bottom since it is free at top. The moment creates a stress that increases from the top to the bottom. The maximum stress is situated at the extreme fiber at the base of the cylinder. The stress at the extreme fiber of the bottom of the cylinder core is computed theoretically according to equation (2.5):
𝑓𝐵𝑂 = 𝑀 𝑆⁄ where: (2.5) where:
𝑀 = 𝑃𝐵𝑂∗ ℎ
𝑃𝐵𝑂 = BO force at the top
ℎ = 65.3 mm 𝑆 =(𝑑)⁄32 𝑑 = 55mm
BO method is the only method that directly measures the flexural tensile strength. Pull out method is another similar method that measures the tensile strength directly (Malhorta & Carino 2004).
30
2.1.2.2.3 Factors affecting test results
Barker and Ramirez reported a variation of 6,1% and 7,6% for sleeve and drilled core tests with respect to changes in water cement ratio, aggregate shape and size. Moreover, Carlsson and Naik have reported that crushed aggregate gives 10% higher strength than coarse
aggregate (Bungey et al. 2006). On the contrary, BO reading is not affected by temperature, surface conditions and shrinkage (Malhorta & Carino 2004).
In 1987 Naik studied the effects of the tests made with sleeve and drilled core for high strength concrete. Accordingly, the results from the drilled core test were 9% higher than those from the sleeve test (Malhorta & Carino 2004).
2.1.2.2.4 Standards and correlation
A study showed that both methods of tests depicted good correlation with compressive strength and the results of the BO readings showed uniformity. Even though both methods showed acceptable correlation, Naik recommended the drilled core method as the preferable one (Malhorta & Carino 2004).
Furthermore, the calibration of BO readings with respect to core compressive strength should be prepared for the specific type of concrete. The Figure 2.26 depicts an example of
correlation curve of BO test. The manufacturers calibration curve does not reflect adequately the inherent properties of the concrete (Malhorta & Carino 2004).
The method was standardized in Sweden, Norway and Britain in 1982. The ASTM standard was withdrawn in 1992. Currently, the BS 1881 part 207 applies to standard procedures of application of the test (Malhorta & Carino 2004).
Figure 2.26: Correlation of BO manometer reading with compressive strength (Malhorta & Carino 2004).
31
2.1.2.2.5 Advantages and limitations
The peculiar feature of the BO test apart from other NDT tests is that it measures flexure strength directly. The method does not require pre-planning of test and requires only one exposed surface. The results have good correlation with compressive strength, acceptable accuracy and reproducibility of results (Malhorta & Carino 2004).
In addition, the method is quick, uncomplicated and the results are not affected by surface conditions, local shrinkage and temperature (Bungey et al. 2006).
However, the method may cause damage to the surface. The method is also limited by
maximum aggregate size of 19 mm and a structural member with a minimum size of 100 mm (Malhorta & Carino 2004).
2.1.2.3 Internal fracture test
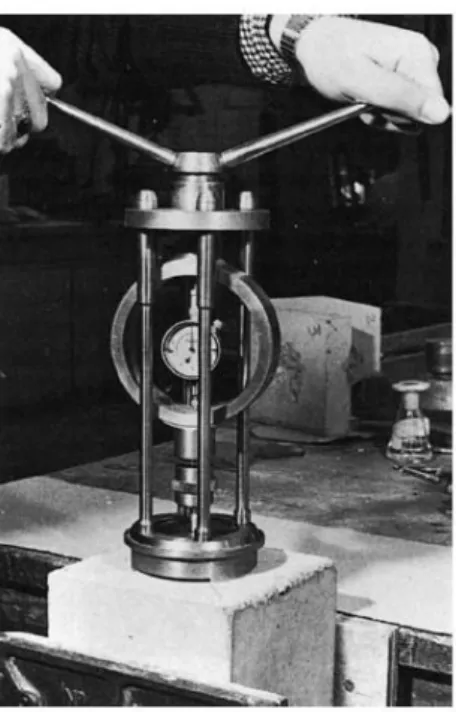
The test is developed by Chabowski and Bryden smith who were working with building research international in 1997. They were using the method to estimate residual strength of high alumina cement which became extended to Portland cement. Later the authors suggested an alternative method of loading, called pull force loading method to improve the accuracy of the results of torquemeter method of loading. The Figure 2.27 illustrates a test apparatus of internal fracture test. These methods can offer a reliable means of testing when specially the concrete mix is unknown (Bungey et al. 2006).
Figure 2.27: Internal fracture test apparatus (James instruments)
2.1.2.3.1 Method of testing
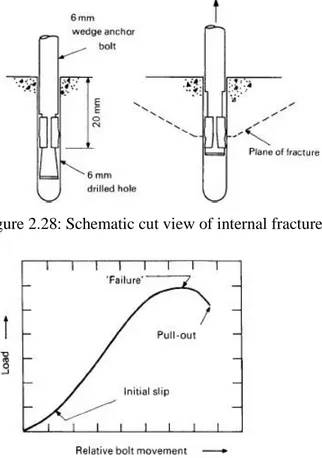
At the start of the test, a hole is driven into the concrete with a depth of 35-40 mm and a width of about 6 mm. The hole is cleaned of dust and a wedge anchor bolt with 6 mm diameter and with expandable sleeve is inserted until it reaches 20 mm below the surface. First an initial load is applied to expand the sleeve, then the load is increasingly applied until the concrete fails by cracking. The peak of the graph that shows the relation of the load versus the bolt movement is taken as the failure load as shown in Figure 2.29 (Bungey et al. 2006).
32
There are two methods for applying the load. In one of the methods the load is applied as torque by a torquemeter. In the case of the other method called pull force method, the load is applied as axial force by pulling. The result depends on the load application method. Further, the rate and the way the loads are applied affect the result (Bungey et al. 2006).
When the load is applied by torquemeter there is some twisting action that affects the results causing variability and decrease the failure load. The torquemeter is also insensitive during measurement and requires settling pauses in midst of test. Therefore, the authors developed the pull force method that is free of twisting action as shown in Figure 2.30 (Bungey et al. 2006).
Figure 2.28: Schematic cut view of internal fracture test (Bungey et al. 2006).
33
Figure 2.30: Pull force testing apparatus (Bungey et al. 2006)
2.1.2.3.2 Principle and theory of the method
During the test, failure occurs by cracking after the failure load is reached. The average observed failure length is 17 mm and 78 degree of half angle which is greater than the angle of the probable friction of concrete of 37 degree. That is because the failure consists of sliding and separation (Bungey et al. 2006).
2.1.2.3.3 Factors affecting the results
The test has high variability due to the localized nature of the test, the imprecise load transfer mechanism and the method of drilling (Bungey et al. 2006).
The size and type of aggregates affects the results to a large extent. The torquemeter force decreases for natural aggregates and there is difference in result with type of aggregate for torquemeter method. However, the direct pull force method gives closely related results for different aggregates. Figure 2.31 illustrates the difference in the correlation curves of the two loading methods. (Bungey et al. 2006).