J
Ö N K Ö P I N GI
N T E R N A T I O N A LB
U S I N E S SS
C H O O LJÖNKÖPING UNIVERSITY
D e t e r m i n a n t s o f E n t r e p r e n e u r s h i p
A C r o s s C o u n t r y A n a l y s i s o f F i r m F o r m a t i o n
Bachelor Thesis within Economics Author: Andreas Kroksgård
Tutor: Professor Charlie Karlsson PhD Candidate Mikaela Backman
Bachelor Thesis in Economics
Title: Determinants of Entrepreneurship - A Cross Country Analysis of
Firm Formation
Author: Andreas Kroksgård
Tutors: Professor Charlie Karlsson and Ph.D. Candidate Mikaela Backman
Date: February 2008
Subject terms: Entrepreneurship, Firm formation, Cross country analysis
JEL Codes: L26, M13, L51
---
Abstract
Economic theory suggests that numerous factors are affecting entrepreneurship (demographic, political, cultural, geographical, and economical). There has been a lot of research on this topic, and many factors have been identified as individually related to the level of entrepreneurship in a region or country. However, despite the fact that a large number of factors have been identified as individually related to new firm formation (NFF), no one has been able to give a definitive an-swer as to which factors are the most important for increased NFF and economic growth (Calido-ni et al. 2007). And differences across countries remain unexplored. (Freytag & Thurik 2007). This study takes a stab at both of these largely unexplored areas; trying to ascertain which vari-ables, out of 22 selected, appear to be the most relevant determinants of firm formation across countries today. Data on firm formation across countries from the WB‟s Entrepreneurship Survey was used to construct three measure of entrepreneurship. Stepwise regression was used to esti-mate the most significant variables. Three different measures of “entrepreneurship”, three mod-els, all yielded four significant variables in multivariate regression, some were overlapping be-tween the models for a total of eight variables found especially significant. One finding is particu-larly interesting in relation to Sweden; The cost of enforcing contracts was found to be one of the most important determinants of NFF, and since Sweden has relatively high costs of enforcing contracts; the combination of these two observation leads to a policy suggestion: If Sweden wants to increase NFF it should decrease the costs of enforcing contracts.
Table of Contents
1
Introduction ... 4
1.1 Outline of the thesis ... 6
2
Theory connecting NFF and economic growth ... 7
2.1 The neoclassical school ... 7
2.2 The evolutionary school ... 7
3
The determinants of NFF: theoretical framework ... 8
3.1 Institutions and entrepreneurship ... 9
4
Data: sources and variables ... 11
4.1 Entrepreneurship between countries ... 13
5
Statistical Method ... 15
5.2 Expected results ... 17
6
Empirical results and analysis ... 18
6.1 General findings ... 19
6.2 Cost of enforcing contracts and the case of Sweden ... 23
7
Conclusions and suggestions to further studies... 24
8
References ... 26
Figures, Tables, Equations, and Appendices
Figures Figure 1 Framework for the determinants of Entrepreneurship………... 6Figure 2 Average Entrepreneurship levels 2003-2005………..………… 12
Tables Table 1 Variables under analysis……… 9
Table 2 Pairwise correlation matrix……… 17
Table 3 Fixed effects model estimation results………....18
Table 4 Relative cost to “enforce contracts” in selected countries 2007……….. 22
Equations Equation 1 Model used for multivariate regression………. 15
Equation 2 Model used for simple regression……….. 15
Appendices
Appendix A Descriptive statistics………. I Appendix B Descriptive statistics………. IV Appendix C Stepwise regression estimations for the three models,
including tests for heteroskedasticity and collinearity………..………... II Appendix D Simple regression estimations………..………...VIII Appendix E Data removed/edited………..……….. IX
1
Introduction
What variables are jointly the best determinants of entrepreneurship? That is what will be analyzed in this
thesis. The purpose is to analyze a total of 22 macroeconomic, political, and institutional variables to see which ones that are the best determinants of entrepreneurship across countries.
In order to avoid confusion regarding the interpretation of the word “entrepreneurship” it will for the duration of thesis be defined, unless otherwise stated, as:
The activities of an individual or a group aimed at initiating economic activities in the formal sector under a le-gal form of business. Note that this definition excludes informal sector initiatives.
The definition1 of the unit of measurement of entrepreneurship must also be specified:
Any economic unit of the formal sector incorporated as a legal entity and registered in a public registry, which is
capable, in its own right, of incurring liabilities and of engaging in economic activities and transactions with other entities. In other words, the firm will our measurement of entrepreneurship.
Entrepreneurship will be measured by three different ways of relating firm data: 1) New firm formation per capita.
2) Total firms per capita (DENSITY).
3) NFF divided by the existing stock of firms (ENTRY).
The interest in the processes of new firm formation (NFF) has a long tradition in economic theory. The reason for this interest is the importance of NFF for the structural adjustment of the economy. Old less productive ways of doing things (firms) die out, when new more productive firms take their place - the famous Schumpeterian idea of “creative destruction” 2. NFF is also as-sociated with the innovation process, since NFF is one way to introduce a new production tech-nology and/or a new product. Therefore the process of NFF is a basic driving force underlying economic growth, and an issue fundamental for economic growth policy (Nyström 2006).
There is an ongoing debate about the level of new firm formation (NFF) in Sweden; the questions are if we have too much or too little, and more fundamentally just what is our level of NFF com-pared to similar countries. One of the interesting things about this debate is that two economists from a government agency, ITPS (The Swedish Institute for Growth Policy Studies) has taken a rather surprising stand, they had an article published in the largest morning newspaper in Sweden (DN) early this year (Scocco et al 2007) headlined “The dedication to increase new firm forma-tion is harming the Swedish economy”. In it they argue that the common belief that Sweden has a relatively low level of new firm formation in comparison to similar countries can be questioned, and that the current focus on, and way of, stimulating the NFF in Sweden may even be hurtful3.
They write that (my translation):
The common view today about the blessings of increased new firm formation can be traced to two main arguments. One is that in the middle of the eighties there was an historic shift in the corporate structure. Going from a situation where the companies just got bigger and big-ger, the development turned and the importance of smaller firms to economic development increased. This shift motivates an increased focus on both new firm formation and the
1 Both definitions found in Klapper et al (2007). 2 Schumpeter (1939)
3 This article has spawned a debate which can be followed here: http://www.ne.su.se/ed/pdf/ the critique has been
most direct from Braunerhjelm & Lundström. B&L writes: ”Our critique has mainly been of the overall picture that ITPS has presented regarding NFF and whether it is reasonable that a government authority goes public with very powerful policy conclusions which appear to lack foundation in the underlying analysis” (B&L 2007 p 70). In a nutshell, the argument is about how far it is decent to extrapolate from imperfect evidence.
importance of small companies, but is not an argument that increased new firm formation in itself would be something good for the Swedish economy. The answer to that question must reasonably depend on whether the level of new firm formation is adequate or not.[…] The goal of increased new firm formation is only convincing when the argument of the increased importance of smaller firms is combined with an argument that Sweden actually has a low level of new firm formation.
Vikström, Andersson & Scocco (2007) at ITPS also argue that the common way of comparing the level of NFF between nations is not unproblematic; “The measure of NFF is not independent of
what it is measured against in international comparisons. Which measure one should use depends naturally on what one wants to illustrate” (p 5). Instead of relating the number of new firms to the total stock of
firms (ENTRY) one should relate the number of new firms to the population (NFF PER CAPITA). In the latter case, they argue, Sweden appears to have a medium level of NFF in re-gard to comparable countries (using Eurostat & COMPENDIA4 data). I.e. we end up in the
middle of the spread among OECD countries. The reason we seem to have a relatively low level of NFF related to the total stock of firms is (among other things) because we have relatively many firms per capita in Sweden.
The argument over the level of NFF in Sweden goes on; many (most?) do believe that there is a case to be made for stimulating NFF in Sweden. “…a majority of entrepreneurship measurements indicate
that Sweden needs more entrepreneurs and increased new firm formation!” (Karlsson & Nyström 2007 p 16)
This thesis will, although not focused on Sweden, give another view as to where Sweden lies relative to other countries regarding NFF5. This is possible using a new dataset from the World
Bank, developed specifically for comparing entrepreneurship levels between many countries. Most studies on firm formation and economic development around the world do seem to find a positive relationship, some examples:
Holtz-Eakin and Kao (2003) examined the impact of NFF on growth in the United States: “…data reveal that increases in the birth rate of firms [NFF] leads, after some lag, to higher levels of productivity, a relationship reminiscent of Schumpeterian creative destruction. Given previous evidence that government policies raise the rate of entry of new entrepreneurs, our findings link these policies to enhanced productivity.” (Abstract, my emphasis)
Carre et al (2007) in a paper analyzing the effects of deviances from a calculated “„equilibrium‟ rate of business ownership”, find that “The main conclusion seems to be that particularly a busi-ness ownership rate below „equilibrium‟ is harmful for economic growth. This would imply that it might be wise to err on the high side. For highly developed countries stimulating entrepreneur-ship [measured as business ownerentrepreneur-ship rates] may be a „no regret policy‟.” (Abstract & p8, my em-phasis)
Karlsson & Nyström (2007) did an analysis of 37 empirical studies on the connection between firm-dynamics6 [näringslivsdynamik], NFF and economic growth. To summarize briefly they find
that the great majority of these empirical studies has found a positive relation between NFF and economic growth. They also make an important general observation regarding employment, NFF and time – namely that the effects of NFF on employment tend to initially be positive followed
4 COMPENDIA is an effort to make OECD entrepreneurship data comparable over countries, and can be found
here: www.eim.net
5 See Figure 2.
6 They refer to firm-dynamics as “the formation, growth, contraction, and destruction of firms including takeovers
by the opposite (due to the “creative destruction” of firms), and that finally – after yet more time, the net effect is positive.
So, it is believed by many scholars that good things can come from increased NFF, and more universally, it is agreed that an increased focus on NFF is motivated due to the historical shift in the economic structure (mentioned above in the article above by Scocco et al 2007). It should be noted that both the skeptics of the necessity of increased NFF in Sweden (e.g. Scocco, & An-dersson at ITPS) and the “optimists” (e.g. Braunerhjelm & Lundtröm 2007) stress the impor-tance of studying the NFF process. The more we learn about NFF and its relationship to eco-nomic growth, employment, etc, the more relevant the results from this sort of study will be – seeking its determinants.
Economic theory suggests that numerous factors are affecting entrepreneurship (demographic, political, cultural, geographical, and economical). There has been a lot of research on this topic, and many factors have been identified as individually related to the level of entrepreneurship in a region or country. For example Lundström and Stevenson (2005) reviewed the literature and pre-sented a table of 41 factors found to have had an impact on either NFF or entrepreneurship ap-proximated in some other way. However, despite the fact that a large number of factors have been identified as individually related to NFF, no one has been able to give a definitive answer as to which factors are the most important for increased NFF and economic growth (Calidoni et al. 2007). And differences across countries remain unexplored. (Freytag & Thurik 2007). This study will take a stab at both of these largely unexplored areas; trying to ascertain which variables, out of 22 selected, appear to be the most relevant determinants of firm formation across countries today. The possibility (and relevance) of this effort hinges on the existence (and quality) of new data from the World Bank concerning firm formation across countries.
To summarize; 1) it is important to analyse the determinants of firm formation since it is believed to be a fundamental process underlying economic growth. 2) There have been many studies on what influences entrepreneurship on the regional (sub-country) level. But 3) little is known about the
determinants of entrepreneurship on the country level. 4) This is an important problem, and what we know
about the predictors of entrepreneurship within countries does not help us understand differences
between countries. For example, we cannot investigate the influence on entrepreneurship of
vari-ables such as “the cost of enforcing contracts" unless we do a cross country analysis. These kinds of variables cannot be investigated on a sub-country level since they do not change values be-tween regions, and therefore leaves us with nothing to compare against. 5) Cross country studies investigating the determinants of entrepreneurship are rare – due to the lack of good data until recently.
1.1 Outline of the thesis
In section 2, theory connecting new firm formation (NFF) and economic growth is presented, followed by section 3 where the theoretical framework of the thesis is presented - explaining what the determinants of NFF are believed to be and why.
The 4th section presents the data used in the analysis and introduces the specific variables
whose relation to entrepreneurship will be investigated. Each variable is defined and a figure representing the values of the dependent variables (entrepreneurship) over countries is presented. The 5th section introduces the statistical model and assumptions used for analysis, followed by
the 6th section where the empirical results and the analysis of those results are presented.
2
Theory connecting NFF and economic growth
The theoretical framework linking NFF to economic growth is provided by the new theories of industry evolution. The old (traditional) equilibrium based view of firm formation - the neoclas-sical school – suggest that NFF retards economic growth, while the new theories of industry evo-lution – the evoevo-lutionary school - suggest the exact opposite; that NFF drives economic growth. The empirical evidence seems to favor the new evolutionary school (Andersson 2006), but for clarity, both schools will be presented.
2.1 The neoclassical school
In neoclassical theory, new firm formation (NFF) is seen as the outcome of expected profits ad-justed for the costs of entry in a market. The entrepreneur is expected to start his company in that particular market where his profits are assumed to be maximized. In the neoclassical model the expected profits of the entrepreneur has been estimated by looking at earlier profits in this market, and the cost of entry has been estimated by looking at for example the intensity of capital and marketing and the minimum efficient scale of production. NFF under this theoretical framework is seen as the outcome of a process called error-correction process in which NFF affects the profits of the already existing firms. A result of this process is expected to be that high profits in a particular market is forced down until it reaches a long term equilibrium, dependent on the barriers to entry in that particular market. The number of firms on a market, given unified tech-nology and perfect competition, will therefore be a function of the barriers to entry or the sunk costs which cannot be transferred to other markets. (Andersson 2006)
This, equilibrium based view, actually suggest that entrepreneurship will retard economic growth, here “new knowledge plays no role; rather, static efficiency, determined largely by the ability to exhaust scale economies dictates growth” (Audretsch 2003 p10). Simply put, economic growth needs larger firms – not more of them. Large firms achieve economy of scale, while more new (small) firms (NFF) detract resources from these established firms.
The empirical support for this neoclassical model of firm formation is weak. Investigations based on this model has “not even nearly” been able to explain variations in NFF; “differences in prof-its and cost of entry between industries must be much greater than observed to be able to explain the variations in NFF.” Further, it does not sit very well with the observed differences in profits between different markets which are “surprisingly large and stable over time” or why “profits do not tend to even out between different firms in the same market over time.” The weak support for this traditionalist view may be related to difficulties in estimating future profits and cost of en-try. (Andersson 2006 p16)
2.2 The evolutionary school
In this school of thinking; the dynamics of firms is seen as an outcome of a selection process which Schumpeter called “creative destruction”. Entrepreneurs (creative) enter the market with an innovation. The innovation may lie in the form of the production technology or in the product itself. In the process of creative destruction it is assumed that new entrepreneurs, with new (bet-ter) products, services or production methods (innovations) succeed in the market over and above established firms (using conventional technology) - leading to destruction of established firms.
For a new firm to be able to successfully establish itself on a competitive market it is necessary for it to have an innovation that is good enough; allowing it to increase productivity in the new firm more than the competing firms using conventional technology - or sell a product/service not provided elsewhere. Hence an important condition for making innovations successful is as-sumed to be the creation of temporary monopolies for innovations - making sure that the gains
from innovations are reaped by the new firm, which is assumed to be in a more difficult situation due to its recent entry into the market. (Andersson 2006)
The ambition to gain monopoly profits drives entrepreneurs to invest in R&D, generating innovations and growth through a process of creative destruction. (Andersson 2006 p 19)
The new theories of industry evolution “…are dynamic in nature and emphasize the role that knowledge plays”. Because of particular problems related to knowledge7 – it is inherently
uncer-tain, asymmetric and associated with high costs of transactions; different opinions are formed as to the true value of new ideas (innovations). “Economic agents therefore have an incentive to leave an incumbent firm and start a new firm [NFF] in an attempt to commercialize the perceived value of their knowledge.” (Audretsch 2003 p. 11)
Anderson (2006 p19) argues that evolutionary theory “…where NFF coincides with the introduction of
new innovations…cannot be tested since innovations are assumed to appear randomly.” This is the problem
with some economic theory – that it cannot be empirically (dis)proved. This doesn‟t keep this particular theory from being useful for our purposes though. Innovations or ideas may appear randomly – but that does not necessarily mean that NFF appears randomly. All new innovations (ideas) does not lead to NFF - there are barriers to overcome (also likely to influence the relative longevity of firms) – so, it would seem logical that where the barriers to NFF are less severe – NFF is relatively large. Audretsch talks about this using the term entrepreneurship capital. This term is defined simply as “the capacity of an economy to generate the start-up of new firms”, and; “The emergence of entrepreneurship policy to promote economic growth is interpreted as an at-tempt to create entrepreneurship capital” (Audretsch 2007 p65). So, one could say that this thesis will be about the determinants of “entrepreneurship capital” i.e. what influences the capacity of economies to generate the start-up of new firms.
3
The determinants of NFF: theoretical framework
To understand what determines NFF and how public policy can be adapted to promote NFF, a model developed by (Audretsch et al 2002), is useful8. It helps in two ways; 1) it demonstrates
reasons why the degree of firm formation varies across countries, and 2) it identifies the different
ways in which public policy can be implemented to increase NFF. This model makes a distinction
between factors shaping the supply of NFF, and factors influencing the demand for NFF. The demand for NFF reflects the opportunities for NFF - recognizing that the opportunity of individu-als to start firms varies across countries. The supply of NFF, contrastingly, is shaped by
characteris-tics of the population. (Audretsch 2003)
The framework is depicted in Figure 1 below. It visualizes how demand and supply factors (to be elaborated on below) help to shape the risk-reward profile of individuals contemplating starting a firm.
The framework emphasizes that while the decision to start a firm is embedded into a broad range of social, economic, political and cultural factors, ultimately it is individuals who make a choice whether or not to start a firm9. Given all of the factors from both the supply and demand sides,
7 It is important to separate knowledge from information. Knowledge is the ability to use information. (Karlsson &
Nyström 2007, footnote p13)
8 Originally the model uses the problematic word “entrepreneurship” in its theoretical framework; this has been
rephrased so that it is absolutely clear what we are talking about – NFF.
9 Technically, economic agents (individuals, firms, agencies, and organizations) start firms. (Karlsson & Nyström
individuals weigh the perceived risks and rewards from starting a firm. As a result, they may choose to start a firm (entry) or not to, or even to terminate an existing firm of theirs (exit). (Au-dretsch 2003)
The risk-reward profile represents the process of weighing alternative types of employment. That is, the choice of the individual between wage-labor, unemployment, and starting a firm. This choice is influenced by the opportunities presented by the demand side and the resources and ab-ilities presented by the supply side. (Audretsch 2003)
If the actual degree of NFF deviates from its targeted degree (NFF*), government policies may be undertaken to alter the basic forces shaping firm formation activity. As visualized in Figure 1, such policies are implemented by changing the different components shaping either: the demand side, the supply side, or else the risk-reward profile directly. (Audretsch 2003)
Figure 1: Framework for the determinants of Entrepreneurship. Source: Audretsch et al. (2002)
Figure 1 illustrates five types of policies (five G‟s) available to influence the rate of NFF.
G1: Demand factors; promotes NFF by altering the factors shaping opportunity for NFF. Such
policies include: deregulation of entry into markets, the privatization of government services, access to government support programs, promoting firm linkages and clusters. (Audretsch 2003) Supply factors; promotes NFF by altering the factors shaping the supply side. Policies such as:
G2: Facilitating the participation and access of previously excluded minorities;
G3: enhancing the skills and capabilities of individuals through education and training, or by
pro-vision of micro-credit or other types of finance;
G4: improving views toward NFF, including promotional campaigns using the media and the
educational system
G5: Policies changing the risk-reward profile directly, such as: taxes, subsidies, labor market rules and bankruptcy regulation. (Audretsch 2003)
3.1 Institutions and entrepreneurship
in·sti·tu·tion: A custom, practice, relationship, or behavioral pattern of importance in the life of a community or
society.10
10The American Heritage® Dictionary of the English Language, Fourth Edition. Retrieved January 31, 2008, from
Boettke & Coyne (2004) identify the role of institutions as to: “remove uncertainty and facilitate social interaction” by making the actions of others predictable.
During the 1960‟s and 70‟s economists began to focus on the importance of institutions for economic growth. The standard (neo-classical) growth models suffered from an “inability to con-sider the rules of the game and the incentives that those rules provide”. Put simply “the neoclas-sical model failed to answer the pertinent questions why? and what? [see below]” (Ibid p 12)
Why is there capital accumulation through forgone consumption and investment or a lack thereof? Why are there new technological advances in some countries and not others? Why is existing technology used more efficiently in some places as compared to others? What causes laborers to invest in their own development and what causes employers to invest in their employees? … (Ibid)
These questions can only be answered by considering the role of institutions i.e. the rules of the
game. William Baumol (1990), with his theory of „productive and unproductive entrepreneurship‟
made some very influential conjectures about the effect of institutions on entrepreneurship. Con-jectures that today appear accepted as virtual truisms in the literature, and have received consi-derable empirical support (see e.g. Sobel 2006). Baumol (1990 p 6) wrote that:
If entrepreneurs are defined, simply, to be persons who are ingenious and creative in finding ways that add to their own wealth, power, and prestige, then it is to be expected that not all of them will be overly concerned with whether an activity that achieves these goals adds much or little to the social product or, for that matter, even whether it is an actual impedi-ment to production…
Baumol (1990), like Ludwig von Mises and Israel Kirzner, saw entrepreneurship as an omnipre-sent feature of human nature, and therefore believed that what differs between economies, is not so much the underlying entrepreneurial spirit – but how that spirit is channeled through
institu-tions or the rules of the game. (Sobel 2006, Boettke & Coyne 2004)
If entrepreneurship is the imaginative pursuit of position, with limited concern about the means used to achieve the purpose, then we can expect changes in the structure of rewards to modify the nature of the entrepreneur‟s activities, sometimes drastically. The rules of the game [institutions] can then be a critical influence helping to determine whether entrepre-neurship will be allocated predominantly to activities that are productive or unproductive and even destructive (Baumol 1990 p 14)
Entrepreneurial individuals (using Baumols definition) have a choice to devote their labor efforts toward either 1) private-sector wealth creation (productive entrepreneurship), or 2) toward secur-ing wealth redistribution (unproductive entrepreneurship) through political, economical,11 and legal
processes (such as lobbying for privileges or rent seeking through litigiousness12). Unproductive
entrepreneurship would also, of course, cover illegal activities such as drug dealing. This choice of the entrepreneur over where to direct his efforts, to productive or unproductive entrepreneur-ship is influenced by the corresponding rates of return to the two activities. Institutions, such as: secure property rights, a fair and balanced judicial system, contract enforcement, and effective limits on government‟s ability to transfer wealth through taxation and regulation, give lower
11 Baumol (1990 p 18) gives the following example of an unproductive economic process: (quoting Lindbeck 1987 p
15) “„smart‟ speculative financial transactions without much (if any) contribution to the productive capacity of the economy”.
12 Litigiousness: a quarrelsome disposition to engage in or carry on lawsuits. (WordNet® 3.0. Princeton University.
turns to unproductive entrepreneurship, hence stimulate its productive counterpart. (Baumol 1990, Sobel 2006)
NFF may be classified as a venue for “productive entrepreneurship”. Following the theoretical framework just described then, good institutions should increase the rate of firm formation. Pri-marily through changing the risk-reward profile of entrepreneurship described in Figure 1.
4
Data: sources and variables
“Comparing the level of entrepreneurship across nations is difficult for several reasons. The lack of a universally agreed set of indicators…and of a generally accepted definition of entrepreneurship makes measurement and com-parison of the level of entrepreneurship for different time periods and countries a challenging exercise.” (Audretsch
et al. 2007 p 3)
These difficulties stated by Audretsch above are exactly what the World Bank (WB) and the Global Entrepreneurship Monitor (GEM) have been working to overcome. The GEM study, however, uses some unconventional measures of “entrepreneurship” and, to my knowledge does not measure NFF at all. The WB data was chosen for this reason. Data from the OECD (COMPENDIA) was considered but rejected due to the small number of countries covered in their data.
The 2007 World Bank Group Entrepreneurship Survey, “measures entrepreneurial activity in 84 de-veloping and industrial countries over the period 2003-2005. The database includes cross-country, time-series data on the number of total and newly registered businesses, collected directly from Registrar of Companies around the world… This joint effort by the IFC SME Department and the World Bank Developing Research Group is the most comprehensive dataset on cross-country firm entry data available today.
Three measures of entrepreneurship were chosen as dependent variables, each capturing a differ-ent aspect of differ-entrepreneurship. “ENTRY”, “NFF PER CAPITA”, and “DENSITY”, they are all defined in Table 1 below. ENTRY captures a country‟s entrepreneurship level compared to last year‟s level of entrepreneurship. NFF PER CAPITA captures a country‟s entrepreneurship level regardless from previous entrepreneurship. DENSITY captures a country‟s cumulative history of entrepreneurship (net firm formation).
Data providing explanatory variables for entrepreneurship was collected from 5 different sources. Chief among them two other public WB datasets, namely the Doing Business-one and the Worldwide
Governance Indicators (WGI) project Complementary data was taken from the US Census Bureau - In-ternational Data Base (IDB), the World Development Indicators database., and the World Economic Outlook Database.
Due to methodological considerations and imperfect datasets (information missing for certain variables for certain countries and years) some original data removed in order to get a more har-monious dataset to work with. For information on the criteria for removal of data and specific data removed (and added), see Appendix D.
In Table 1 below, all variables under analysis are presented, for more detailed information about them see Appendix A. Descriptive statistics of all variables are given in Appendix B. The sources given in the table are useful if the reader is interested in further knowledge of how the variables are defined. (Due to lack of space; especially the “political” and “institutional” can only be briefly explained – there are pages outlining the definitions of each one to be found at their respective sources online.)
Table 1: Variables under analysis presented with descriptions and what kind of entrepreneurial policy op-tion they are deemed to represent (by the author) in connecop-tion with Audretsch model above (p. 7). All va-riables have 183 observations (61 countries x3 years) except FIRM DENSITY (TCPCWA) which has 182 observations (data for Germany 2005 missing).See Appendix A and B for more details.
Dependent Variables
ENTRY – NFF compared to the existing stock of firms. NCPC (NFF PER CAPITA)
TCPC (DENSITY) – Total firms per capita in the end of the year. Independent variables
Demand factors (G1); promotes NFF by altering the factors shaping opportunity for NFF.
Such policies include: deregulation of entry into markets, the privatization of government servic-es, access to government support programs, promoting firm linkages and clusters. (Audretsch 2003):
SBCOSTINCPC Starting a Business; Cost of income per capita.
SBMCINCOC Starting a Business Min. capital of income per capita.
SBPROC Starting a Business, Procedures necessary.
SBTIMED Starting a Business; Time measured in days necessary.
GGFCE General government final consumption expenditure as a share of GDP
TRADEGDP The sum of exports and imports of goods and services measured as a share of gross domestic product.
Supply factors; promotes NFF by altering the factors shaping the supply side. Policies such as:
G2: Facilitating the participation and access of previously excluded minorities;
G3: enhancing the skills and capabilities of individuals through education and training, or by pro-vision of micro-credit or other types of finance;
G4: improving views toward NFF, including promotional campaigns using the media and the educational system
DCREDBANK Domestic credit provided by banking sector (% of GDP)
DCREDPRIV Domestic credit to private sector (% of GDP)
GDPPPP GDP per capita, PPP adjusted
LOGGDPPPP The natural log of the variable GDPPPP
Policies changing the risk-reward profile directly (G5), such as: taxes, subsidies, labor market rules and bankruptcy regulation. (Audretsch 2003)
EMPWFCWAG Employing workers; Firing costs weeks of wages
ENFCCOST Enforcing Contracts; Cost
ENFCPROC Enforcing Contracts, Procedures number
ENFCTIMED Enforcing Contracts, Time days
CBCOST Closing a Business; Cost of estate
CBTIME Closing a Business; Time years
VOICEACC Voice and Accountability
REGQUAL Regulatory Quality
RULEOFLAW Rule of Law.
CNRTLCORR Control of Corruption.
GOVEFF Government Effectiveness
4.1 Entrepreneurship between countries
The levels of entrepreneurship (measured in three different ways - our dependent variables) over the 61 countries to be used in our empirical analysis are shown in the figure below (Figure 2), here we can see which countries are under analysis and what their average levels of ENTRY, NFF PER CAPITA, and DENSITY (defined in Table 1) were over the years 2003-2005. The idea is to give an overview of the country-level differences in entrepreneurship that we will seek explanations for in our empirical analysis. The countries are listed in accordance to GDP per cap-ita PPP adjusted.
We can now get a fix on Sweden‟s “entrepreneurial position”. I will relate her position with re-gard to the following 22 selected countries: (chosen for having PPP adj. GDP per capita levels similar to Sweden, thus being comparable countries.)
Norway, Ireland, United States, Switzerland, Denmark, Austria, Canada, Hong Kong, China, United Kingdom, Netherlands, Belgium, Finland, Sweden, Japan, Italy, Germany, France, Singapore, Israel, Spain, & New Zealand.
In terms of ENTRY the WB data ranks Sweden 43rd (from the top) out of the 61 countries
under analysis. Ahead of only 5 comparable countries: Finland, Italy, Canada, Japan, & Israel. In terms of NFF PER CAPITA we come in 29th out of the 61 countries under analysis. Ahead
of only 3 comparable countries: Belgium, Finland, and Japan.
In terms of DENSITY – arguably the most important measure, we rank 16th out of the 61
countries under analysis. Ahead of 10 comparable countries: Belgium, Italy, Singapore, Finland, Austria, Japan, France, Switzerland, United States, & Germany.
Summarizing for the case of Sweden; it is only in one measure of entrepreneurship, DENSITY that we perform among the upper half of comparable countries. For the other two measures of entrepreneurship; ENTRY and NFF PER CAPITA, we are among the bottom 27% and 18% of comparable countries.
Restating the quote from Newspaper article in the beginning: (Scocco et al. 2007)
The goal of increased new firm formation is only convincing when the argument of the in-creased importance of smaller firms is combined with an argument that Sweden actually has a low level of new firm formation.
It seems like the WB entrepreneurship data conveys an argument “that Sweden actually has a low level of new firm formation.” However, it can be doubted whether this dataset is “better” than the dataset that Scocco et al. (2007) based their article on. Rather it is possible, even likely that the WB dataset differs from OECD (COMPENDIA), and EUROSTAT data in terms of what de-fines a firm13, if true; this could explain the apparent variance between the datasets.
The WB data used was collected through surveys and follow-up phone calls to business registries, other government sources, and private organizations in 84 countries. The main problem with this lies in the “great heterogeneity” that characterizes these entities, in terms of, among other things;
“prevailing regulations, methodologies, and implantation of digital administration” (Klapper et al. (2007 p 6)
arguably however; data from richer countries ought to be quite precise, due to them having more resources to gather and organize their data; furthering the case for those who argue that Sweden has a problematically low level of NFF.
It is important to note that the data used covers simply registered firms; hence it acts only as a
proxy of “productive entrepreneurship”. As Henrekson & Stenkula (2007) argue; NFF is not
Fi gur e 2: A ver ag e En tr ep ren eu rs hip level s ov er the yea rs 2003 -2005 , m ea sur ed in thr ee diff er en t wa ys ov er 61 count ries ; s orte d in as-cen ding ord er in rel at ion to PPP a dj us ted G DP pe r ca pita. NFF PE R CA PITA (N CP C) ha s be en mul ti pl ied by fi ve to make it ea sier to see. S our ce: The W orl d Bank G roup En tr ep ren eu rs hip Da ta ba se, the US Cens us Bur ea u, an d au thor s c al cu lat ions .
synonymous with entrepreneurship (as the concept is used in the literature), but it is nevertheless in practice the most important channel for individuals to realize their entrepreneurial ambitions. 14
5
Statistical Method
15Assumptions made: 1) the underlying determinants of NFF are essentially the same in all economies. This is a fundamental assumption, necessary in order to be able to analyze which determinants are most important for NFF in general (i.e. across countries). As Kenny & Williams (2001 p3) state:
Only if all economies are fundamentally the same, in their components and their processes, does the search for fewer and fewer universal explanatory variables or "laws" make sense.
The second assumption, which led to the adoption of a particular statistical model, is that, build-ing upon assumption 1, it is also assumed that 2) there are country-specific effects influencbuild-ing NFF. This second assumption means that it is taken to be true that factors that we are unable to con-trol for in our statistical model influence NFF. Examples of these unobserved country-specific effect are; culture, geographical location, and a country‟s natural resource endowment – all likely to be correlated with NFF (and our explanatory variables), so we need to control for these unob-served factors in order to avoid “omitted variable bias” with respect to the estimated coefficients of the explanatory, independent variables. (Rockefeller College)
Since the data gathered is panel data, that is, a combination of cross-section and time series data, an econometric technique suitable for this will be used. Using panel data methods we are able to control for individual heterogeneity - which is likely to be an issue in this kind of dataset covering a group of diverse countries. It is likely that each individual country has specific characteristics that we are unable to measure with the set of variables in our empirical model. We call these va-riables unobservable country-specific effects. These country-specific effects may be assumed to be either random or fixed. If the country-specific effects are assumed to be random, this implies that they are uncorrelated with the other explanatory variables and the random effects method is appropriate. In the fixed effects model, however, the country-specific effects are assumed to be correlated with the explanatory variables. The choice between random or fixed effects should de-pend on the nature of the data. (Nyström 2006, p 40f, Wooldridge 2003 p 452f)
“When we cannot consider the observations to be random draws from a large population… it often makes sense to
think of the [unobserved effects] as parameters to estimate, in which case we use fixed effects methods. Remem-ber that using fixed effects is the same as allowing a different intercept for each observation, and we can estimate these intercepts by including dummy variables…” (Wooldridge 2003 p 452)
Since our data are neither gathered from random draws nor from a large population, the fixed ef-fect model is the appropriate choice. A fixed efef-fect model including unobservable individual spe-cific effects is denoted as a one-way fixed effect model16. In a fixed effects model, the
14 Actually, they make a distinction between NFF and private business ownership in their book, so that: “NFF and
private business ownership… are the two most important channels for individuals to realize their entrepreneurial ambitions” (p 39). For this thesis however, it seems superfluous to make the distinction between NFF and private business ownership. It would only be relevant if we knew how the quantitative relations between these two con-cepts were for all countries under analysis in this thesis – in which case we might learn something interesting.
15 Much of how this section is phrased and structured is inspired by Nyström (2006) whom made a similar empirical
analysis but regarding entry and exit patterns in Swedish industry.
16 In a two-way fixed effect model; unobservable time-specific effects are also included. I did an analysis with this
kind of model, but since only one year, 2005, reached significance (negative) in one model (2); and this did not bring any significant difference to the estimated coefficients; it was decided that the two-way fixed effect model was superfluous to explaining anything relevant for the purpose of the thesis.
ble (country-specific) effects are assumed to be correlated with the explanatory variables (Wool-dridge 2003). Following Nyström (2006) the least squares dummy variable estimator (LSDV) will be used for the fixed effect model.
Equation (1) directly below shows the one-way fixed effect model:
Y
i,t= α
1ExplanatoryVariable1
i,t+ … + α
22ExplanatoryVariable22
i,t+ c
i+ v
i,tIn this model Yi,t denotes the dependent variable(s) – the same model is used for all three.
Sub-script i and t denotes country and year. The alphas are parameters to be estimated.
c
idenote thecountry specific effects and in a fixed effects specification these are also parameters to be esti-mated.
v
i,tdenotes the remainder disturbance term, which is assumed to be independent and identically distributed with zero mean andσ
v2 variance. (Following Nyström 2006)In this fixed effect model the dependent variables are assumed to be independent of the distur-bance term;
v
i,tfor all
i and t (countries and years). (Nyström 2006 p 41)To find the variables with the highest prediction power, i.e. the best model for predicting entre-preneurship (as measured by our dependent variables), I somewhat followed Bryhn (2007) in me-thod and criteria used.
Relationships were first analyzed through single regressions using the LSDV model, i.e.:
Y
i,t= α
1ExplanatoryVariable
X+ c
i+ v
i,t(Equation 2)
Subscript X denotes my 22 independent variables.
This model was accordingly tested 22x3 times, for 22 variables and 3 models and the estimates for the individual explanatory variables to the three dependent variables can be found in Appen-dix C.
The variables found to be significant determinants of entrepreneurship (as measured by the three models where
Y
equals ENTRY, NFF PER CAPITA, and DENSITY) were then used to per-form stepwise regressions of the three models defined by equation 1.Stepwise multiple regressions make it possible to distinguish the strongest co-varying para-meter, followed by all other parameters that may add additional explanatory power to the re-gression. Several potential x-variables can all show strong individual correlations with the y-variable that they are being used to forecast, although these individual correlations may not be additive if the x-variables are also correlated with each other. Multi-variate models may take such co-variation between x-variables into account if they are developed with stepwise multiple regression techniques… (Bryhn 2007 p 5)
The only criterion for variables to be accepted was that they were significant in, and did not change sign between the simple LSDV regression and the multivariate stepwise LSDV re-gression; which none of them did. Two of them, however, and logically (to be explained in section 6.4) would have failed a more stringent (and unreasonable in this case) criterion of not changing signs between an ordinary simple OLS (not LSDV) regression and the multi-variate stepwise regression.
The complete output from the stepwise regressions along with tests for heterogeneity, and multicollinearity can be seen in Appendix B.
5.2 Expected results
Expected linkages between the variables under analysis (Table 1) and our three measures of entrepreneurship; the dependent variables:
Concerning the expected relation of most of these variables to entrepreneurship, there is no ear-lier research done (that I could find) – that is; of these variables evaluated separately; with two ex-ceptions:
SBPROC (procedures necessary to start a business) was found to be negatively related to NCPC and DENSITY by Klapper et al. (2007),
GGFCE, (General government final consumption expenditure as a share of GDP) is a proxy of government size, which has been found negatively related to entrepreneurship by Nyström (2007) and Bjørnskov & Foss (2006) both of these studies, however, used other measures of gov-ernment size and entrepreneurship (both used GEM-data).
Now, there are at least two studies made that jointly cover all of my “political” and “institutional” variables – albeit trough analysis of their combined effect. There is a ranking made where all my “institutional” (Doing Business) variables (and some more) enter into a simple formula calculating the “Ease of doing business rank”. And there is variable created by averaging all of the “political” variables into one called “governance”.
The “Ease of doing business ranking” has been found to be positively correlated with eco-nomic development (Djankov et al 2006) – implying that all of our “institutional” variables may have a
negative effect on entrepreneurship (that‟s how they are specified) since entrepreneurship and economic
development has also been found to be significantly positively related. See e.g. Klapper et al (2007).
The variable “governance” was found positively linked with entrepreneurship in Klapper et al (2007) implying that all of our “political” variables may be positively related to entrepreneurship.
As greater levels of economic development have been found positively related to higher levels of entrepreneurship; the variables GDPPPP and LOGGDPPPP ought to be positively related to entrepreneurship.
The variables that have not been covered now are TRADEGDP, and two credit measurements; DCREDBANK, and DCREDPRIV. My conjecture is that they all ought to be positively related to entrepreneurship:
Increased trade (TRADEGDP), since every good traded presumably needs an importer and exporter, hence increased trade implies at least an increased number of firms working with im-port/export.
Access to credit is considered very important for business (see e.g. Karlsson & Nyström 2007) therefore TRADEGDP & DCREDBANK are expected to be positively related to entrepreneur-ship.
Simple regressions were made using the LSDV model between all dependent and independent variables, and the expected results were confirmed, that is, for all variables found to have a signif-icant impact on the three models measuring different aspects of entrepreneurship; the signs (+/-) estimated were as expected – with one exception; CBTIME (Closing a Business; Time years) which was found to be positively linked to the DENSITY measurement of entrepreneurship (model 3). For the details of these regressions see appendix C.
6
Empirical results and analysis
In this section the results from the stepwise regression estimations of the models defined by Equation 1 are presented and analyzed (Table 3). A standard correlation matrix is also presented (Table 2). Appendix A presents some descriptive statistics regarding the variables used in the em-pirical analysis.
Table 2 below presents the pairwise correlation matrix for the variables finally used in the predic-tion models. The univariate tests show that only two of the three entrepreneurship measure-ments, NCPC (NEW FIRM FORMATION PER CAPITA) and TCPC (DENSITY) were sig-nificantly related to all country characteristics (independent variables) – ENTRY was not found to be significantly related to GGFCE (general government final consumption expenditure as a share of GDP). It is also clear that there are significant correlations between all of the dependent variables.
Table 2: Pairwise correlation matrix of the variables found to best predict our three measures of entrepre-neurship, panel of 61 Countries, 2003-2005. Note: Asterisks *, **, and ***, indicate significance at 10 %, 5%, and 1%, respectively. Source: For all variables see Table 1.
Following the method outlined in section 5; the explanatory variables found to (jointly) best pdict our three measures of entrepreneurship are shown below in Table 3. Appendix B show re-sults from heteroskedasticity and multicollinearity tests; they do not indicate any significant prob-lems
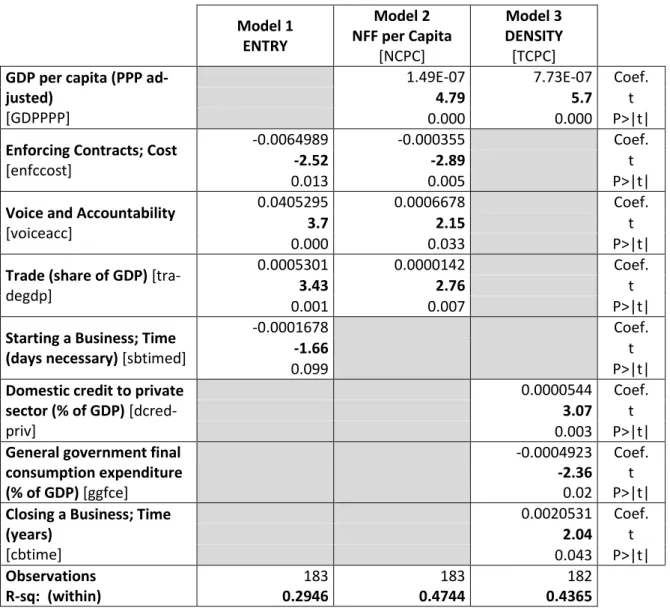
Table 3: Fixed effects model stepwise estimation results for the determinants of ENTRY, NCPC and TCPC. For a simple overview of the findings they are all displayed in the same table. The gray cells are to be ignored - they only indicate that those specific variables were not found to be particularly significant for the related (multivariate) model. The country specific effects are not listed here but in Appendix B. Source: For all variables see Table 1.
Model 1 ENTRY Model 2 NFF per Capita [NCPC] Model 3 DENSITY [TCPC]
GDP per capita (PPP ad-justed)
[GDPPPP]
1.49E-07 7.73E-07 Coef.
4.79 5.7 t
0.000 0.000 P>|t|
Enforcing Contracts; Cost
[enfccost]
-0.0064989 -0.000355 Coef.
-2.52 -2.89 t
0.013 0.005 P>|t|
Voice and Accountability
[voiceacc]
0.0405295 0.0006678 Coef.
3.7 2.15 t
0.000 0.033 P>|t|
Trade (share of GDP)
[tra-degdp]
0.0005301 0.0000142 Coef.
3.43 2.76 t
0.001 0.007 P>|t|
Starting a Business; Time (days necessary) [sbtimed]
-0.0001678 Coef.
-1.66 t
0.099 P>|t|
Domestic credit to private sector (% of GDP)
[dcred-priv]
0.0000544 Coef.
3.07 t
0.003 P>|t|
General government final consumption expenditure (% of GDP) [ggfce]
-0.0004923 Coef.
-2.36 t
0.02 P>|t|
Closing a Business; Time (years) [cbtime] 0.0020531 Coef. 2.04 t 0.043 P>|t| Observations 183 183 182 R-sq: (within) 0.2946 0.4744 0.4365
6.1 General findings
The parameter estimates for the country specific effects are presented in Appendix B. Looking at those for model 1; 53 out of the 61 countries included have significant country-specific effects in model 1. Also, the stepwise estimation result show that only four variables are significant at the 10 per cent level. These findings in combination with extremely high values for the goodness of fit measure, R2 (see Appendix B) confirm that unobserved country-specific effects are very
im-portant for explaining cross country differences in entry rates. These findings generalize to model two and three as well, albeit to a smaller extent, with 40, and 22 countries respectively having sig-nificant country-specific effects.
About the measure presented in Table 3 of the coefficient of determination, R2, (measuring the
proportion of variability in a data set that is accounted for by a statistical model) “R-sq: (within)” is based on the within (country) transformation. “Thus, it is interpreted as the amount of time variation
in the [ Yi,t i.e. dependent variable] that is explained by the time variation in the explanatory variables.” (Wooldridge p 444) This ought to be the measurement of most interest for our purposes. Mea-suring how much, on average, that the change in entrepreneurship; is explained by the independent variables for every country under analysis over the time period analyzed. The selected variables seem to explain between 29 and 47 percent of entrepreneurship development in the three models – rather significant amounts. “R-sq: between” and “R-sq: overall” (see Appendix B) are other possible ways of computing R-squared for panel data, I am uncertain as to their interpretation however, and therefore chose not to include them in Table 2.
The use of a stepwise regression method implies that out of the 22 explanatory variables ana-lysed, the variables presented in Table 3 are jointly the best determinants of entrepreneurship, among all possible multivariate models that could have been formed from these variables – the combinations presented were found most significantly related to entrepreneurship (using this par-ticular econometric model).
Before analysing the results, I‟d like to include the usual caveat that for all variables found to be significantly related to some independent variable; we cannot say which one influences the other; so e.g. “Voice and Accountability” may have a positive impact on NFF PER CAPITA; but it could also be the other way around. With this in mind, an analysis of the variables found most signifi-cantly related to the three measures (models) of entrepreneurship follow.
Model 1: Determinants of ENTRY
ENTRY again, is; NFF year t divided by the economy’s total number of firm’s year t – 1.
Enforcing Contracts; Cost, is found to be significantly negatively related to entry-rates,
indicat-ing that the relative cost to “have justice done” is an important determinant of entry rates. The reason for this seem straight forward enough; as Adam Smith wrote (1776, xliii, as referenced by Boettke et al. 2004 p 1)
“Little else is requisite to carry a state to the highest degree of opulence from the lowest barbarism, but peace, easy taxes, and a tolerable administration of justice; all the rest being brought about by the natural course of things.” (My emphasis)
If “the cost of justice” is high; so are the risks for the entrepreneur. He/she should know that their existing or future business is protected by their ability to affordably state their grievances in front of a court of law – have they been unlawfully treated by some “evil-doer”.
Voice and Accountability, (measuring the extent to which a country's citizens are able to
partic-ipate in selecting their government, as well as freedom of expression, freedom of association, and a free media;) is found to be significantly positively related to entry rates. I‟d speculate that espe-cially the freedoms related to information captured by the variable are the cause of this; entrepre-neurship becomes more risky if information about what‟s going on in the economy is scarce, every economic decision is made easier with more information. This variable is estimated to be the most significant determining ENTRY – implying that ENTRY rates are strongly driven by freedoms related to the free flow of information and freedom of political action.
Trade (share of GDP), was found significantly positively correlated with entry rates. As I
pre-viously argued, this might be due to the businesses (firms) necessary for trade; there is always a buyer (importer) and a seller (exporter) of products traded. More trade – more firms - all else equal.
Starting a Business; Time (day’s necessary) is found to be (barely) significantly negatively
re-lated to entry rates. This variable can be shortly described as indicating the time it takes to get a business up and running legally. It is interesting that this variable is only found especially
impor-tant for ENTRY rates – and not NFF PER CAPITA (model 2). This is probably because “GDP per capita PPP adjusted” (GDPPPP) enters as a very significant variable in this model and since SBTIMED is significantly correlated with GDPPPP (Table 2) it is likely that some of what this variable explains regarding NFF PER CAPITA is captured by the GDPPPP variable already – causing it to be insignificant at the 10% level in model 2.
GDP per capita (PPP adjusted) is not found to be significantly related to entry rates, this may
seem peculiar. But ENTRY, by definition, takes the cumulative history of net firm formation into account. Hence countries with a big stock of firms in the previous year need to have more NFF than countries with a smaller stock of firms in the previous year in order to get the same entry rate. Perhaps this, which kind of lets countries “compete” for entry rates according to their own capacity, is why GDP (PPP) is not a significant predictor - GDP growth would seem more likely to be. Another reason could be the different kind of economies we can assume exist in different countries – stimulating NFF in ways not much correlated with GDP (PPP), some countries have many small firms, other have fewer but larger ones – it is likely that countries with many smaller firms also have more “crunching” going on (higher entry and exit of firms every year), and GDP (PPP) is perhaps not a good predictor of economy structure (small or big firms). Vikström et al. (2007 p 8) argues similarly about Sweden (but this generalizes):
[In order to] … analyze NFF in Sweden it is necessary to consider differences in economic structure and levels of employment. In a country like Sweden, with a rela-tively large share of the economy devoted to capital-intensive manufactures, it is rea-sonable that the firms are larger and fewer compared to countries with a larger share of the economy aimed at consumer services.
Model 2: Determinants of NFF PER CAPITA
NFF PER CAPITA again, is; NFF year t divided by the population year t.
Here, GDP per capita (PPP adjusted), is found to be the variable most significantly related to NFF PER CAPITA, i.e. the best determinant of NFF PER CAPITA among the variables under analysis. The (expected) positive sign means that higher levels of economic development covari-ates with higher levels of NFF per capita. The fact that higher national levels of GDP per capita
(PPP adjusted) is found positively related to higher levels of NFF supports evolutionary theory -
arguing that NFF drives economic growth.
The other three variables found to be significant determinants in this model, were touched upon in the previous section, and they are assumed to influence NFF PER CAPITA rates in the same way as ENTRY rates, and therefore will not be elaborated upon further here – except to say that the fact that these three variables were found to be significant related to entrepreneurship for two different ways of measuring it (ENTRY, and NFF PER CAPITA rates) strengthens the case that these three variables are of particular importance for new firm formation (NFF). These variables are:
The cost of Enforcing Contracts (Enforcing Contracts; Cost) Voice and Accountability
Trade (as a share of GDP)
Model 3: Determinants of DENSITY
17DENSITY, again, is defined as; total firms per capita in the end of year t. It captures how entrepreneurial a
country has been in its past – its cumulative history of net firm formation.
GDP per capita (PPP adjusted); as evolutionary theory would predict; is the explanatory
varia-ble most significantly related to the level of economic development in stepwise multiple regres-sion using the LSDV model (Table 3). Interestingly though, in the simple LSDV regresregres-sions, (Appendix C) this variable is estimated as having slightly higher t-value and significantly better R-sq value as individual predictor of NFF PER CAPITA (t-value 8.66, R-R-sq within 0.38) although the estimated t value for model three is also very high (8.01, R-sq within 0.09)
Domestic credit to private sector (% of GDP) is defined as “…financial resources provided to the private sector, such as through loans, purchases of non-equity securities, and trade credits and other accounts receiv-able that establish a claim for repayment. For some countries these claims include credit to public enterprises.”
This variable is found to be positively related to density, i.e. the total stock of firms per inhabitant in a country. The fact that is found as one of the four best (joint) determinants of ENTRY shows how vital the access to credit is for firms; particularly for their survival, theory is that that new firms need to quickly expand in order to reap benefits of scale and survive in a competitive mar-ket – here access to credit is vital, and this variable is a proxy of that. (See e.g. Karlsson & Nyström 2007)
Now, to reconnect with what was brought up earlier (section 5) concerning the criteria used and how two variables in this model would not have passed an “unreasonable” criteria (in this case) of not changing signs between a simple OLS regression (not shown but always estimates the same signs of correlation as pairwise correlation – Table 2) and the final stepwise LSDV regres-sion used.
As can be seen in Table 2, the variables GGFCE (general Government Final Consumption Ex-penditure as a share of GDP) and CBTIME (time, measured in years it takes to close a business) are estimated to have the opposite signs estimated through simple (pairwise) correlation com-pared to using the LSDV model (Table 3). This is because simple OLS regression (and pairwise correlation) does not take unobservable (country-specific) effects into account; hence, since rich-er countries tend to have relatively highrich-er values for GGFCE, lowrich-er values for CBTIME and
high-er levels of DENSITY (total firms phigh-er capita) these kind of simple models does not take into
ac-count that this might be for other - unobservable (ac-country-specific) factors – as the LSDV model can. Hence these simpler models estimate the opposite relation of these variables with DENSITY. That is GGFCE is found to correlate positively with DENSITY (TCPC) and CBTIME negatively (Table 2). The LSDV model estimates the opposite signs.
General government final consumption expenditure (% of GDP): As just mentioned, is
found to be significantly negatively correlated with ENTRY in the fixed effect LSDV model. This is in accordance with theory; following the theoretical framework outlined in section 3 this is a G1, or demand, factor, which affect entrepreneurship through limiting the opportunities (“de-mand”) for NFF. That is, since this variables proxy government employment – and higher gov-ernment employment implies fewer opportunities for private firms in healthcare etc. etc.
Closing a Business; Time (years): This variable was found significantly positively related do
DENSITY rates. This “finding” was the most unexpected to the author - due to having confused
17 In the stepwise regression of this model, loggdpppp was estimated as one of the jointly most significant variables
together with gdpppp, it seemed unreasonable to have both gdpppp and its natural log (loggdpppp) be explanatory variables. Therefore I made further stepwise regressions estimating results when removing either variable. The re-sults from accepting only gdpppp had higher R-sq: (within) values, and therefore this variant was accepted.