VTI notat84A-1998
Feasibility of using roller brake
testers instead of road tests for
heavy vehicles
Summary report of investigations by VTI and A33 in
Sweden sponsored by the Swedish National Road
Administration
'1
Author
Olle Nordstrom
Research division Road Maintenance and Operations
Project number
80294
Project name
Summary report, brake testing
Sponsor
Swedish National Road
Administration
Distribution
Free
Swedish National Road and
Feasibility of using roller brake testers instead
of road tests for heavy vehicles
Summary report of investigations carried out by VTI and A88 sponsored by the
Swedish National Road Administration
by Olle Nordstriim
Swedish National Road and Transport Research Institute
Contents
Summary ... ..
I
1 Introduction ... .. 1
2 Aim ... ..
1
3 Project part 1 and 2. Investigations carried out by VTI ... .. 1
3.1 Test objects ... ..
1
3.2 Test vehicles ... .. 3
3.3 Test sites... .. 3
3.4 Mobile and stationary roller brake tester correlation ... .. 3
3.4.1 Test procedure ... .. 3 3.4.2 Data analysis ... .. 3 3.4.3 Results ... .. 4
3.4.3.1 General ... ..
4
3.4.3.2 Wheel load ... .. 4 3.4.3.3 Wheel diameter... .. 5 3.4.3.4 Tread depth ... .. 53.4.3.5 Tyre inflation pressure ... .. 5
3.4.3.6 Rolling resistance ... .. 5
3.5 Roller brake tester versus braking stop test on the road ... .. 6
3.5.1 Test procedure... .. 6
3.5.2 Evaluation of methods for calculation of maximum deceleration ... .. 7
3.5.3 Results ... .. 8
3.5.4 General considerations concerning the heavy vehicle inspection
test procedure ... .. 1 1 3.6 Proposal for a revised brake inspection test procedure ... .. 123.7 Summary of VTI investigations ... ..
14
4 Project part 3. Investigations carried out by ASB ... .. 14
4.1 Test vehicles... .. 14 4.2 Test sites ... .. 14 4.3 Test equipment ... .. 15 4.4 Test program ... .. 15
4.5 Calculation formulas... .. 15
4.6 Results ... .. 164.6.1 Tests in unladen condition ... .. 16
4.6.1.1 Comparison with A38 and VTI formula ... ..,,, 16
4.6.2 Tests with unladen vehicle and load simulation ... .. 16
4.6.2.1 Comparison with A88 and VTI formula ... .. 16
4.6.2.2 Comparison with CITA and VTI formula ... . ... ..
16
4.6.3 Tests in laden condition ... .. 16
4.6.3.1 Comparison with A88 and VTI formula ... .. 16
4.6.3.2 Comparison with Danish formula and VTI formula ... .. 17
4.6.3.3 Comparison with German formula and VTI formula ... ..17
4.6.3.4 Comparison with ASB two point formula and VTI formula ... ..17
4.6.4 Tests before and after brake renovation ... .. 17
4.6.5 Repeatibility ... .. 17
4.7 Conclusions and discussion ... ..
17
5 Project Part 4. Proposal by VTI for development of a new type of roller
brake tester... .. 1 8
5.1 Background ... .. 18
5.2 Aim ... ..
18
5.3 Method ... .. 19
5.4 VTI proposal for a new type of roller brake tester ... .. 19
6 Literature ... .. 22
Annex 1. Examples of existing international calculation methods for
evaluating roller brake tester results ... ..23Annex 2. Results from ASB roller brake tester investigation ... .. 25
Feasibility of using roller brake testers instead of road tests
for heavy vehicles
Summary report of investigations carried out by VTI and A88 sponsored by the
Swedish National Road Administration
by
Olle Nordstrom
Swedish National Road and Transport Research Institute (VTI) SE-981 95 Linkoping, Sweden
Summary
The conclusions of this report are that in order to replace brake tests on the road with an equally reliable roller brake test procedure present low speed roller brake testers are not sufficient. Stationary and portable low speed devices were found to give similar results. A high speed roller tester is proposed as a possible solution. In order to raise the test quality it is also proposed that inspections should also include tests both unladen and laden by means of load and unload simulation devices as well as response time measurements and axle brake
force distribution checks.
The background to the investigations is that brake tests on the road are getting more and more difficult to perform due to increased traffic density and are therefore not very often carried out by the police when heavy vehicles are inspected on the road. At the same time the
Swedish National Road Administration (SNRA) finds it desirable to increase the number of
brake tests of heavy vehicles in traffic. One of the reasons being that the percentage of heavy vehicles with defective brakes at the annual inspection by the Swedish Motor Vehicle Inspection Company (ASB) is relatively high.
The use of roller brake testers at the roadside stationary or mobile - is regarded as a
possibility of solving the testing problems. As a first step in establishing such a test procedure, the National Swedish Road and Transport Research Institute (VTI) was assigned by the SNRA to carry out an investigation divided in two parts, the first being research on the correlation between two types of roller brake testers, one stationary as used by the annual inspection and a mobile device with smaller rollers and lower testing speed.
The second part comprised experimental research, literature search and theoretical analysis for the development of an improved test procedure for the use of roller brake testers in order to get results as far as possible equal to the results of braking tests on the road and also taking more factors into account than has till now been the case at the annual inspection by the ASB.
The first part was carried out with a prototype mobile roller tester with roller diameter of 148 mm and test speed 0.8 km/h in comparison with two stationary roller testers with a roller diameter of 260 mm and a test speed of 2,5 km/h. Different types of heavy vehicles were used with varying axle loads from 10 kN to about 125 kN with tyres of varying diameter, tread, and inflation pressure.
The results showed that the devices give very similar results. The mobile device gave about 3 to 4% higher values, a difference so small that it is questionable whether a correction factor
should be used. The rolling resistance on the two types of testers was of equal magnitude
and proportional to the vertical load i. e. the rolling resistance coefficient was constant and typically about 3% of the load .
The second part of the investigation was carried out by VTI in co operation with the traffic police and consisted of comparative brake testing of heavy vehicles on the road and on stationary and mobile roller brake testers on four sites in different parts of Sweden. A total
number of 160 vehicles were tested, 58 Scania trucks, 48 Volvo trucks, 6 other trucks and
48 trailers.
The road tests were performed from about 50 km/h to full stop using electronic accelerometer, a pressure gauge and pedal force transducer. All data were recorded on a PC and processed to give mean fully developed deceleration at the actually used air pressure and the deceleration predicted at maximum air pressure. On the roller testers rolling resistance, initial brake application pressure, air pressure and braking force at wheel lockup limit as well as axle weight was measured. Additionally the axles were weighed on scales normally used by the police.
Compared to the road tests, the roller brake tester results - using the calculation method of
the Swedish Motor Vehicle Inspection Company(ASB) give as an average 30 % higher values for the Scania trucks, 38 % higher values for the Volvo trucks, 46% higher for the other trucks and 81 % higher for the trailers.
Alternative calculation methods taking initial brake application pressure and rolling resistance into account showed even higher values.
Better and more equal results for the different vehicle groups were obtained by a formula considering only the rolling resistance. A simple reduction factor of 0.9 on the present motor vehicle formula which is used in Norway also for trailers gave the next best improvement giving from 16% to 31% too high values. The equalising effect of the formula considering rolling resistance was apparent only for the trailers and the Scania trucks which all have S
cam brakes, but as these are frequent vehicles in Sweden this calculation method is
recommended.
Furthermore the investigation comprises an analysis of what factors that are desirable to check besides the mean fully developed deceleration. As a result of this analysis it is recommended to also include checking the maximum available glad hand pressure at cut in pressure of the compressor, load sensing valve function check at kerb weight and maximum weight by means of load simulation with a hydraulic or electric device attached between chassis and ground. For an efficient testing without risking vehicle damage it is proposed that it should be mandatory with suitable standardised attachment points on the chassis of heavy vehicles, Furthermore it is proposed that brake application and release delay times shall be measured and also that the proper brake force distribution between axles is checked against the manufacturer s specification. Brake temperature measurement as a quick check of the need of a more thorough brake check is regarded as promising but its possibilities and limitations need further study.
A third part of the investigation was carried out by ASB and contained supplementary tests with a more limited number of vehicles. One EWJ roller brake tester of the type used by ASB was used with two improvements, one being a computer program for calculating test results
as average values over one wheel revolution and the other a load simulation device. The test vehicles were 9 relatively new three axle sernitrailers and 4 trucks of which one was quite new with disc brakes and electronic braking system.
The test program started with three roller brake tests for each vehicle. One with the vehicle unladen, one with load simulation and one fully laden. These tests were followed by four road tests with a fully laden vehicle and finally further three roller brake tests like the initial tests
were carried out on the roller brake tester.
Different calculation formulas were used for evaluating the roller brake tests including the formula proposed by VTI in the second part of the investigation.
The conclusion of this part of the investigation was similar to that of the second. It was found that it is difficult to predict road test results with highreliability by means of a low speed roller tester. The in uence of speed was suggested as an explanation.
A test before and after brake renovation in two steps demonstrated that improved performance on the roller brake tester was not achieved by the renovation until the brake linings were turned to fit the brake drums. At the road tests the results improved significantly after the first renovation and was unaffected by the second step.
Calculation formulas considering rolling resistance as the one proposed by VTI showed less difference to the road test results than the formulas now used by ASB. A new formula proposed by ASB using two values during the braking test gave results equivalent to the VTI formula. A Danish and a German formula including a theoretical starting pressure were also better than the ASB formula but not superior to the VTI formula and had a higher tendency to underestimate the road performance.
The repeatability of the roller brake tests for the same vehicle was within 21% difference for all trailer tests. For the trucks the difference in unladen condition was up to 25% and in laden condition up to 20 %.
A fourth part of the investigation was to investigate the possibility of developing a high speed roller brake tester to a reasonable cost.
The reason for this step was the conclusion of the first three parts of the investigation that present low speed roller testers do not reproduce road test results with sufficient reliability for the aim to raise the performance test quality without sacrificing legal safety for the vehicle
OWIICT.
The proposed solution is a high speed single axle roller brake tester based on the inertia dynamometer principle reproducing two axle loads, 10 000 kg and 3500 kg. Brake tests from speeds up to 80 km/h will be possible. The tester will be equipped for load simulation and response time measurements. The device has single rollers and the diameter is proposed to be
1,6 m.
1 Introduction
Brake tests on the road are getting more and more difficult to perform due to increased traffic density and are therefore not very often carried out by the police when heavy vehicles are
inspected on the road. At the same time the Swedish National Road Administration (SNRA)
finds it desirable to increase the number of brake tests of heavy vehicles in traffic. One of the reasons being that the percentage of heavy vehicles with defective brakes at the annual inspection is relatively high. The use of roller brake testers at the roadside, stationary or mobile is regarded as a possibility of solving the testing problems. The correlation of roller brake tester results to road tests has however been questioned especially for small rollers and low test speed. SNRA has therefore initiated and sponsored an investigation on the feasibility of using roller brake testers instead of road tests with sufficient quality and legal security. The investigation has been divided in four part projects. Part 1, 2, and 4 was carried out by the Swedish National Road and Traffic Research Institute(VTI) and part 3 by the Swedish Motor Vehicle Inspection Company (ASB).
2 Aim
The aim of the investigation was to improve the inspection procedures for heavy vehicle brakes on road side by the police and at periodical inspection.
The aim of part 1 of the project was to study the compatibility of stationary brake testers normally used for periodic inspection with a mobile roller brake tester with lower test speed and smaller roller diameter intended for use by the police.
The aim of Part 2 of the project was to compare roller tester results with results from braking stop tests on ordinary roads with the aim of as far as possible replacing tests on the road with valid roller brake tests. The in uence of different parameters such as wheel load, tyre dimensions tread depth and inflation pressure should be clarified. Calculation methods for extrapolating brake forces measured on roller tester to maximum deceleration performance should be investigated in order to if possible improve the present method. Also a general analysis of the inspection procedure should be carried out and improvements be proposed. The aim of part 3 and 3b of the project was to make some further investigation concerning the correlation between roller brake tester and road tests considering different evaluation formulas and improvement of existing EWM roller test equipment at ASB in terms of using mean force over one revolution instead of momentary values (the BM equipment used in the VTI studies already used a similar mean value) and increasing the axle load of unladen vehicles by means of a strap around the tested axle. Furthermore to demonstrate the effect of brake renovation and investigate possible differences in results from vehicles with drum and disc
brakes.
The aim of part 4 was to develop a new more reliable test technique sufficiently equivalent with a road brake test to be regarded as legally safe and at the same time minimising the risk of approving vehicles with performance less than required in a road test.
3 Project Part 1 and 2. Investigations carried out by VTI
3.1 Test objects
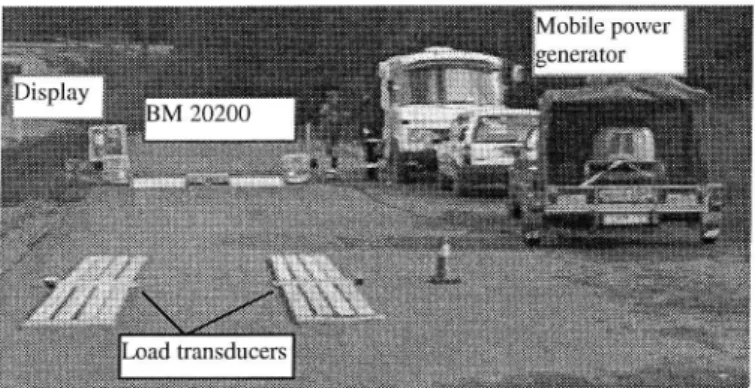
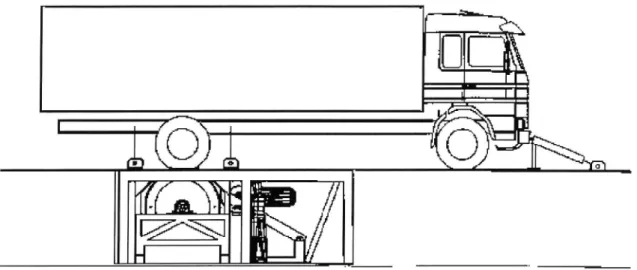
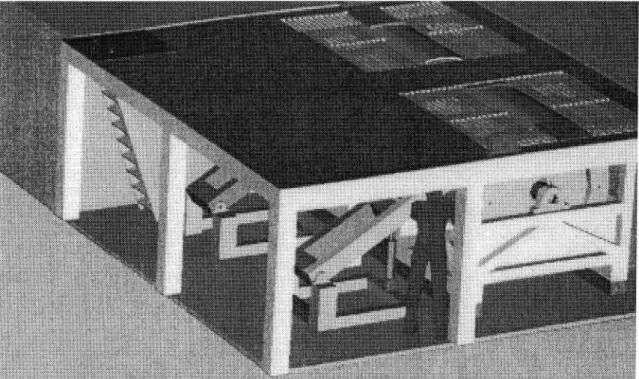
1) Mobile brake tester BM20200 from BM Autoteknik, Denmark with test speed 0,8 km/h and roller diameter of 148 mm. The device is shown in Figure l.
Figure 4. Control pressure transducer
2) Stationary roller brake tester BMl7200 from BM Autoteknik , Denmark with test speed 2,5 km/h and a roller diameter of 260 mm.
3) Stationary roller brake tester from EWJ, Denmark with test speed 2,5 km/h and a roller diameter of 260 mm.
3.2 Test vehicles
8 heavy trucks one light utility vehicle and 2 heavy trailers were used for the correlation study between the mobile and the stationary roller brake testers.
For the comparison between the roller brake testers and braking stop tests on ordinary roads the 8 vehicles mentioned before and further 112 heavy trucks and 48 heavy trailers were used taken directly from the traffic ow to stationary and mobile roadside test equipment.
3.3 Test sites
The correlation tests between stationary and mobile roller brake testers were carried out in Linkbping at ASB and at Volvo Hallered test track in Sweden and in Aalborg, Denmark at the Aalborg Technical School.
Four different test sites were used for road side testing. 1. Test site Armsjo'n near Sundsvall in northern Sweden:
_ Stationary Roller brake tester BM 17200.
2. Test site Linkoping mid south of Sweden :Mobile roller brake tester BM 20200. 3. Test site Jonkoping mid south of Sweden: Mobile roller brake tester BM20200. 4. Test site Viared near Boras south western Sweden:
Stationary Roller brake tester BM 17200.
3.4 Mobile and stationary roller brake tester correlation
3.4.1 Test procedure
The tests for comparing the roller brake testers were carried out according to the test schedule ABBAABBA for each vehicle where A is the mobile tester and B a stationary tester. At the tests with the BM testers rolling resistance was initially recorded, next ovality and at last the maximum braking force and corresponding reference air pressure at the coupling head or in the front axle circuit. The measurements with the EWG were similar except that the rolling resistance could not be recorded. The brake forces were recorded individually for each wheel of a vehicle. Axle loads, tyre diameters, tread depths and in ation pressure were varied.
3.4.2 Data analysis
The measured braking force was extrapolated to a common reference pressure 0,65 MPa by multiplying the measured braking force with the reference pressure and dividing it with the measured pressure. For the small utility vehicle that had hydraulic brakes the pedal force was used instead of the air pressure and the reference pedal force was set to 400 N. The mean value of the 4 recorded values for each wheel was calculated and used in the comparison. Statistical data analysis was carried out as simple and multiple regression with the ratio M/S between the mean values of the braking forces of the mobile tester M and the stationary testers S as dependent and wheel load wheel diameter air pressure and tread depth as independent
variables
3.4.3 Results
3.4.3.1 General
The result of the multiple regression of the normalized test data values was that no variable had the level of significance of 0,05 required for use in the model. Thus according to this analysis the ratio M/S can be regarded as a constant with the value 1,042 independent of the tested variables. In other words the mobile tester gives 4 % larger values than the stationary testers. A simpler Excel regression shown in figure 5 gave a difference of about 3 %.
E 50
£
CD ,9 o / IE 40 h. a} +1 -|-I 30 .3
.
o E l a 20E
o
2 Linear regression line
5 1"
y=0,9684x_
a: R2=0,9433.2
r
(UI
a-I D m D 10 20 30 40 50Mobile roller brake tester force(kN).
Figure 5. Correlation study of stationary and mobile roller brake testers
3.4.3.2 Wheel load
Wheel load (P) between 4,66 and 63 kN were used at the tests. Linear regression gives M/S =
1,028 + 0,0003P. The 95% confidence interval for M/S is between 1,0799+0,0018P and
0,9767 - 0,0011P. As said before the P-term is not significantly separated from zero. The results are shown graphically in figure 6.
Figure 5 shows the forces measured with S as function of corresponding M-values. Figure 6
shows M/S as function of wheel load.
1,50 [ . I
.. .
a-
s
E. 1:00 '
1 _
Q
I
g
o
5 Regression line MIS=1,028+0,0003P
3E
upper195%:
ms: 1,0799+0,0018C}P
m . 7;} 0,50 _____lower95%: MlS=O,9767-0,00114P .D O 20,00
;
0,0 20,0 40,0 60,0 80,0 Wheel load P(kN}Figare 6. Correlation between stationary(S) and mobile (M) roller brake testers. Ratio M/S as function of wheel load
3.4.3.3 Wheel diameter
The wheel diameters varied between 0,74 m and 1,09 m. N0 significant in uence on the force ratio M/S could be shown.
3.4.3.4 Tread depth
The tyres had tread depths between 3 and 15 mm. No significant in uence of the tread depth
on the force ratio M/S could be shown.
3.4.3.5 Tyre inflation pressure
The smallest tyre with the lowest in ation pressure tested on the smallest roller diameter was considered to be the worst case based on the justification that the relative change in radius would be largest for a small tyre and that at low pressure a certain absolute pressure change will cause a larger relative deformation in the rolling contact area. The pressure range was from 100 to 350 kPa: larger range was regarded as unrealistic.
The wheel size was 235/70 R15 M+S with a wheel diameter of 0,74m, a tread depth of 5 mm and a wheel load of 4,66 kN.
The test result was that between 200 and 350 kPA no in uence of the pressure on the measured braking force could be observed. At 100 kPa there was a slight increase. The conclusion is that within normal variation ranges of in ation pressure no correction of the braking force is needed due to these variations.
3.4.3.6 Rolling resistance
The average rolling resistance coefficient was 5% higher for the mobile tester compared to the stationary testers independent of wheel load as shown in figure 8. The difference has no significant in uence on the ratio M/S.
The rolling resistance force increased linearly with load i. e. the rolling resistance coefficient was constant and the average value was about 3%.
3.5 Roller brake tester versus braking stop test on the road 3.5.1 Test procedure
The braking stop tests were performed from initial speeds between 50 and 60 km/h at least two times V1 and V2 for each vehicle. In the second test V2 the deceleration was higher. In the case of a vehicle combinations two tests were made first with both vehicles braked and then two tests with only the towing vehicle braked. By means of calculation the performance of each vehicle could be evaluated.
Mm + MI am : aCln . H Mm F; : (ac(m+t) _ acm) . (Mm +
E
at = ' MIam = mean fully developed deceleration of the motor vehicle alone(m/ $2)
at = mean fully developed deceleration of the trailer alone(m/ s2)
cm 2 mean fully developed deceleration of the combination braked by the motor vehicle
only (m/ s2)
cram/H) = mean fully developed deceleration of the combination braked by the motor vehicle and
the trailer(m/ s2)
Figure 7. Deeelerution measurement equipment
The deceleration was measured with a vehicle fixed accelerometer mounted on the windscreen of the cab of the motor vehicle. To compensate for vehicle pitch, the integrated signal from a rate gyro was used. The brake pressure at the coupling head or at the most convenient pressure output connector and pedal force was also measured.
The measurements were recorded on a PC and the mean fully developed deceleration was calculated according to the Swedish SMS Standard 2982 and the corresponding mean pressure were calculated by means of a computer program developed at VTI. The SMS 2982 defines the mean fully developed deceleration as the mean deceleration over time in the time interval
from 0,3 T to 0,9 T, where T is the time from the beginning of a rapid brake application to the
time when the deceleration has dropped to zero the first time at the end of the stop. It is also required that the deceleration in this time interval does not vary more than 25% of the mean
value. At present the police most commonly uses a pendulum based direct reading
decelerometer with a maximum indicator. Compared to the SMS standard method the police instrument will tend to give somewhat higher deceleration values.
3.5.2 Evaluation of methods for calculation of maximum deceleration
In Europe several calculation methods exist with more or less complex structure for the calculation of the braking force(Fmax) at maximum control pressure (pmax). These are presented in annex 1.
The formula used in Sweden and Norway is the simplest and only uses measured brake force (F) and corresponding brake pressure (p) without correction factor for motor vehicles and with
the correction factor 1,25 for trailers. In Norway the correction factor 0,9 is used for all
vehicles. (The factor = 0,9 has later been omitted due too high percentage of complaints) a) Sweden, Motor vehicles: Fmax = F*pmax/p
b) Sweden, Trailers: Fmax =1,25 (F*pmax/p)
c) Norway , all vehicles: Fmax = 0,9 (Bpmax/p) (Now changed to be like a) )
The formula for maximum deceleration based on the Swedish formula a) used by ASB has been named R1 in the correlation study between road test and roller brake test and a corresponding formula based the Norwegian calculation c) has been named R4.
The international technical control association CITA recommends a formula considering the rolling resistance which was originally proposed by ASB: Fmax = l,05(F-Fr)pmax/p. Compared to the previous formulas there is a significant difference in that the rolling
resistance (Fr) is subtracted from the braking force(F), which means that the calculated
maximum force is reduced. For motor vehicles the reductions is reduced by the factor 1,05 which however is smaller than the one used in Sweden for trailers.
In the investigations made by VTI the rolling resistance has been around 3% of the wheel load, i.e. for a 10 ton axle about 3 kN. The effect is evidently greater if the braking force is low compared to the rolling resistance. On the road the rolling resistance for non driven wheels is about 1% and for driven wheels 1,5%. As the rolling resistance contributes to the braking performance it is justified to add a realistic braking force value to the value calculated by subtracting the rolling resistance on the roller brake tester. This value could replace the
factor 1,05.
A new formula(R2) is therefore proposed as follows: rmax = (F Fr)*pmax/ (ptm) + 0,125
rmax = maximum deceleration
F: measured braking force Fr 2 measured rolling resistance
p = measured control pressure, pmax lower limit for max control pressure
m 2 vehicle mass
In this formula the CITA formula has been modified by replacing the factor 1,05 by 1
and adding 0,125 representing the effect of a theoretical rolling resistance based on the mean value for a driven and a non driven axle according to ECE/EEC
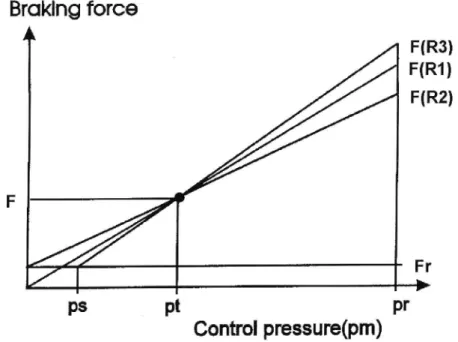
Theoretically the formula should use the starting pressure for the brake force build up as starting point for the linear extrapolation and not from the pressure zero. In certain countries formulas are used in which theoretical or measured starting pressure is used. In this investigation a formula R3 has therefore also been studied. This is the formula R2 modified by that the starting pressure calculated by the roller brake tester is subtracted from both the reference pressure and the actual maximum pressure during the test. In Figure 8 the principal
differences between the formulas R1, R2 and R3 are demonstrated.
Any error in the measured braking force will be amplified by the extrapolation and the amplification increases with the amount of extrapolation. From that point of view the measured force should be as high as possible. When the actual braking force pressure ratio is non linear as shown in figure 9 the error in the predicted value could actually increase with increasing measured force depending on the formula used. The only safe solution is to measure at the maximum pressure or up to the minimum required braking force. Figure 9 also illustrates that correcting for rolling resistance can introduce a false reduction if the brake is dragging significantly. As the braking force pressure curve is unknown this error can make the prediction worse or better. As the predicted results in average are optimistic moderate drag will improve the prediction.
3.5.3 Results
The results from the first set of tests made in Linkoping and Aalborg showed that the road test results with 95 % confidence were 80 +/ 15 % of those from the mobile roller brake tester using the simple linear normalisation based on brake pressure only used for motor vehicles by ASB in Sweden. This can also be expressed as that the ratio Rl/V2 between roller
brake tester results and road test results is 1,25.
The results from the second test series are shown in Table 1 and 2. With the same calculation as in test series 1, the mean ratio between roller brake tester and road test results R1/ V2 was 1,35 for the trailers, 1,29 for the Scania trucks and 1,36 for the Volvo trucks and 1,46 for
trucks of other types. With the formula R2 considering that the rolling resistance is higher on
the roller tester the ratio decreased to 1,27 for the trailers, 1,19 for the Scanias, 1,26 for the Volvos and 1,32 for other trucks.
Tables 1 and 2 and diagrams 1 6 show that the formula R2 and R4 are closest to the road test results and in general give very similar results.
Brakan force
i
F(R3)
F(R1)
F(R2)
yp5
. Pt
Pr
[:1
Control pressure(pm)
Figure 8. Three di erent calculation methods that have been compared to the road test
results . F= measured braking force, ps 2 starting pressure , pt 2 measured pressure, pr 2 reference pressure(max. control pressure). F(R1), F032) and F(RS) are calculated brake forces according to method R1, R2 and R3. Fr. = rolling resistance force.
Braking force
Control pressure
Figure 9. Illustration of the sensitivity of the calculated braking force according to formula R2 to the size of the braking force and of a dragging brake.
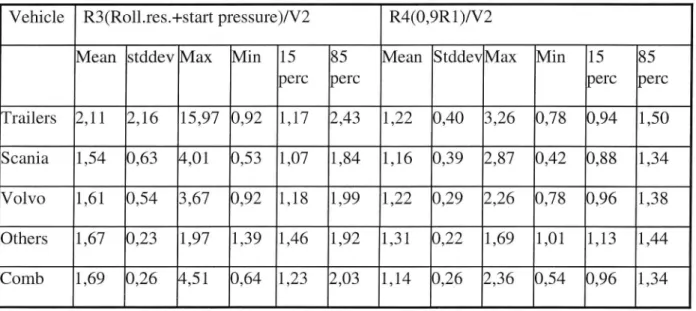
In table 2 results using the formulas R3 and R4 are shown. It can be seen that in this case the difference from the road tests was considerably greater than for the simpler methods R1, R2 and R4. In the tables 1 and 2 also the 15 and 85 percentile of the same data are shown. The 15
percentile for R2/ V2 lies between 0,98 and 1,10 and the 85 percentile between 1,37 and 1,61.
For the Norwegian formula R4 the 15 and 85 percentile values of R4/V2 are between 0,88
and 1,13 and between 1,34 and 1,50.
Table 3 and 4 show the effect of using different correction factors on the proposed formula R2 compared to the road test results on the percentage of the vehicles in the investigation that would be prohibited from being driven immediately ( evaluation code 3 because the calculated maximum deceleration is below 3 m/sz) and that would have had to come back for repeated inspection within a month ( evaluation code 2 because the deceleration figure was below 4,5
m/sz)
Table 1. Relation between deceleration from roller brake tester calculated with di erent
formulas(R1 and R2 )and road test(V2),normalized to same reference pressure 0,65 Mpa
Vehicle R1(ASB, motor veh.)/V2 R2(modified CITA formula)/V2
Mean stddev Max Min 15 85 Mean Stdde Max Min 15 85
perc. perc. v perc. perc.
Trailers 1,35 0,45 3,62 0,86 1,05 1,67 1,27 0,42 3,34 0,82 0,98 1,61
Scania 1,29 0,43 3,19 0,47 0,98 1,49 1,19 0,38 2,81 0,42 0,92 1,37
Volvo 1,36 0,33 2,51 0,86 1,06 1,53 1,26 0,30 2,28 0,82 1,01 1,39
Others 1,46 0,25 1,87 1,12 1,26 1,60 1,32 0,24 1,66 1,05 1,10 1,57
Comb 1,24 0,29 2,62 0,60 1,06 1,49 1,19 0,26 2,34 0,53 0,99 1,41
Table 2. Relation between deceleration from roller brake tester calculated with di erent formulas(R3 and R4 )and road test(V2),normalized to same reference pressure 0,65 Mpa
Vehicle R3 (Roll.res.+start pressure)/V2 R4(0,9R1)/V2
Mean stddev Max Min 15 85 Mean StddevMax Min 15 85
perc perc perc perc
Trailers 2,11 2,16 15,97 0,92 1,17 2,43 1,22 0,40 3,26 0,78 0,94 1,50 Scania 1,54 0,63 4,01 0,53 1,07 1,84 1,16 0,39 2,87 0,42 0,88 1,34 Volvo 1,61 0,54 3,67 0,92 1,18 1,99 1,22 0,29 2,26 0,78 0,96 1,38 Others 1,67 0,23 1,97 1,39 1,46 1,92 1,31 0,22 1,69 1,01 1,13 1,44 Comb 1,69 0,26 4,51 0,64 1,23 2,03 1,14 0,26 2,36 0,54 0,96 1,34
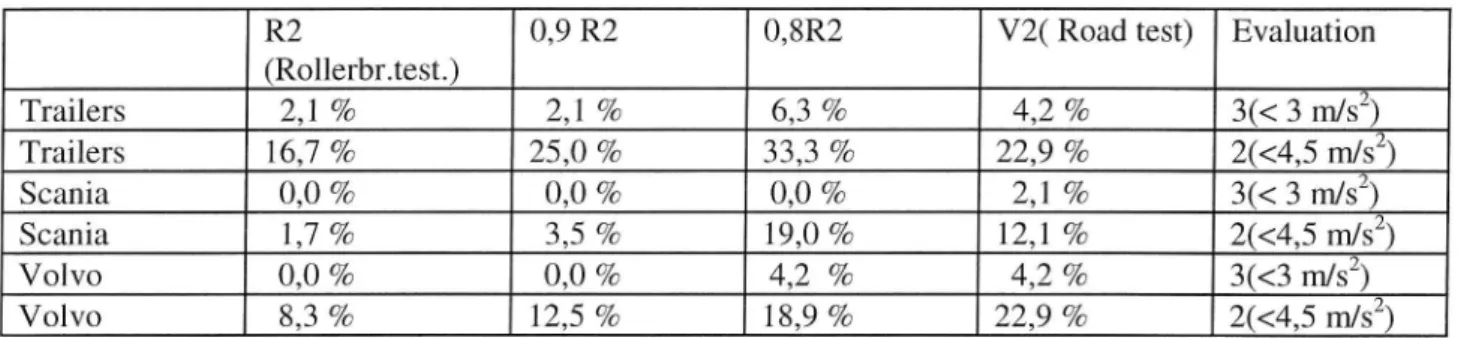
From the tables 3 and 4 and diagrams 7 10 can be seen that for the trailers the formula 0,9 R2
is closest to the road test results and for the trucks the formula 0,8 R2. The formula 3 gave the
most optimistic values compared with the road test results in spite of its theoretical advantages. This finding agrees with a similar investigation by Karlsen in Norway 1992. As a first cautious revision the formula R2 is proposed with the Norwegian formula R4 as an alternative on older equipment where rolling resistance cannot be measured.
Table 3. Comparison of results from road tests with roller brake tests with di erent
evaluation calculation formulas. Calculation weight is as tested.
R2 0,9 R2 0,8R2 V2( Road test) Evaluation
(Rollerbr.test.)
Trailers
2,1 %
2,1 %
6,3 %
4,2 %
3(< 3 m/sz)
Trailers
16,7 %
25,0 %
33,3 %
22,9 %
2(<4,5 iii/s2)
Scania
0,0 %
0,0 %
0,0 %
2,1 %
3(< 3 m/sz)
Scania
1,7 %
3,5 %
19,0 %
12,1 %
2(<4,5 m/sz)
Volvo
0,0 %
0,0 %
4,2 %
4,2 %
3(<3 m/sZ)
Volvo
8,3 %
12,5 %
18,9 %
22,9 %
2(<4,5 m/Sz)
Table 4. Comparison of results from road tests with roller brake tests with di erent evaluation calculation formulas. Calculation weight is maximum legal gross weight.
Rt2 0,9 Rt2 0,8Rt2 Vt2( Road test) Evaluation (Rollerbr.test.)
Trailers
27, 1 %
33,3 %
41,7 %
35,4 %
3(< 3,0 m/sz)
Trailers
62, 5 %
72,9 %
83,3 %
72,9 %
2(< 4,5 m/sz)
Scania
0,0 %
0,0 %
1,7 %
6,9 %
3(< 3,0 m/sz)
Scania
3,5 %
15,5 %
36,1 %
27,6 %
2(< 4,5 m/sz)
Volvo
21 %
6,3 %
14,6 %
10.4 %
3(< 3,0 m/SZ)
Volvo
22,9 %
33,3 %
54,2 %
52,1 %
2(< 4,5 m/sz)
3.5.4 General considerations concerning the heavy vehicle inspection test
procedure
The road side test procedure involves many operations and consequently possibility for errors . A test team of two persons turned out to be too small to cope with all that had to be handled . A third man from the police for taking in the vehicles, take care of the driver and write police reports was needed.
The testing was easier to perform with the stationary type of test equipment and quicker due to the higher roller speed. For both types the large mobile display was not ideal for outdoor work due to sun glare and exposure to wind and rain. Also the cables for the pressure sensors were vulnerable. Registration of vehicle data should be automated by electronic techniques such as smart cards. The display should be integrated inthe handhold control used in the vehicle by the test driver and data transmission should be wireless.
In order to be able to test the vehicle in both laden and unladen condition and check the function
of load sensing devices it is desirable that future vehicles are equipped with standardised attachment points on the frame that allows the use of efficient strap down and lift devices.
At present the brake system response times at brake application and release are not checked and the calculation of the deceleration does not consider the brake force distribution although these functions are important for evaluating the total stopping performance of the vehicle or vehicle combination. The maximum pressure at the coupling head should also be checked. Pressure transducer connectors other than at the coupling head should be easier to reach and protected from dirt.
The reliability of the results from an individual roller brake test is not regarded as satisfactory from a legal security point of view. The low test speed compared to a road test is probably the
main reason.
3.6 Proposal for a revised brake inspection test procedure
Based on the experimental test results and theoretical considerations it is proposed
that the test procedure at a complete brake inspection at the road side or at periodical inspection shall comprise the following checks.
1. Maximum deceleration based on braking forces measured by a roller brake tester extrapolated from measured test pressure in the control line to lower limit of maximum
control pressure unladen and laden to maximum allowed gross weight using a new
calculation formula.
rmax = (F-Fr) pmax/ pm) + 0,125
rmax 2 maximum deceleration F: measured braking force Fr = measured rolling resistancep 2 measured control pressure, pmax = lower limit for max control pressure m = vehicle mass unladen and at max allowed Gross Weight
If the rolling resistance cannot be measured on older equipment the formula used in Norway
F = 0,9 F' pmax/ p may be used.
2. Brake force distribution between the axles for the two load cases .The distribution shall be based on the extrapolated forces at maximum braking pressure and be within the tolerances set by the manufacturer in order to fulfil the type approval requirements. For ABS equipped vehicles this could mean that the brake force distribution does not change with the load. 3. Brake force/ pressure adaptation to the EU corridors for brake force versus control
pressure laden and unladen. For ABS equipped vehicles without load sensing valves.
4. Checking of the lower limit for maximum control pressure at the coupling head with the vehicle stationary.
5. Checking of pressure rise time to 75% of maximum control pressure with the vehicle stationary at the coupling head of a motor vehicle or at the least favourable axle of a trailer. 6. Checking of brake force symmetry left-right for every axle at maximum measured brake
force the brake force shall be the mean over about one wheel revolution.
7. Checking of the pressure drop time from maximum to 10% of maximum pressure with the vehicle stationary.
8. Checking of the stroke of the brake cylinders at maximum pressure.
Diagram 1 Ratio RN2 between deceleration R calculated from Diagram 2_ Ratio RN2 between deceleration R calculated from
roller brake tester data with formulas (R1-R4) roller brake tester data with formulas (R1-R4)
and deceleration (V2) at road tests according and deceleration(V2) at road tests according
to SMS 2982. Average values. to SMS 2982. Standard deviation.
p or O R1N2average R2N2average
.. DRWZaverage I R4'V2average §
: ,_._ R1N2$tdev R2N2$tdev , 3 B3 Y25WPV .V r FB WZ-iide" .N N 0| l l O Jf .l t V . N.r 0| .5 0| d l ni b st anda rd de vi at lo r 23
i3f5;
-1 De ce le ra ti on ra tio ave rage va lue De ce le ra tl on ra tio. 9 o:Trailers Scania V°'V° 0" Tm? Trailers Scania Volvo other
Truck-l-Vehicle type Vehicle type Wk trailer
Diagram 4, Ratio RN2 between deceleration R calculated from roller brake tester data with formulas (R1-R4)
and deceleration(V2) at road tests according
to SMS 2982 . Minimum values.
Diagram 3. Ratio RN2 between deceleration R calculated from roller brake tester data with formulas(R1-R4)
and deceleration (V2) at road tests according to SMS 2982. Maximum values.
R1N2min
R2N2min
DR3N3ml," !,R4.'Y,2min H '
ul a k i n16
R1N2max Rzszax:
12
.::;'¥:23.;_i; El R3N2max I R4N2max
iDe ce lera ti on ra ti o P a l
0,4 m a xi m um va lue s m i n i m um va lue s Pm l . L . _ L _ 1 a t a b J _ L . _ De ce le ra tlon ra ti o
Trailers Scania V°'V° 00'" Tm Trailers Scania Volvo Other Truck+
Vehicle I truck traller vehicle tuck trailer
Ratio RN2 between deceleration R calculated from Diagram 6. Ratio RN2 between deceleration R calculated from
roller brake tester data with formulas (R1-R4) roller brake tester data with formulas (R1-R4)
and deceleration(V2) at road tests according and deceleration(V2) at road tests according
to SMS 2982 . 85 percentile values. to SMS 2982 . 15 percentile values.
1,6 Te R1N215perc R2N215perc .. l. t. ._ Diagram 5. R1N285perc R2N285perc F DR3N285perc lR4N285perc I" 01 N 1,5 « j Il l 1 O 4f t G De ce le ra ti on ra ti o, 85 pe rc en tile va lue s De ce le ratl on ra ti o, 15 pe rc en ti le value s Pon
Trailers Scania Volvo Other Truc k+ Trailers Scania Volvo Other Truck+
Vehicle type truck trailer Vehicle type truck trailer
Diagram 8. Percent vehicles with a deceleration
Diagram 7. Percent vehicles with deceleration 2
less than 3 mls at tested weight less than 4,5 mlszat tested weight
R2
0,9R2 f .
.123: El 0,8R2 I V2
D 0,8R2 I V2
R2
0,9R2
O -I N N U I U N
Trailers Scania Volvo
Vehicle type th an 3 ml ? at te sted we ig ht Pe rc en t ve hi cl es with de ce le ra ti on le ss th an 4, 5m/é at te st ed we ig ht
Parcel Ve'lldes With dGCEIGla Oll Diagram 10. Percent vehicles with deceleration
less than 4.5mls at legal maximum weight less than 3 mls-2at legal maximum weight
90 : reliefs. -,...;,..g 1;. has - 45 _ ,, so . Rt2 0,9th [ p _ th 0,9th _ _. ,. . DO,8Rt2 IVt2 .r
:.
D0,8Rt2 IVt2
E N n 3 3 tole ss th an 4, 5m ls at le ga l m a xim um we ig ht 3 we ig ht . 3 0| Pe rc ent ve hi cl es wi th de ce le ratl ol le ss th an 3 mlsz at le ga l ma xi mul
Trailers Scania Volvo
Vehicle type Pe rc ent ve hi cl es wi th de ce lera ti m
3.7 Summary of VTI investigations
_,
By means of experimental studies it has been shown that a mobile roller brake tester with smaller rollers and lower test speed than the commonly used stationary roller testers gives practically the same results.
A comprehensive correlation study between road tests and roller brake tests has shown that in average a roller brake tester with the present calculation methods used in Sweden gives too optimistic results compared to road tests measuring pitch compensated mean fully developed deceleration. With new calculation formulas the difference can be reduced. The variability in the ratio between the results of the two test types is however relatively high. Therefore a full compensation of the mean value to equalise the road test is not proposed at this time.
Improvements on the roller brake test equipment are proposed as well as on design changes on the vehicles to enable more efficient inspection of the complete braking system . More complete testing is proposed for the future by adding measurement of response times and checking proper brake force distribution between the axles both laden and unladen. For satisfactory
reliability and legal security the introduction of roller testers also reproducing the speed of a road test
is desirable.
4 Project Part 3. Investigations carried out by A33
The aim of was to determine the relation between calculated braking performance based on roller brake tester results and braking performance at road tests. Most of the roller brake tests were evaluated wit the ASB formula and the formula proposed by VTI but some comparisons were also carried out using a Danish and a German formula. The possibility of improving results by means of a Two point formula considering values at two different pressures in one test was also investigated.
The stability in braking performance of the tested vehicles at repeated roller brake tests at three different loads was observed and a comparison of braking performance of brakes with well run in brake linings and after renovation with new brake linings, new brake drums, cleaned and lubricated bearings and finally after the linings had been turned to fit the drums.
4.1 Test vehicles
The following vehicles were tested:
4 heavy trucks ( 3 Scania model year 1984 1989 with S cam drum brakes without load sensing valves and
1 Mercedes Actros with electronic braking system and disc brakes)
9 heavy semitrailers ( Registration year was from 1993 to 1997.All had triple axles and load sensing valves. One was equipped with disc brakes and the rest with S cam
drum brakes. 5 vehicles had BPW axles , 2 vehicles had ROR axles and 1 vehicle had SAF axles. The axles of the vehicle SM97 with disc brakes were from Mercedes). The trailer used for the brake renovation study (KRl) had BPW axles
4.2 Test sites
The roller brake tests were carried out at ASB test station at Valdemarsro in Malmo, Sweden
The road tests were carried out on Road 13 at Sjobo not so far from the test station.
4.3 Test equipment
The roller brake tests were carried out on an EWJ roller brake tester normally used for annual brakeinspections by ASB improved in terms of using mean force over one revolution instead of momentary values (the BM equipment used in the VTI studies already used a similar mean value) and increasing the axle load of unladen vehicles by means of a strap around the tested axle. Road tests were carried out using a Datron Correvit optical speed
sensor a pendulum type accelerometer and for some tests an electronic accelerometer
g-analyst (Valentine Research inc,USA). In addition the gladhand control pressure and one brake cylinder pressure
were measured at both test types. In accordance with ASB practice the brake cylinder pressure was used in the calculation formulas for extrapolation to maximum guaranteed pressure set to
0,6 MPa for the semitrailers and 0,7 to 1,0 MPa for the trucks.
This differs from the VTI tests where the gladhand pressure was used in the calculations and set to 0,65 MPa. For comparison between road test and roller brake test this is however of no in uence. During the road tests with semitrailers only the trailer brakes were used and the in uence of the towing vehicle and its rolling resistance was eliminated by calculation.
4.4 Test program
.
The semitrailers were first tested on the roller brake tester in three different load conditions,
then tested on the road in fully laden condition of 27000 kg triple axle load and then again on
the roller tester for each of the three load conditions. These conditions were: 1. Unladen
2. Unladen but with simulated load of 26 kN on each axle by means of a strap around the axle
attached to a winch.
3. Fully laden to 27000 kg
The semitrailer KRl used for investigating the in uence of brake renovation was not tested on the roller tester before the road test in non renovated condition and as the load simulator broke down before the tests after renovation 2 (turning of the brake linings) results from load condition 2 are missing. In the unladen condition after renovation 2 the vehicle was loaded with about 2000 kg in order to reach the desired minimum pressure 0,15 MPa. For the other trailers the maximum control pressure before wheel lock was in most cases just below this
value.
4.5 Calculation formulas
For calculating the deceleration at guaranteed pressure six different formulas were used. For details see Appendix 1 and chapter 3.6
1. The ASB motor vehicle formula (R1) 2. The ASB trailer formula (R1/0,8)
3. The VTI formula considering the higher rolling resistance on roller brake testers (R2) 4. The Formula used by Denmark considering a theoretical starting pressure of 0,04 MPa and
a pressure loss at brake application of 0,02 Mpa. (Appendix 1, formula 1))
5. A formula used in Germany considering actual starting pressure and rolling resistance (Appendix 1, formula 2))
6. A new formula proposed by ASB based on two brake force measurements , one at 0,15 MPa and one at a higher pressure, preferably above 0,3 MPa. The extrapolation to guaranteed pressure is made through these two points.
r max = Fbr'FO,l5)(pgar'pman)/(pman'p0,15) + 1:bryIn (In/52) Where
Fbl. = Braking force at pressure pman > 0,3 MPa
F0315 = Braking force at pressure po, 15 = 0,15 MPa
pgaf = Guaranteed pressure (Mpa)
pman 2 Pressure > 0,3 MPa
130,15 = 0,15 MP3
m = Guaranteed axle load (kg)
4.6 Results
4.6.1Tests in unladen condition
4.6.1.1 Comparisons with ASB and VTI formulas
For the trailers calculations according to ASB trailer formula overestimated up to 3,5 m/s2
and underestimated up to 0,9 m/s2 compared to the road tests. Underestimation occurred in 4 out of 19 tests. In the case of dics brakes the first test underestimated with about 0,5 m/s2 and
the second overestimated by about the same amount. Calculations according to the VTI
formula underestimated the disc brakes between 0,6 and 1,4 m/SZ. For all brakes the VTI formula overestimated up to 1,4 m/s2 and under estimated up to 1,8 m/sz. In 14 cases out of
19 the error is less than +/ 1 m/s2. The individual results are illustrated in Appendix 2, diagram 1,2,11 and 12.
For the trucks the ASB formula overestimates up to 2,25 m/s2 and underestimates up to
about 0,5 m/sz. In 7 cases out of 9 the difference from the road test is less than +/-1 m/32.
Underestimation occurs in 2 out of 9 cases. The VTI formula underestimates up to 0,4 and overestimates up to 1,75 m/sz. In 7 out of 9 cases the difference from the road test is less than
+/-1 m/s2. In case of the disc brakes both formulas overestimates relative to the road test, the ASB formula up to about 1,6 m/s2. and the VTI formula up to about 1,3 m/s2. The individual
results are illustrated in Appendix 2, diagram 11 and 12.
4.6.2 Tests with unladen vehicle and load simulation
4.6.2.1 Comparison with ASB and VTI formula
Calculations according to ASB trailer formula overestimated up to 6,2 m/s2 and underestimated slightly in 2 cases out of 17 compared to the road tests.
No disc brake tests were carried out in this conditions. The VTI formula overestimated up to
3,5 m/s2 and underestimated up to 1,2 III/s2. In 50% of the cases the error is less or equal to
+/ 1 m/sz. The individual results are illustrated in Appendix 2, diagram 3 and 4. 4.6.2.2 Comparison with CITA and VTI formula
The semitrailer tests reported in diagram 7 shows that the difference between the VTI and CITA formula results is small. The CITA values are slightly higher.
4.6.3 Tests in laden condition
4.6.3.1 Comparison with ASB and VTI formula
In the semitrailer tests calculations according to ASB trailer formula overestimated between
7,1m/s2 and 0,3 m/s2 compared to the road tests. Underestimation occurred none of 19 tests. In the case of dics brakes the first test overestimated with about 0,2 m/s2 and the second
overestimated by about 1 m/s2. Calculations according to the VTI formula underestimated the disc brakes between 0,6 and 1,4 m/sz. For all brakes the VTI formula overestimated up to
4 m/s2 and underestimated up to about 0,9 m/sz. In 13 cases out of 19 the error is less than
+/ 1 m/sz. The individual results are illustrated in Appendix 2, diagram 5, 6,13 and 14.
In the truck tests the ASB formula overestimates up to 2,5 m/s2 and underestimates once
about 0,5 m/sz. In 7 cases out of 12 the difference from the road test is less than +/-1 m/s2.
Underestimation occurs in 2 out of 12cases. The VTI formula underestimates up to 0,4 and
overestimates up to 1,75 m/sz. In 7 out of 12 cases the difference from the road test is less than +/-1 m/sz. In case of the disc brakes both formulas overestimates relative to the road test,
the ASB formula up to about 1,6 m/s2. and the VTI formula up to about 1,3 m/sz. The individual results are illustrated in Appendix 2, diagram 13 and 14.
4.6.3.2 Comparisons with Danish formula and VTI formula
Diagram 8 in Appendix 2 shows a comparison of roller brake results using VTI and a Danish formula that considers a theoretical starting pressure of 0,4 bar and a pressure loss due to the brake application . The Danish formula in all cases give lower values than the VTI formula and in most cases underestimates the road braking performance.
4.6.3.3 Comparison with German formula and VTI formula
In Appendix 2 diagram 9, semitrailer roller brake test results are compared with road tests using the German formula and the VTI formula. In all cases the results are overestimating the road braking performance. The largest overestimation is obtained by the German formula. 4.6.3. 4 Comparison with ASB two point formula and VTI formula
The results shown in Annex 2, diagram 10 show that the difference between the results from
the ASB two point formula and the VTI formula in most cases is quite small. Both formulas have draw backs if simplicity is desired. The ASB two point formula requires a laden vehicle and the VTI formula requires rolling resistance measurement.
4.6.4 Tests before and after brake renovation
The individual roller brake test results of the semitrailer KRl used for this test are shown in Annex 2, in diagram 1 and 2 for the unladen vehicle, in diagram 3 and 4 for the vehicle with load simulation and in diagram 5 and 6 for the fully laden vehicle. The results to the left are before renovation , those in the middle after changing linings and drums and cleaning and lubricating moving parts and the results to the right in the diagrams show the results after having turned the linings to fit the drums. It can be seen that in unladen condition the performance decreased after the first step of renovation but increased after the second. In the tests with load simulation the first step had no effect but the second showed a clear improvement. The indication from this test is that it is important to include turning of the linings to fit the drum in order to get a significant improvement in performance on the roller brake tester especially in unladen condition. The road test results which were all carried out fully laden were significantly improved already after the the first renovation but was unaffected by the turning of the linings to fit the drum.
4.6.5 Repeatability
Roller brake test results from the same vehicle do not differ more than 21 %. For the tested
trucks the variation was up to 25% in unladen and up to 20 % in laden condition. The
variation was the same at all the tested axle loads. 3
At the road tests the results varied at most 12% for the same vehicle.
4.7 Conclusions and discussion
It is difficult to predict braking performance on the road with high precision by means of low speed roller brake testers. It seems even difficult to with a high degree of confidence use low speed roller brake test results as a means of sorting out vehicles that do not fulfil the prescribed braking performance.
After a brake renovation with new brake linings not turned to fit the drum the brakes showed lower or at most equivalent performance compared to performance before the renovation. After turning the brake linings to fit the drum the performance of the brakes was significantly improved.
Calculation formulas considering rolling resistance showed in this investigation results closer to the road test results than the presently used ASB formula. Similarly good results were also obtained with a new formula proposed by ASB considering brake forces measured at 0,15 Map and braking forces at a higher pressure but not the rolling resistance. Formulas including the start pressure did not get results closer to the road tests than those including the rolling resistance. No significant differences between different axle types could be found. All axles had S cam drum brakes except one truck and one semitrailer which were equipped with disk brakes.
All tests were performed at relatively low brake temperature ( less than 100 de C). Therefore this investigation does not give any information on the in uence of brake temperature.
Roller brake test performance of brakes on the same drum braked semitrailer varied at most with 21 %. For the tested trucks the variation was up to 25% in unladen and up to 20 % in laden condition. This variation was the same at all the tested axle loads. At the road tests the results varied at most 12% for the same vehicle.
At roller brake tests in unladen condition with the truck the results were within +/- 1,0 m/s2
in 73% of the tests both with the VTI and the ASB formula . In laden condition the VTI
formula gave results within +/- 1,0 m/s2 in 86% of the tests and with the ASB formula 50%
were in the same range. A truck and a semitrailer with disc brakes were tested. the results did not differ from those with S cam drum brakes . The disc braked semitrailer was according to the type certificate capable to brake with at least 5,0 m/sz'. At the road test only 4,2 m/s2 was obtained. The disc brakes do not seem to give stable brake performance at roller brake tests either. This could be referred to the low test speed.
Probably it is not possible to solve the problem of the large variation in correlation factor between roller brake tests and road tests by establishing a new calculation formula. One explanation could be that the low test speed of 2 km/h does not reproduce the variability in braking performance at high speed well enough with the brake linings and brakes used at present.
5 Project Part 4. Proposal by VTI for development of a new
type of roller brake tester
5.1 Background
The investigations made by VTI and ASB show that the precision and validity of the test results from present roller brake testers with low test speed is not high enough. This probably is depending on the uncertainty of extrapolating performance of unladen vehicles to high speed and high energy input . This is deemed not to be satisfactory from traffic safety and legal point of view .
5.2 Aim
To develop a new more reliable test technique sufficiently equivalent with a road brake test to be regarded as legally safe and at the same time minimising the risk of approving vehicles with performance less than required in a road test.
5.3 Method
Construction of a test equipment allowing braking tests from the same speed that is prescribed for type approval ( 60 km/h) in both laden and unladen condition measuring fully developed mean deceleration at maximum pressure and response times according to ECE/ EU regulations for type approval.
5.4 VTI proposal for a new type of roller brake tester
For high speed braking tests much more power is needed but only for short time periods. The duration of a braking test from 60 km/h at 5 m/s2 takes less than 4 seconds. The time for accelerating to the test speed can be considerably longer. About one minute is deemed to be acceptable. Systems based on energy accumulation rather than powerful engines are therefore to be preferred.
The basic principle of a device based on energy accumulation proposed by VTI is a ywheel acting as road surface with aninertia corresponding to a fully laden axle (100 kN). The device that is illustrated in figure10, ll, 12 and 13 consists of two interconnected single ywheels for axlewise testing,
The ywheels are 1,6 m in diameter. The ywheels weigh 6500 kg each.
The total weight of the machine is 22500 kg.
Dimensions of the installation pit : Length 5 m, width 5 m ,1 depth 2 m.
Simulated vehicle mass: 3500 and 10000 kg ( Each ywheel(roller) consists of an outer and an inner ywheel which for maximum mass are locked together. For minimum mass only the outer ywheel is in action (See figure 13).
Propulsion system : Two 30 kW electric engines with force transmission via a gearbox and truck tyres pressed against the outer ywheels.
Maximum speed : 80 km/h
Electric or hydraulic devices for load simulation by means of pulling the frame downwards via supports at the spring attachments. For this purpose such supports of standardised shape and position should be required in future vehicle regulations.
Tethering of the vehicle longitudinally and laterally with a moveable trolley that can be locked in oormounted fasteners and in the nose coupling of the truck
The following measurements are to be carried out: ,
Measurement of speed and deceleration of the ywheels by means of optical wheel pulse sensors makes it possible to calculate total braking force when the wheel inertia is known Measurement of torque in the coupling between the two ywheels allows calculation of the difference in braking force from left and right brake.
Measurement of pressure in wheel cylinders and control pressure at the coupling head Measurement of pedal force.
Measurement of response time.
Data transfer of signals from the transducers are to be carried out by means of radio transmitters to a portable computer in the driver cabin. Wireless transmission of data to a printer for printing of test protocols is also foreseen.
Prototype development costs are estimated to 4,5 million SEK
Figure 10. High speed inertia roller brake tester design proposed by VTI. Side View.
u. .a .v. .u.
Figure 11. High speed inertia roller brake tester design proposed by VTI. View with oor removed.
VTI notat 84A 1998 2 1
ywheels with irmer drum
Figure 13 High speed ihertza roller brake tester desigri proposed by VTI. View of one of the
place.Figure 12. High speed inertia roller brake tester desigri proposed by VTI. View wi
thfl
6 LITERATURE
l. Karlsen P.: Requirements on braking efficiency and methods for testing brakes on roller brake testers. Report No 62/1992 Institute of Technology. Oslo, Norway , 1992.( In Norwegian)
2. Radlinski R.W.,Flick M. and Clark G.S.: Enhancing The Roller Brake Tester. SAE Paper 922444. International Truck and Bus Meeting and Exposition Toledo, Ohio November
1992.
3. Radlinski R.W., Flick M.and Clark G.S.: Enhancing The Roller Brake Tester. Paper C444/O40/93 in proceedings of conference on. Braking of Road Vehicles I. Mech. E.
1993.
4. Inspection manual. Periodic inspection of vehicles. Covers R Dir. 77/ l43/EOF, last updated
by K-dir. 94/23/EOF. National Road Administration, Norway. April 1996. (In Norwegian)
5. Shaffer S.J., Alexander G.H.: Evaluation of Performance- Based Brake Testing
Technologies. Interim Report No FHWA-MC 96-OO4 US DoT Federal Highway
Administration . December 1995
6. Rosengren J.: Heat measurement as method for selection at roadside vehicle inspection.
Report PM. National Road Administration in Sweden, Region Skane. 1996-06-12. (In Swedish)
7. Nordstrom 0., Mild R.: Comparative testing of roller brake testers. VTI Notat No 3 ~1996 (In
Swedish)
8. Nordstrom 0.: Determination of braking performance by means of roller brake testing. VTI
Notat No 58-1996 revised 1998 (In Swedish)
9. Johansson Annika: Comparison of deceleration at road tests and at roller brake tests. Part project 3. ASB Report l997.(In Swedish)
10. Johansson Annika: Comparison of deceleration at road tests and at roller brake tests. Part project 3b. ASB Report 1997 ( In Swedish)
Annex 1. Examples of existing international calculation
methods for evaluating roller brake tester results
Compilation of calculation methods for determination of braking performance for heavy vehicles from
roller brake tester results (Source AB Swedish Vehicle Inspection, Inspection and investigations).
Country Formula Example 1 2 3
F x (p f p - p ) X 0 90 F
1)Denmark F 1,:
re
re
(pm p0,)
p
t
R fz I Qf-
re
m
=4,9;5,1;5,3
F X (p
-p )
F
2) Germany (BSU) 2 ref 0t R = f = 5,6 ; 5,8 ; 6,1
ref (pm _ pm) ref m
(F F ) x p F
3) Germany (HU)
Fref =
r
ref
Rref = 49 f
2 5,7; 5,9; 6,1
(pm _ p0) In
F X P f
F
4) Sweden(Mot0r vehicle) Fref = A ; R _ ref = 5,2 ; 5,2; 5,2
pm ref _ In
F x p F
5) Sweden(Trai1er) F = A ; R = if = 6,5 ; 6,5; 6,5
ref p X 0 8 ref m
m 9
FX(Pref P0t)XO»833 . R =_Fref
=47-48°51
6) Switzerland Pref = , ref
(pm - 190,)
In
(F F )>< p x 1,05 F
7) CITA
F =
refr
pref
,
R = if-
ref m= 4,8 ; 4,9 ; 5,0
111
Symbol explanation Example
1 2 3
F = Measured brake force (kN) for complete vehicle, axle or wheel = 8,00; 10,00; 12,00
Fref = Calculated brake force (kN) at reference pressure pref for complete vehicle, axle or wheel
pref = Reference pressure (mPa) = 0,20; 0,25; 0,30
pp = Estimated pressure loss due to leakage (mPa) = 0,02; 0,02; 0,02
p O = Measured starting pressure(mPa) = 0,05; 0,05; 0,05
p0t = Theoretical starting pressure(mPa) = 0,04; 0,04; 0,04
Fr = Measured rolling resistance (kN) = 1,00; 1,00; 1,00
Rref = Deceleration at reference pressure (m/sz)
m = Vehicle mass (mass carried by axle or wheel) (ton) = 5,00; 5,00; 5,00
Annex 2. Results from ASB roller brake tester
investigation
Contents: Diagram 1-14
VTI notat 84A-1998
Annex 2
Annex 2
VTI notat 84A- 1 998 27 Semitrailer LEM LWS ZEN 28M 88M ZWS ZWS 8W8 88W LEM LEM LQM LQM 73M 78M LEM LEM D O a ec el er atio n m/ s2 -I ~ N / // // // / l/ // // // . / // // 7/// // // // // // // //// // // A
'l
7/// // // // / /// / 7/ // //// // // // /1 7/ // // // // 7/ // // // // // //// // // // // // // /A / / ///// // / / // // . / // // // // /I VTI - Road test
- Road Test
ASB
formulas
Diagram 2. Difference between roller brake tester results and road tests with unladen semitrailers for A88 and VTI
Semitrailer Dece le ra tion m/ s2 N w A U I C D N C I I C D 1O ZE N ZE N 88M I I / / / I I I I Z W S I I I / [ I ] ! ZI NS
8 W 8
({(
«q
wzz/
zwq
il
li
lI
8 W 8 LE M LEM LQM{l
aw/
«I
(«M
IM
I/
1M
LQX M ' {I / I f /I / I I I I / I I / Il l i / I I I I IASB
IVTI
El Road Testt
formulasDiagram 1. Comparison between roller brake tester results and road tests with unladen semitrailers for A38 and VTl
Annex 2
F
Diagram 3. Comparison between roller brake tester results
and road tests with semitrailers unladen + load simulation for ASB and VTl formulas
14 ASB IVTI g: El Road Test 1; E C .9 a
2.6
8 (D C)Diagram 4. Difference between roller brake tester results
and road tests with semitrailers unladen + load simulation for ASB and VTl formulas
ASB - Road Test oad Test De ce lera ti on m/ s2 -2 »
X X X X (I) (I) (I) (I) X X X X X
30 E 50 17 30 g g E Z N 27 O- 0 30
- t N N 00 N N o) o: -* -* -=~ -\
*-Semitrailer
VTI notat 84A-1998 29 Semitrailer F ax : 2 w : 2 m : 2m me mm x m m ! mm ! ma x N 2 0 N 5 5 m e me Fm ! Fax FOX FOX vmv. vm x F a x F m ! O l l r 0 3 12 . 3 3 : B R» ~ ~ _ _ q/ u nyu .n 7 an d nuu .I L nuu ..\\ \\ \_ \\ \ \\\ ._\V V\ \\ V\\\ \\ VV \\VN . _m .\ \\\ \\V \\V \_\ .\. \, .
A
m._..
__._,,,._
.mmi
$ \ \ \ \\ \ \ \ \ \ \ \ \ \ \\ \ \ N \ \ \ \ \ \SS
N
xxx.
.
... \\\\\\ \\. \.\ \_\ \.\\\. _\\ \V\ .Am _\ \V \\\\ VV \V V\ \\\\ ,\\\ \. . \\ \\\\ \\ \. _ ,..__ _.,_¢. w... , n u . r . t . fa . .. ,1 }. u, . . l .3 A .. : . . .t . T . .. . l »\\\ \\ \\ VV\\ \ __. \.\ _\.\.\ \V\ .\. . A\ \\ \\ \_ \\ \. \V \\ .\ \\ \V \. , w _ ...\ \\ \V \\V\ V\ \\ \\ \\ \\ \V \\ V\ V\ VN\\ \ I .1 in». . r, .. \\ \. \, \\ \\ \\ \\ rw\\ \\\ \\\ \\.\x\ . ,aa .... .
Road Test.
- -1
axle load for A88 and VTI formulas
th semitrailers laden to guaranteed triple
and road tests wi
Diagram 6. Difference between roller brake tester results
Semitrailer U m n m qm zo : 3k ...» Il r nn u w/ u .n r Aug nuu nn u 1 1 4 2
.3 ( c3 \c c3 \c c3\c c3 \c 3\ cs \. ag ed 17 , .l w.a . . n . wa s ? i rxé v. w. E . g t l . \ a ; r .A x . .. y x .. . )2 . A wa x : 2 m : 2m : 2 m if fy. ..; .. n: .. .. .H. . .5 . ,1 . in. .. N q \ \ \ \ \ \ \ \ \ \ \ \ \ 2...»: A my? ,.:3 .. . A4.. ....wt .._H a
N W va a3 \\ cr \\ca 3\ (a syc a3 \\ ccayc rs s\ cc x\ y ki n. t . . < 50 3. .. .. . 3. 3. .. . a. Um . .4 3. 1. .. mu Jame ? ? ? » 2 . 3 . 4 3 24 : .. mu wk ; aawc a\ xc 3\ ca xwc :X\c a\ cn x\ uc a\ sa \\c1 3\ cs . \ 3. 4% .. .. ». ..a. 3: %ui ). i . m xx aum km mmk wx§\ § m wm uv_ an 1n As n\ \a \A w:m\ c3 \s ps \c s\ uc \\ c3\s \ H T ? . n e m i i .s .wt .m .4 uh wn :«4. .2 2 .. \¢w> ¢J .ne_ ;; axt +h g st a N 2 % «A NNAA AN KA NA AA Ax\ \\ \A AA \N AA NN J NfrJH .3 \ \ \ \ \\ NE w m E m 22 m. Fax Fax FOX FOX vm x vm x F m ! me N N N N
\c na \vc ls\c AX \V ca x\ ut _ ...u.. .. .,. u._ .._ éidwv. a.. ." ' . .\ ca \s :\ ua \c m\cxyc x\ c1 \x3 \a \\ c\ \w ym i w...A mi le . Ex. 7. m._ ..,.. 4.9.4. 1.. A . H a\ us \c s\u3 \ua \uc \\ :1 \s srus \. ... m. .m .K rwwwu0 .1 ?-.: .. t me rA \wr wwcna \\ vn 3\ cc n\
IVTI
ASB
.. .m .#2 . , M..~. M..H ,. hum /m m... A n i a ? .i .x. ;.13 ; 3» .. \\ \ \ \ \ \ \\ \ \ \ \ \ \ $3 3.; .N wwh .. . 1 3: .. . in .. A... D Road Test , axle load for A88 and VTI formulasDiagram 5. Comparison between roller brake tester results and road tests with semitrailers laden to guaranteed triple
Annex 2
De cele ra ti on m/ s2 L EMDiagram 7. Comparison between roller brake tester results and road tests with unladen semitrailers with load
simulation for CITA and VTI formulas
Cl TA
" f"'--5:3-7
El Road Test
L W S 8 8 M ZE N 8 8 M Z W S Z WS 8W 8 8 W 8 L E M L E M L O X LON 178M Semitrailer3O Dece le ra ti on m/ s2 _. x O O N w-b -( G N m t O
Diagram 8. Comparison between roller brake tester results formula with theoretical starting pressure and VTI formula
and road tests with fully laden semitrailers for Danish
E: DanishFormula l