Comparative test of the effect on wet ice friction of adding a special aggregate in the tread rubber of a retreaded M+S tyre type
9
0
0
Full text
(2) Foreword The New Industries in Iceland has commissioned the VTI to investigate the effects on wet ice friction of adding special aggregates to the tread rubber of a retreaded tyre type. Mr Romuald Banek has assisted in carrying out the tests together with the author. The client Mr Vigfusson was also present during the tests. Linköping, February 2001. Olle Nordström. VTI notat 15A-2001.
(3) Contents. Page. Summary. 5. 1. Background. 6. 2. Commission. 6. 3. Test objects. 6. 4. Test equipment. 6. 5. Test method. 7. 6. Data processing. 9. 7. Results. 9. 8. Discussion and conclusions. VTI notat 15A-2001. 10.
(4) Summary The investigation carried out on commission by New Industries, Iceland, comprised comparative tests with a total of 10 new retreaded passenger car tyres classified M+S with the same tread pattern with and without special aggregates mixed into the tread rubber compound. The tests were carried out in the VTI tyre testing facility on smooth and roughened water covered ice at a speed of 30 km/h. Water covered ice can be regarded as one of the most dangerous road conditions. Both braking tests and steering tests were performed. The braking tests measured maximum braking friction corresponding to ideal ABS braking performance and friction with a locked wheel. The steering tests measured maximum lateral friction and friction at a 20degree side slip angle (skid angle). The latter value represents conditions in skidding of the whole vehicle or excessive steering angle when entering a curve. The results on water covered smooth ice show that a new non studded winter tyre can get about 30% improved braking friction and about 40% improved steering friction by means of mixing the special aggregate composition into the tread rubber compound. Testing this improved tyre on water covered stud roughened ice showed that the friction for normal driving is practically the same as on smooth ice. If the vehicle gets in a 20 degree broadslide, rough ice gave up to 40% improvement compared to smooth ice. Repeated tests however quickly reduced this improvement to 10%. The values obtained on smooth flooded ice with the best tyre aggregate tread compound allows cautious driving while the reference tyre friction is insufficient for keeping a vehicle on the road even for a skilled driver under these very severe conditions.. VTI notat 15A-2001. 5.
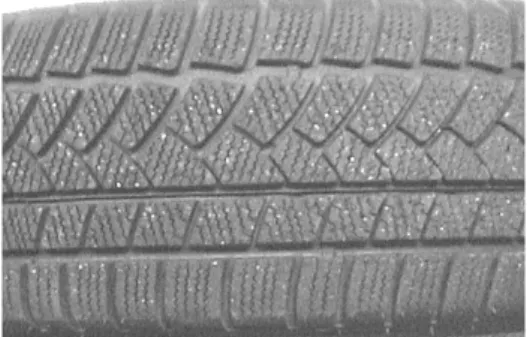
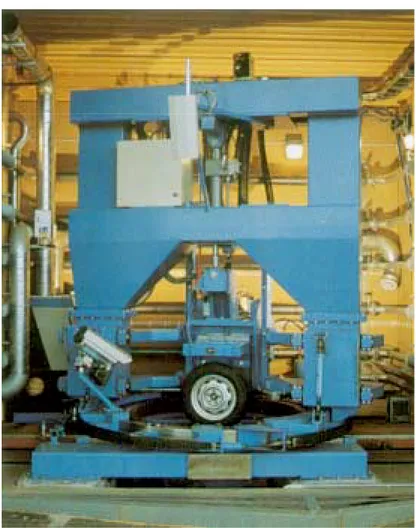
(5) 1. Background. Studded tyres cause road wear especially in countries with pavements with low wear resistance against studs primarily due to the type of stone aggregate. In several countries studs are banned for these reasons. Tyre manufactures try to develop winter tyres without studs with comparable friction. On ice this has still not succeeded under all conditions. Wet ice is one of them. The special aggregate mixed into the tread rubber invented by New Industries in Iceland is an attempt to improve ice friction without significant increase in pavement wear.. 2. Commission. The commission from New Industries entailed comparative testing of braking and lateral friction on water covered ice of 10 retreaded tyres with the same winter pattern but with different tread rubber characteristics obtained by adding different amounts and sizes of a special aggregate in the rubber.. 3. Test objects. Ten non studded retreaded tyres with the same winter tread pattern but with different tread compounds were tested. They were numbered 1 to 10. The rubber compound was different only with respect to the added amount and size of the special aggregate. All the tyres were marked M+S. The tyre tread pattern is shown in figure 1. Tyre 1 had no aggregate in the mixture and was used as reference tyre.. Figure 1 Tyre tread pattern on retreaded tyre without studs but with aggregate mix.. 4. Test equipment. The tests were carried out on a wetted smooth ice surface at the Institute's tyre testing facility. The facility has a moving road pavement 55 m long and 0.6 m wide in an air-conditioned building and a stationary but rotatable measuring wheel rig with a maximum wheel load of 10 tons and a test speed of up to about 10 m/s. Both truck and passenger car tyres can be tested in the machine. A detailed description is given in VTI Särtryck(Reprint) 220 1994. In figure 2 the test rig is shown adapted with a passenger car tyre.. 6. VTI notat 15A-2001.
(6) Figure 2 VTI tyre test facility. Test rig with passenger car tyre. 5. Test method. The tests were performed at a speed of 30 km/h on smooth ice wetted by a water jet in front of the tyre producing a water film of about 0,1 mm (see figure 3). Before wetting the ice had a temperature of –3,5 C ± 1.5 C. Both braking tests and steering tests were carried out. Steering tests were limited to tyre 1 and 4,6 and 7. Tyre number 4 was also tested in a steering test on the ice after it had been roughened by 2 steering runs of each of two studded tyres (D1 and D2). The braking tests measured maximum braking friction and friction with a locked wheel. The steering tests measured maximum lateral friction and friction at a 20-degree side slip angle (skid angle). Wheel load was 4,5 kN and tyre pressure 250 kPa.. VTI notat 15A-2001. 7.
(7) Figure 3 Wet ice tyre test in VTI tyre test facility The measuring programme comprised four braking tests with each tyre plus some extra tests for the reference tyre 1.The tests were performed with a time interval of 6 to 10 minutes in series starting and ending with the reference tyre 1. At the start of each test day repeated tests with the reference tyre was made until stable values were obtained. The reason is an initial polishing effect that gradually reduces friction. About three initial polishing runs were required. The same procedure was repeated after lunch break. In each individual run, the braking friction test yielded a maximum value (Brake-max) and a value with a locked wheel (Brake-locked), while the lateral friction test yielded a maximum value (Steer-max) and a lateral friction value at a 20-degree drift angle (Steer-20 deg.). Program for braking tests Day 1 Day 2 1,2,3,4,1 1,2,3,4,1 1,5,6,7,1 1,5,6,7,1 1,8,9,10,1 1,8,9,10,1 1,10,9,8,1 1,10,9,8,1 1,7,6,5,1 1,7,6,5,1 1,4,3,2,1 1,4,3,2,1. 8. Program for Steering tests Day 3 1,4,6,7,1 1,7,6,4,1 1,4,6,7,1 1,7,5,4,1 D1,D1,D2,D2,4,4,4,4. VTI notat 15A-2001.
(8) 6. Data processing. The mean of the respective type of friction value has been calculated for each tyre as well as maximum and minimum values, and standard deviation for the four different friction measurements for all tyre values were calculated. The results were considered sufficiently stable enough to avoid the need for any correction for varying ice quality.. 7. Results. Tables of the means for the various series of tests and a summary of the means in tables and diagrams are given in tables 1, 2 and 3 The results of the tests reveal major differences in friction between different types of tyre. Table 1 Results of peak braking (similar to ABS braking) tests on water covered ice Peak tyre 1 0.084 Mean Mean % 100 0.091 Max 0.077 Min 0.003 Stdev. Peak tyre 2 0.101 120 0.105 0.098 0.002. Peak tyre 3 0.103 122 0.108 0.099 0.003. Braking friction on flooded ice Peak Peak Peak Peak Peak tyre 4 tyre 5 tyre 6 tyre 7 tyre 8 0.110 0.112 0.111 0.110 0.092 130 133 131 130 110 0.113 0.117 0.119 0.114 0.106 0.108 0.106 0.099 0.105 0.084 0.002 0.004 0.007 0.003 0.007. Peak tyre 9 0.107 127 0.114 0.100 0.004. Peak tyre 10 0.101 120 0.105 0.097 0.003. Table 2 Results of locked wheel braking tests on water covered ice Braking friction on flooded ice Locked Locked Locked Locked Locked Locked Locked Locked Locked Locked tyre 1 tyre 2 tyre 3 tyre 4 tyre 5 tyre 6 tyre 7 tyre 8 tyre 9 tyre 10 0.080 0.093 0.094 0.094 0.093 0.102 0.101 0.085 0.101 0.094 Mean 116 119 118 117 129 127 106 127 118 Mean % 100 Max 0.082 0.095 0.097 0.097 0.094 0.108 0.103 0.086 0.105 0.095 0.075 0.090 0.092 0.091 0.093 0.098 0.098 0.083 0.098 0.092 Min 0.002 0.002 0.002 0.003 0.000 0.003 0.002 0.001 0.002 0.001 Stdev. Table 3 Results of steering tests on water covered ice Steering friction on flooded ice. Mean. Peak. Peak. Peak. Peak. tyre 1. tyre 4. tyre 6. tyre 7. 0.084. 0.119. 0.105. 0.103. 20 deg. 20 deg. 20 deg. 20 deg. tyre 1. tyre 4. tyre 6. tyre 7. 0.0765. 0.0108. 0.099. 0.096. Mean %. 100. 142. 125. 122. 100. 141.5. 129.1. 125.2. Max. 0.088. 0.122. 0.107. 0.105. 0.083. 0.112. 0.102. 0.097. Min. 0.078. 0.116. 0.103. 0.100. 0.070. 0.105. 0.096. 0.094. Stdev. 0.003. 0.002. 0.002. 0.002. 0.00375. 0.002. 0.002. 0.001. Tyre no 1 is the reference tyre without any aggregate in the tread. In table 1 it can be seen that the peak braking friction is improved by the aggregates in all cases. The best combinations were tyres 4, 5, 6, and 7 that were about 30% better than the reference. In table 2 the results from locked wheel braking show that tyres no 6 and 7 are the best with about 30% improvement. In table 3 the results show that VTI notat 15A-2001. 9.
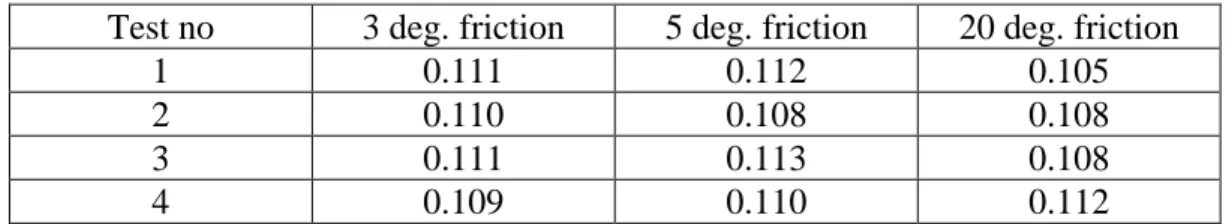
(9) tyre 4 had the best peak and 20 degree side slip angle steering friction both being about 40% better than the reference. Tyre no 6 was next best with 25 and 29% improvement closely followed by tyre no 7 with 22%and 25%. Table 4 Tests on water covered smooth ice with tyre 4 Test no 1 2 3 4. 3 deg. friction 0.111 0.110 0.111 0.109. 5 deg. friction 0.112 0.108 0.113 0.110. 20 deg. friction 0.105 0.108 0.108 0.112. Table 5 Tests on water covered stud roughened ice with tyre 4 Test no 1 2 3 4. 3 deg. friction 0.108 0.104 0.103 0.103. 5 deg. friction 0.116 0.112 0.112 0.110. 20 deg. friction 0.146 0.128 0.120 0.120. Table 4 shows that the friction after 3 deg. side slip angle is very flat and for tyre no 4 at about 0.11. Table 5 shows that on stud roughened ice the friction on the roughest ice is similar to smooth ice at 3 deg. and marginally higher at 5 deg. At 20 deg. there is about 40% improvement compared to smooth ice. As the ice texture is gradually worn by each run the 3 deg. and 5 deg. values first decrease slightly and then stay constant. A similar trend is also seen for the 20 deg. value but here the steady state value decreases more and is only 10% better than the smooth ice.. 8. Discussion and conclusions. Water covered ice can be regarded as one of the most dangerous road conditions. The results show that a non studded retreaded tyre can get about 30% improved braking friction and about 40% improved steering friction by means of the special aggregate composition represented by tyre no 4. On water covered stud roughened ice the friction for normal driving is practically the same as on smooth ice. If the vehicle gets in a broadslide rough ice gave up to 40% improvement compared to smooth ice. Repeated tests however quickly reduced this improvement to 10%.. 10. VTI notat 15A-2001.
(10)
Figure

Related documents
Swedenergy would like to underline the need of technology neutral methods for calculating the amount of renewable energy used for cooling and district cooling and to achieve an
Re-examination of the actual 2 ♀♀ (ZML) revealed that they are Andrena labialis (det.. Andrena jacobi Perkins: Paxton & al. -Species synonymy- Schwarz & al. scotica while
För det tredje har det påståtts, att den syftar till att göra kritik till »vetenskap», ett angrepp som förefaller helt motsägas av den fjärde invändningen,
Vi ämnade med vår studie att visa hur Mentens ska kunna implementera sociala medier i deras marknadsföringsstrategi och verksamhet. Genom teorier från
At a temperature of -4°C and 2 bar contact pressure, friction was strongly dependent of the number of contact points to the
46 Konkreta exempel skulle kunna vara främjandeinsatser för affärsänglar/affärsängelnätverk, skapa arenor där aktörer från utbuds- och efterfrågesidan kan mötas eller
The literature suggests that immigrants boost Sweden’s performance in international trade but that Sweden may lose out on some of the positive effects of immigration on
• A Pressure sensor that measures the pressure in the load cylinder and by that also the normal load between wheel and ground surface. • Position sensor in the servo motor to
