Variability in roadbase
layer properties conducting
indirect tensile test
Paper presented at the ISAP conference
in Seattle, USA, August 1997
N
07
c» Fil oo h N x 0 > h 4.0 h 3 mSafwat E Said
Swedish National Road and
VTI särtryck 278 - 1997
Variability in roadbase
layer properties conducting
indirect tensile test
Paper presented at the ISAP conference
in Seattle, USA, August 1997
Safwat E Said
§Wg m ' agg Cover: Christer Tonström, Mediabild
VARIABILITY IN ROADBASE LAYER PROPERTIES
CONDUCTING INDIRECT TENSILE TEST
Safwat F. Said
Swedish National Road and Transport Research Institute (VTI) SE-581 95 Linköping, Sweden
Abstract. Knowledge of variabilities in the properties of asphalt pavement layers is valuable in the structural evaluation of pavements. Mix composition and construction procedure influence the mechanical properties of bituminous layers. Fatigue and stiffness characteristics are two of the most important parameters in input data to pavement evaluation models. In this study, more than 300 cores from 15 test sections were drilled from roadbase layers for determining mix composition, fatigue and stiffness properties. These cores have been tested at different temperatures when conducting the Indirect
Tensile Test (ITT). The ITT, which is
probably most suitable for examining speci-mens from pavement layers, has proved to be sufficiently accurate for routine use, such as determination of mix properties, and also in quality control. A good correlation has been found between laboratory based and field based fatigue curves for the roadbase mix.
Statistical fatigue relationships based on the laboratory measurements are also pre-sented and the effects of the variabilities in the mix properties are illustrated. It is hoped that knowledge of the characteristics of bituminous pavement layers with their variations and the use of ITT in routine measurements may cont-ribute to further utilization of pavement eva luation models by road engineers.
Keywords: Bituminous roadbase layer, In-direct tensile test, Resilient modulus, Fatigue
strength.
BACKGROUND
The pavement layers are exposed to different types of stresses and strains during wheel pas-sage. These stresses and strains cause a variety of damage in the pavement, such as longitudi nal and transversal cracks in the pavement surface. The longitudinal and transversal cracks in the wheel paths are probably induced by the transversal and longitudinal strains respectively. The question is: Which type of cracks appear first? In the Swedish structures, it is believed that the longitudinal cracks in the wheel paths become visible first (Figure 1).
Figure 1. Longitudinal cracks in the wheel path
Therefore, fatigue damage to pavements is believed to be caused by transversal strains at the bottom of bituminous layers. Conse quently, the transversal strains are more dele-terious than the longitudinal strains under the same loading conditions.
The development of the longitudinal and transversal strains measured at the bottom of the bituminous layers is reported, by Huhtala
et al. (1990), among other, see Figure 2. A
similar development is calculated by
VEROAD (Hopman 1996). 500 (IJS) 49.3 km/h n _250 100 ms 500 47.4 km/h _250 100 ms[ s.. ___c-c l
Figure 2. Typical signals from a longitudinal (A)
and a transversal (B) strain gauge (Huhtala et al.)
According to Huhtala et al. (1990), the
transversal strains are usually 1.1 to 1.5 times greater than the longitudinal strains under the same loading conditions. The longitudinal
strain signal shows compression rst, then
tension and after that compression again. After the wheel passage, the strain will be zero (no
permanent deformation). However, the
trans-versal strain signal shows only tension, which
slowly decreases to zero. In certain cases, the
strain signal could take more than half an hour to return to zero. Also the loading time of the transversal signal is much longer than the loading time of the longitudinal signal.
Comparing the damage effect of the longi-tudinal and transversal strains with respect to fatigue cracking, the transversal strain is larger in magnitude and loading time. The compres-sion part of the longitudinal strain might create a strengthening effect against cracking. Thus the transversal strains are more destruc tive than the longitudinal strains and this is probably the reason why the longitudinal cracks are usually observed first on the
pave-ment surface. For this reason, the transversal
strain signal should be simulated when study-ing fatigue properties in the laboratory.
INDIRECT TENSILE TEST (ITT) Different types of test methods have been used when studying stiffness and fatigue properties of bituminous mixes. Figure 3 shows test methods which are frequently used nowadays.
Test method Configuration Loading signal
2-130th & bending m, E' 3-point f A % bending ° "ff \
ä
\\/ \/
'ä 4-poi_nt Time __ =, bending .E (0 Triaxial and axial 3&4 , , PgIfl/Upstroke JT. : : __| lme point m CI mmm bending .2 & test E i g 8 Time g "0 G) _ m&": Triaxlal &;
% and axial 3,3 (I Time lndirect c tensile 5 test ;, Time
Figure 3. Different types of test methods
The problem is: Which method and proce-dure are most suitable for characterizing
bituminous materials? The choice of the test method depends on the purpose of the speci c
work, discussed elsewhere (Said 1995). The
limits of the test methods illustrated in Figure 3 are also mentioned in the previous reference. In this work, lTT has been used for measuring the stiffness and fatigue properties of roadbase material. The greatest disadvantage of ITT is the accuracy of the stress distribution, which is only valid under ideal elastic conditions
(Brown 1978). Therefore, the method should
not be used at temperatures greater than about
20°C (Sousa et al. 1991). Furthermore, the
Poisson s ratio must be assumed for the deter mination of strain across a horizontal diame-ter. The great advantages of ITT (Kennedy
1977, Pell 1987, Cooper et al. 1991, 1993) are
its simplicity and quickness. Cylindrical specimens are used which are relatively easy to core from the road layer. Thus, ITT could be used in routine measurements. The defor mation signal formed from ITT is shown in Figure 4. It is comparable to the transversal strain signal form measured during a vehicle passage (see Figure 2). Only tension is present and this decreases slowly to zero.
8 De fo rm at io n, p m . b Time, sec
Figure 4. Illustration of deformation signal from
ITT
As mentioned above, the cracking distress
is usually longitudinal in the wheel paths and should be related to transversal strains. The fatigue properties of asphalt materials
investi-gated in the laboratory should be determined using a deformation signal in specimen similar to the transversal strain during a wheel pas-sage. Thus, ITT is not only simple but also accurate in simulating the field conditions
during a wheel passage in respect to fatigue
cracking. For these reasons, ITT is suitable for
determination of fatigue properties and
stiff-ness of pavement layers in routines such as quality control and evaluation of the properties of bituminous pavement layers.
The VTI s loading device for ITT is shown in Figure 5. The VTI s Material Testing System (VMS) is a servohydraulic, closed loop control system from MTS Corporation
(Figure 6). Control of the system and data
acquisition make use of ATS software. Hori zontal displacement is sensed by two MTS model 632.11C extensometers with full scale travel of 13.75 mm. Load cell
': 41:15: 5. Asphalt specimen Extensometer Deformation strip Loading strip
Figure 6. The VTI s Material testing System
(VMS)
EXPERIMENTAL INVESTIGATION More than 300 cores with a diameter of 100 mm were drilled from roadbase layers on 15 test sections when new, and used in laboratory tests. Tests included determination of mix composition, layer thicknesses, fatigue and resilient modulus properties. Eleven of these test sections have been under observation for almost ten years in order to develop a eld-based asphalt fatigue criterion applicable to the typical bitumen roadbases in Sweden. Development of distresses in the road sections is followed by FWD measurements for calcu-lating tensile strain at the bottom of roadbase layers, in addition to traf c counts, pavement distress surveys and other investigations. For further details, see work reported by Dj'arf
(1990, 1993, 1996). The eld-based criterion
is used here to validate the laboratory based fatigue criterion (discussed later).
Mix composition. The recipe for the mix from roadbase layers should meet the specifications and guidelines for road
construction (Swedish Road Administration
BYA 84). The bitumen type is B180 and the bitumen content is 3.7 to 4.2 per cent by weight. The aggregate size limits of the grading curve (AG 25) are shown in Figure 7. The maximum aggregate size is 25 mm and the air void content should be 5 10 per cent.
The differences between the grading curves of the test sections are small. See Figure 7.
100 | » »
Size limits of mix AG25
80 E & 60 \\ ! 8»
:!
= 40 if
g / ifa
20 ff%% &
W O I I 1 0,075 0,25 0,5 1 2 4 8 16 32 Size, mmFigure 7. Size limits for the roadbase mix AG 25
Variations in the mix composition within and between roadbase layers are illustrated together in Figure 8 by frequency distribution diagrams of void content, binder content, void lled with bitumen, voids in mineral aggre-gate and viscosity of recovered binder. All variables are out of specification limits for the AG 25 mix.
The variations in mix composition should signi cantly in uence the properties of bitu
minous mixes (Brown 1995). Consequently,
these should be checked and taken into con-sideration when analyzing pavement
30 Av Std. Dev = 10.79 Mean = 65.0 20 . N = 295.00 >. 8 a, 10 -: O'" 8 u.
0 37 4'2 4'7 52 57 6-2 6-7 72 7'7 02 8 7 92
VFB (Void lled with bitumen) 60 Std. Dev = 2.47 50 ' Mean = 6 40 . N = 295.00 >. 30 ' 8 20 . % \ g 10 c l u. 0 -'1 20456 7/001'01-1121314 Void content % 40 Std. Dev : 2.42 7 Mean = 16 30 ' N = 283.00 20 . >. o % 3 10 | U., & u.
11 12 10 14 143 16 17 18 19 20 21 22 23 24 VMA % (Voids in mineral aggregate)
8 _ Std. Dev : .44 6 Mean = 4.5 1 I; N = 36.00 > 4 ' / o
s
/
:: 2 cr 93 N u. -, _, 3.6 3.8 4.1 443 4.5 4.7 4.9 5.2 5.4Binder content weight %
10 Std. Dev=216.32 3 . Mean=716 6 . //-\ N = 19.00 >=
2 4
%* cr 2l & LL 0 | 200 400 600 800 1000 1200Viscosity at 135°C, recovered bit
Figure 8. Frequency distribution diagrams of
mix, AG 25, variables
Resilient modulus. The resilient modulus was performed on cured specimens at different temperatures. Figure 9 shows the resilient modulus of individual specimens at different temperatures and an exponential regression relationship. The variation in the results is expected due to the variations Within and
between the mix compositions illustrated in Figure 8. 30 000 m o.
f. 20 000
: D D
cbS a5 ;:: . U : o : E : E :. å 10 000 "2 V) : q) .. O: : 0 - . '| 0 0 1 0 20 30 40 Temperature, °CFigure 9. Variation in resilient modulus of indi-vidual specimens, mix AG25
Figure 10 presents the average of the resil ient modulus of each test section at various
temperatures. Each curve represents a test
sec-tion. The variation in the modulus between test sections is relatively high and should be taken into consideration when predicting pavement performance. It is believed that the variation in the properties of roadbase layers is primarily due to the wide limits of the mix specification.
20000
a I . AAGZS, roadbase cores
a 15000
-E -E Q ..-= 5 10000 --
w _2 %
o 5000 E 0 0 10 20 30 Temperature, C _o L252 mem LS __ -A RV23 .. RV62 + RV41 0 + RV41 U + RV80 - Av ,...mm RV67 <> L117 El E66 - A Norsholm )< - Gävle + Rv32ö _e Rv32u + Rv34ö - Rv34uFigure 10. Relationships between resilient modulus and temperature in Test Sections
It should also be mentioned that the age of the specimens when tested was between 4 months and 3 years. The variations in the re sults must be affected by the difference in the age of specimens when tested.
Results presented in Figure 10 have been analyzed statistically. The regression relation ship between resilient modulus and tempera ture for the roadbase mix AG 25 is presented in Figure 11. The 90 per cent con dence and prognosis bands are also illustrated. With a 90 per cent probability, the modulus of any indi vidual road section of roadbase layer, mix type AG 25, will be within the prognosis band. Knowledge of the variations in the resilient modulus of pavement layers is useful for quality assurance and evaluation of pavement performance.
The variability in the properties of asphalt pavement layers indicates the importance of the determination of the properties of existing asphalt pavement layers for use in perform-ance evaluation. 6 1 25 000 2 AG 25 ,,,- 20 000 Mr .= 1.54 - 104 elf-065 (D
%"
O 15000 E E 10000 .g "g 5 000 II 00 5 10 15 20 25 30 Temperature, °CFigure 11. Regression relationship between
resilient modulus and temperature with 90% confidence and prognosis bands for roadbase
mix AG 25
Fatigue properties. Fatigue tests were performed on core specimens from roadbase layers after determination of resilient modulus. Fatigue results on specimens from eleven test sections were used for comparison between laboratory and eld based fatigue curves. ITT with constant-stress mode has been conducted
at two temperatures: +4°C and +15°C. A cylindrical specimen is subjected to a periodi-cally repeated load with 0.1 sec loading time and 1.4 sec unloading time. The initial strain of the fatigue tests was planned to be in the range of 100 to 400 ue because the tensile strains at the bottom of roadbase layers from
test sections varied between 100 to 350 us
according to Dj'arf (1996). The fatigue proper ties are represented by the correlation between the initial strain and the number of load appli-cations at failure. The initial strain used here has been found from total deformation. The
total deformation, which is the maximum
deformation under a loading period, is com posed of resilient and permanent deformation illustrated in Figure 12.
The method of determining initial strain could give rise to contradictory conclusions when expressing the results by strain number of applications relationships with regard to temperature (Ruth & Olson 1977, Kim, Khosla & Kim 1991, Dj'arf & Said 1993).
TD = Total deformation RD = Resilient deformation PD = Plastic deformation De fo rm at io n RD "/_4 PD l Time
Figure 12. Definitions of deformations
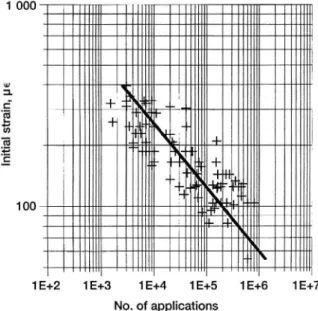
Figures 13 and 14 present relationships between initial total strain and number of load applications to failure. The cores from road base layers on the eleven test sections were tested at two temperatures, +4°C and +15°C.
The statistical analysis for each test sec tion has shown the signi cant effect of tempe-rature at the 5 per cent level for all tested sec
1000 In it ia l st ra in , pe 100
1E+4 1E+5 1E+6 1E+7
No. of applications
1E+2 1E+3
Figure 13. Fatigue curve of roadbase layer, AG 25, at +4°C
The variations in the fatigue results were expected, due to a high variation within and between test sections as discussed earlier. On
the other hand, the results represent the real
eld conditions. The variation in the fatigue result is of the same order as the variation in the fatigue life in the field (Djärf and Said 1993). 1000 In it ia l st ra in , ue 100 1E+6
1E+4 1E+5 1E+7
No. of applications
1E+2 1E+3
Figure 14. Fatigue curve of roadbase layer
AG 25 at +15°
In order to quantify the effect of mix varia-bility in roadbase mix type AG 25 and for the purpose of validating the fatigue results on cored specimens, an investigation on labora tory compacted specimens was planned. Spe-cimens with different recipes but within the limits of specifications of the roadbase mix (AG 25) were manufactured by a gyratory
compactor.
Figure 15 shows the effect of void content on fatigue strength of the mix AG 25. The variation in the void content is produced by using different compaction levels. The varia-tion in fatigue resistance could be more than 100 per cent, illustrated in Figure 15, depen-ding on the void content. These results demon-strate the cause of the high variability in the properties of specimens taken from roadbase layers.
The effect of temperature has also been found in gyratory compacted specimens for the AG 25 mix. Only seven specimens per temperature have been tested so far. The ten dency of the effect of temperature, shown in Figure 16, is almost the same as for the cores from the test sections presented in Figures 13 and 14. The effect of temperature is fairly small. This is probably due to the poor binder content in the roadbase mix.
1000 __
»; :.. EL-.E ;;;pp m ;;;gg;_gx_imm__ggg;_iii,udg &få
101E+4 1E+5 1E+6 1E+7
No. of applications Figure 15. Effect of void content on fatigue
1000 100 In itia l st ra in(u e) 10
1E+3 1E+4 1E+5 1E+6 1E+7
Number of applications, N, Figure 16. Effect of temperature on fatigue
strength of mix AG 25
The calculated fatigue criterion at 10°C based on laboratory measurements at +4°C and +15°C is compared with the eld fatigue criterion (Djarf 1993, 1996) plotted in Figure
17.
Roadbase layer (AG25), 10°C
In it ia l st ra in , pe 100 9 8 7 T lllTl 1E+7 6 l Trill lflj l ] ljllfll
1E+3 1E+4 1E+5 1E+6
Applications to failure
Figure 17. Laboratory and field fatigue criteria of roadbase layer at +10°C
For the eld based relation, the strains at
+10°C are calculated from de ection bowls measured by FWD in the autumn of the rst and second year after opening to traf c. The number of load applications which is equiva-lent to 100 kN single axle loads is determined from vehicle classi cation traffic counts. The
failure of a test road judged by manual distress
identification and thereafter the fatigue life is determined. The field and laboratory fatigue relationships are thus developed independ-ently.
The slopes of the field and laboratory based relations are 2.4 and 2.9 respectively with a shift factor of about 10 (at 200 us) depending on the level of strain. In general, the fatigue life relationship produced in the laboratory is in agreement with the eld crite-rion and it is concluded that ITT is suf ciently accurate for routine use.
For practical use, a statistical predictive equation for the fatigue life of roadbase mix is presented:
18 3.56 log 8 1.79 log MR + 0.023 VFB
log Nf =
Nf = no. of load applications to failure 8 : horizontal tensile strain in us MR = resilient modulus in MPa
VFB= void lled with bitumen in per
cent
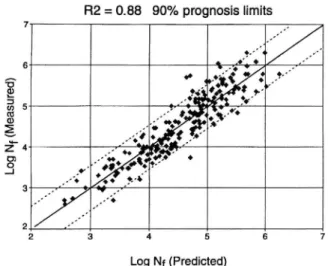
A comparison between measured and pre dicted fatigue life is shown in Figure 18. More than 300 cores from 15 test sections have been
tested. The coefficient of determination (R2) is
0.88. The 90 per cent prognosis limits, which are useable for prediction of pavement perfor
R2 = 0.88 90% prognosis limits
7 9.3'4» 6 Q., 006 . "59 «0 (."/$. . : x.96 o." 0 fV = 5 A -" Q' (0 !" * v ." 8 " ' 4. ' _... CO 2 _. 0 * ?. V ," , : Q *O 4 r .. _o Z w . »» 01 ' o '&'??? . S .," " . t " .. o.. ? ; 3 # # "1' .." 2 2 3 4 5 6 7 Log Nf (Predicted)
Figure 18. Comparison between measured and
predicted fatigue life
CONCLUSIONS
0 There are many variations in the mix com position of roadbase layers, which gives rise to variabilities in the properties of roadbase layers, such as resilient modulus and fatigue strength. These variabilities should be taken into consideration for a better performance prediction.
0 Good agreement has been found between laboratory and field criteria, with a shift factor of 10.
0 The indirect tensile test, which is relatively simple, rapid to perform and makes use of cylindrical specimens, is also suf ciently
accurate for routine use.
REFERENCES
Brown, S.F.; Mix Design of Base Courses Course on Bituminous Pavement:
Mate-rial, Design and Evaluation. Univ. of
Oulu, Finland 1995.
Brown, S.F.; Mechanical Properties of
Bitu-minous Materials Asphalt Technology, Journal of the Institute of Asphalt Tech nology, No. 25, November 1978.
Cooper, KB and Brown, S.F.; Assessment of the Mechanical Properties of Asphaltic Mixes on a Routine Basis Using Simple Testing Equipment 5th Eurobitume
Con-gress, Stockholm 1993.
Cooper, K.E., Brown, S.F., Preston, J.N. and
Akeroyd, F.M.L.; Development of a Practical Method for the Design of Hot Mix Asphalt Transportation Research
Board, 70th Annual Meeting, 1991. Djärf, L.; Fatigue Criteria in the eld Pro
ceeding of a seminar on fatigue criteria of asphalt layers. VTI S'artryck No. 259-1996,
Sweden, March 1996. (In Swedish).
Djärf, L., Said, S.F.; Laboratory Fatigue Properties Compared with Field Perform ance 5th Eurobitume Conference Stockholm 1993.
Djärf, L.; Performance Based Asphalt Strain Criteria 3rd Int. Conf. on Bearing Capa city of Roads and Airfields, Norway 1990. Hopman, P.C.; A Visco-Elastic Analysis of
Asphalt Pavements Using VEROAD Euroasphalt & Eurobitume Congress 1996. Huhtala, M., Alkio, R., Philjam'aki, J.,
Pienimäki, M. and Halonan, P.;
Behav-iour of Bituminous Materials under Mov-ing Wheel loads Journal of the Associa-tion of Asphalt Paving Technologists, Vol. 59, 1990 p. 622.
Kim, Y.R., Khosla, NP. and Kim, N.; Effect
of Temperature and Mixture Variables on Fatigue Life by Diametral Fatigue Test-ing Transportation Research Board, 70th Annual Meeting, 1991.
Molenaar, A.A.A.; Variability in Pavement
Structures and its Significant to Perform-ance of Pavements Course on Bitumi-nous Pavement: Material, Design and
Evaluation, Univ. of Oulu, Finland 1995. Pell, P.S.; Pavement Materials 6th Int.
Conf. on the Structural Design of Asphalt
Pavements, Vol. II, 1987.
Ruth, BE. and Olson, G.K.; Creep E ects on
Fatigue Testing ofAsphalt Concrete Pro-ceeding of the Association of Asphalt
Paving Technologists, Vol. 46, 1977.
Said, S.F.; Test and Design Parameters of Elastic Stiffness and Permanent Deforma-tion Course on Bituminous Pavements: Materials, Design and Evaluation, Univ. of
Oulu, Finland, April 1995 .
Sousa, J.B., Taylor, R. and Tanco, A.J.;
Ana-lysis of Some Laboratory Testing Systems for Asphalt Aggregate Mixtures Preprint.
Transportation Research Board, 70th