Impact of Government R&D
Subsidies on Innovation Efficiency
of China’s High-tech Industries
MASTER
THESIS WITHIN: Economics NUMBER OF CREDITS: 30
PROGRAME OF STUDY: Economic Analysis AUTHOR: Jiazhong Li
Master Thesis in Economics
Title: Impact of Government R&D Subsidies on Innovation Efficiency of China’s High-tech Industries
Authors: Jiazhong Li Tutor: Almas Heshmati Date: 2020-05-18
Key terms: innovation efficiency; high-tech industries; government R&D subsidies; stochastic frontier analysis; China.
Abstract
Innovation efficiency is a key factor influencing the position of high-tech industries in the global value chain. Through stochastic frontier analysis, innovation efficiency of China's high-tech industry from 2000 to 2016 was estimated and analyzed. Through five random frontier analysis models, innovation efficiency of new product sales revenue and number of patent applications are analyzed. Results show that the overall level of innovation efficiency in China's high-tech industry is not high. Government subsidies for innovation have a positive impact on the R&D results of new product income from China’s high-tech industry, but have a negative impact on the number of patent applications. Scale of enterprise, degree of openness of enterprise, quality of the labor force and export delivery have a positive impact on innovation efficiency of China's high-tech industry. R&D capital stock and R&D human capital stock have a positive effect on high-tech industry innovation. In high-tech industry's transition from patents to new products, there will be a low conversion rate. Results of economic analysis can help the government to make the basis for management decisions. Conclusion of innovation performance analysis provides practical normative guidance for these high-tech industries.
Table of Contents
1. Introduction ... 1
2. R&D subsidies and status of high-tech industries in China ... 3
2.1 Comparison of R&D between China and developed countries ... 3
2.2 Research and development of China's high-tech industry ... 4
3. Literature review ... 6
3.1 Government subsidies will promote technological innovation ... 6
3.2 Research on the impact of government R&D subsidies ... 7
3.2.1 Government R&D funding has a positive impact on the innovation efficiency ... 7
3.2.2 Government R&D funding has negative on innovation efficiency ... 8
3.3 The impact of government subsidies on innovation efficiency in high-tech industries ... 9
4.Methodology ... 11 4.1 Methods ... 11 4.2 Variables ... 16 4.2.1 Output variables ... 16 4.2.2 Input variables ... 16 4.2.3 Efficiency factors ... 17 4.3 Data ... 19 5. Empirical results ... 20
5.1 Analyze the empirical results of the sales revenue of new products ... 20
5.2 Analyze the empirical results of the number of patent applications ...23
6. Efficiency analysis of China’s high-tech industry ... 26
7. Conclusion ... 26
Figures
Figure 1. 2018 R&D fund in major countries ... 4 Figure 2. Distribution of R&D funds and input intensity of high-tech industries (2016) ... 5 Figure 3. Regional R&D differences in China’s high-tech industry ... 5
Tables
Table 1. The characteristics of the five panel data models investigated ... 15 Table 2. Indicators and symbols for the stochastic frontier production model ... 18 Table 3. Data variable observations ... 19 Table 4. Regression of the sales revenue of new product (Y1) of the stochastic frontier analysis for
Model 1-5 ... 20 Table 5. Regression of the number of patent applications (Y2) of the stochastic frontier analysis for
Model 1-5. ... 23
Appendix
Appendix 1. Different models of new product(Y1) technical efficiency descriptive statistics36 Appendix 2. New product sales revenue (Y1) Kendall’s ranking correlation between model 1 and
model 5 technical efficiency estimates. For models 4 and 5, the overall technical efficiency (OTE) was calculated ... 36 Appendix 3. New product sales revenue (Y1) Kendall’s ranking relationship between model 4 and
model 5 for the estimation of persistent technical efficiency (PTE) and residual technical efficiency (RTE) ... 36 Appendix 4. New products(Y1) technical efficiency distribution of provinces for Model 1-537 Appendix 5. New product(Y1) the mean first and third quartile values of technical efficiency of
different provinces for Model 1-5 ... 38 Appendix 6. New product(Y1) distributions of persistent technical efficiency (to left) and residual
technical efficiency (to right) distributions for Model 4-5 ... 39 Appendix 7. Different models of patent applications (Y2) technical efficiency descriptive statistics
... 40 Appendix 8. Patent applications (Y2) Kendall’s ranking correlation between model 1 and model 5
technical efficiency estimates. For models 4 and 5, the overall technical efficiency (OTE) was calculated ... 40 Appendix 9. Patent applications (Y2) Kendall’s ranking relationship between model 4 and model 5
for the estimation of persistent technical efficiency (PTE) and residual technical efficiency (RTE) ... 40 Appendix 10. Patent applications (Y2) technical efficiency distribution of provinces for Model 1-5
... 41 Appendix 11. Patent applications (Y2) the mean first and third quartile values of technical
efficiency of different provinces for Model 1-5 ... 42 Appendix 12. Patent applications (Y2) distributions of persistent technical efficiency (to left) and
1. Introduction
Research and development (R&D) investment means that an enterprise or government invests a certain amount of money in research and development to build new products
or processes or update or improve existing goods or services. With the development
and progress of society, people are more and more aware of the unique role of R&D for
each country, region and enterprise (Habib et al., 2019). Effectiveness of R&D has a
causal relationship with national scientific and technological progress, frenzy of economic development, regional development process and competitiveness of enterprises. However, due to positive externalities of R&D and production, market failure caused by knowledge spillovers usually lead to market-led R&D below socially optimal level (Nelson, 1959; Arrow, 1971). Therefore, R&D innovation cannot only rely on market behavior but also require government assistance.
With the gradual disappearance of China’s demographic dividend1 and the sharp
reduction of natural resources, China’s economic development has begun to change from a factor-driven to an innovation driven type (Cai, 2010). As a knowledge and technology-intensive industry, high-tech industry is the main body of innovation driven by a country or region, and main position of market R&D activities, which can have a
huge impact on economic and technological development (Harbi et al., 2009).Due to
existence of market failure, if R&D resources are allocated through market, optimal allocation of resources cannot be achieved, supply of R&D information, knowledge, and technology would be insufficient (Aerts & Czarnitzki, 2004). This requires government to provide R&D funds for high-tech industry. In order to meet this demand, Chinese government’s investment in high-tech industries has also been strengthened, from 25.11 billion RMB in 2011 to 137.33 billion RMB in 2019, an average annual increase of 17.3% (National Bureau of Statistics of China, 2020). From these data, government subsidy for high-tech industries has been rising. The most direct purpose of government R&D of high-tech industry is to promote growth of its innovative products. As far as the current economic situation in China is concerned, there is an urgent need for government R&D funds to better promote economic development.
1 In economics, demographic dividend refers to the economic growth effect that accompanies the rise in
Expansion of R&D products mainly depends on expansion of R&D investment and improvement of technology upgrade efficiency (Jefferson et al., 2006).
Do government subsidies contribute to the innovation of high-tech industries, and do innovations bring technological innovation efficiency to high-tech industries? This is not only a major concern of government administration departments, but also an important issue whether high-tech enterprises can develop better. Through literature analysis, it can be seen that research on the impact of government R&D subsidies on technological innovation efficiency of high-tech industries can be divided into two completely different results. One side thinks that it has a positive impact, and the other side thinks it has a negative impact. Failure to give objective and fair conclusions on these issues will affect government's innovation subsidies distribution as well as the innovation and development of high-tech enterprises.
To help the government to formulate the best subsidy policy and promote improvement of enterprise innovation efficiency we conduct research on this issue and propose following hypotheses in view of some incomplete views. Government subsidies have different effects on the number of Chinese high-tech industry patent applications and the efficiency of new product sales revenue. The conversion efficiency of internal high-tech industry patent applications into final products is not high.
Many scholars (Hong et al., 2016; Bai & Li, 2011) regard the number of patent applications as the output of high-tech industrial innovation products, as the research object of studying industrial innovation efficiency. However, there is a problem with the number of patent applications, that is, the value of patents will be very different. Therefore, this article will try to use a new variable to analyze innovation efficiency of high-tech industries.
This article takes China's high-tech industry as the main research object, and uses stochastic frontier analysis (SFA) to measure the relationship between government subsidies and industry innovation efficiency. Main purpose of this article is to help the government to introduce a new variable that measure the efficiency of the industry, so that the government can quickly analyze the government-funded innovation efficiency of the industry. Innovation of this paper is to use a new output variable to analyze efficiency of high-tech industries, and compare a new variable with the number of
patent applications. Through the analysis of this article, we know how government R&D subsidies affect the innovation efficiency of high-tech industries. Research in this paper assumes that government subsidies have different effects on the number of Chinese high-tech industry patent applications and efficiency of new product sales revenue. Conversion efficiency of internal high-tech industry patent applications into final products is not high.
This article is structured in seven chapters. Second chapter is R&D subsidies and status of high-tech industries in China. Third chapter is literature review, fourth chapter is methodology, fifth chapter is empirical analysis, and sixth chapter is efficient analysis of China’s high-tech industry, and seventh chapter is conclusion.
2.
R&D subsidies and status of high-tech industries in China
To research the characteristics of the Chinese government’s R&D subsidies, this chapter expounds on R&D status of China’s high-tech industry and examines the development trend of government’s R&D expenditure from whole to part.
2.1 Comparison of R&D between China and developed countries
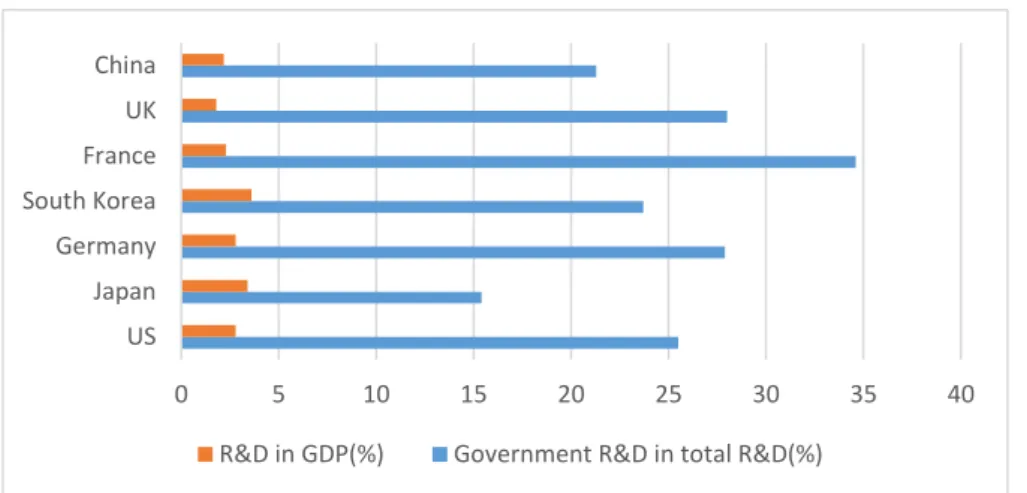
R&D investment is one of the most important indicators to measure a country's scientific and technological development level, and one of the important bases to improve the country’s comprehensive national strength and competitiveness (Freeman & Soete, 2009). There is still a big gap between China's R&D investment and developed countries’s. In recent years, R&D investment in developed countries has remained between 2.5 and 3 percent of GDP. In 2018, global R&D investment reached 2.3 trillion U.S. dollars, an annual increase of 3.6%. In 2018, the ratio of R&D to GDP in major developed countries and regions in the United States was 2.8%, Japan was 3.4%, Germany was 2.8%, South Korea was 3.6%, France was 2.3%, the United Kingdom was 1.8% , and China was 2.19% (R&D Magazine, 2019).
The government subsidies are the second-largest source of R&D funding (Hu, 2001).
National Science Board in 2018 shows the proportion of total government R&D investment in major countries. In 2018, the U.S. government R&D subsidie accounted for 26% of total R&D expenditure, Germany was 28%, the United Kingdom was 28%,
South Korea was 24%, France with the highest was 35% and China was only 21% (National Science Board, 2018).
Figure 1. 2018 R&D fund in major countries
Source: National Science Board, 2018 and Global R&D Funding Forecast, 2019. From the comparison of R&D investment of major countries in Figure 1, it can be seen that proportion of R&D investment in GDP and total R&D investment of the Chinese government are far behind those of developed countries such as France, Germany, the United Kingdom, and the United States. While China has been investing more in research and development projects in recent years and technology companies such as Huawei have emerged, the gap between China and the U.S. and Europe's technology powerhouses remains wide.
2.2 Research and development of China's high-tech industry
China’s high-tech industry consists of five major industries, namely Manufacture of Medicines, Manufacture of Aircraft and Spacecrafts and Related Equipment, Manufacture of Electronic Equipment and Communication Equipment, Manufacture of Computers and Office Equipment, and Manufacture of Medical Equipment and Measuring Instrument. The internal development of high-tech industry is uneven and regional development differences are obvious. From Figure 2, development of these five industries is uneven, and differences are exceptionally large. In 2016, R&D expenditure of Chinese high-tech industrial enterprises was 291.5 RMB million, accounting for 29.7% of the R&D expenditure of large and medium-sized manufacturing industries. Investment intensity of high-tech industry R&D funds (industry R&D funds/industry main business income) is 1.9%. Manufacture of aircraft and spacecraft and related equipment get the highest R&D investment intensity of
0 5 10 15 20 25 30 35 40 US Japan Germany South Korea France UK China
4.74%, and manufacturing of computers and office equipment has the lowest R&D investment intensity of 0.9%.
Figure 2. Distribution of R&D funds and input intensity of high-tech industries (2016)
Source: CSYHTI,2017.
China divides the economic zone into four regions: eastern, middle, western and northeastern. The east region includes: Beijing, Tianjin, Hebei, Shanghai, Jiangsu, Zhejiang, Fujian, Shandong, Guangdong and Hainan. The middle region includes: Shanxi, Anhui, Jiangxi, Henan, Hubei and Hunan. The west includes: Inner Mongolia, Guangxi, Chongqing, Sichuan, Guizhou, Yunnan, Tibet, Shaanxi, Gansu, Qinghai, Ningxia and Xinjiang. The Northeast region includes: Liaoning, Jilin and Heilongjiang. These four regions have obvious differences in economic development. The difference in economic development also leads to the regional difference in the development of the five high-tech industries.
Figure 3. Regional R&D differences in China’s high-tech industry
Source: CSYHTI,2017. 0.00% 1.00% 2.00% 3.00% 4.00% 5.00% 0 50 100 150 200 250 300 350
R&D funding (million) R&D funding intensity
Eastern Region 77% Middle Region 11% Western Region 10% Northeaastern Region 2%
INTRAMURAL EXPENDIUT R&D
From Figure 3, there are serious geographical differences in development of China's high-tech industry, and development is extremely uneven. The national high-tech industry R&D expenditure was 29.15 billion RMB, and the eastern high-tech industry R&D expenditure was 223.45 billion RMB, being accountable for 76.6% of the national R&D expenditure. R&D expenditure in the middle region was 32.64 billion RMB, accounting for 11.19%. Expenditure on R&D in the western region was 28.263 billion RMB, accounting for 9.69%. Regions with the highest R&D expenditure intensity were Guangdong and Jiangsu, with 92.01 billion RMB and 38.82 billion RMB, accounting for 31.5% and 13.3% of the national R&D expenditure. (CSYHTI, 2017).
3. Literature review
3.1 Government subsidies will promote technological innovation
Government subsidies can correct abnormalities in R&D and production activities
caused by market failures and improve the technical level of society (Jaffe et al., 2005).
Czarnitzki & Hussinger (2004) show that the return rate of R&D production activities is usually lower than the return rate of social investment. Therefore, most companies are reluctant to actively invest in enterprise product R&D but rely on market resource allocation for R&D investment. This level is lower than the optimal investment level. This level is less than the optimal investment level. It is recommended that government vigorously supports the R&D and innovation activities of enterprises and increases in R&D investment in whole society.
A large amount of government R&D funds directly provide financial support for enterprises, to a certain extent, reducing the financial pressure for enterprises to conduct R&D activities. R&D activities have great uncertainties in terms of investment duration, investment risks, and investment returns, and the adverse selection problem caused by information asymmetry between investors and R&D projects makes it difficult for companies to obtain corresponding R&D benefits. An important source of subsidies for company R&D activities is capital market financing (Stiglitz & Weiss, 1981). Information asymmetry between investors and specific R&D activities usually affects investors’ judgment on the true value of R&D activities (Aboody & Lev, 2000). Arrow (1970) shows that information asymmetry between investors and specific R&D
activities makes it difficult for companies to obtain corresponding R&D financing, which hinders the development of R&D activities. Brown et al. (2012) also clearly point out that capital is an important factor affecting company’s R&D activities, and financing difficulties have increased company’s threshold for R&D activity.
Besides, government’s R&D funds can help investors select project quality and investment value to a certain extent and play a superior signal transmission role. Lerner (2000) shows that the choice of government R&D funding projects tend to be of higher value, which can serve as a signal to reduce information asymmetry between investors and projects and help investors make correct assessments. Meuleman & De Maeseneire (2012) show through empirical research that government R&D funds have a more obvious role in promoting company financing at the initial stage. Takalo & Toivanen (2008) hold that the choice of government R&D funded projects are usually closely related to the country’s macro policies and the direction of future key support development, that is, the government can transmit a signal of project quality.
3.2 Research on the impact of government R&D subsidies
The result of research on the impact of government R&D funds on the efficiency of enterprise technological innovation is divided into two parts. First, government R&D funds have a positive impact on the efficiency of corporate innovation. Second, government R&D funds have negative on the efficiency of corporate innovation.
3.2.1 Government R&D funding has a positive impact on the innovation efficiency
To research the impact of R&D investment on the enterprise’s technological innovation performance, scholars mainly use the patent application, invention patent authorization, new product output value, new product sales, and other indicators to represent the enterprise's technological innovation performance, and uses the government’s amount of R&D funds as the dependent variable. This method analyzes the impact of government R&D expenditure on the number of enterprise patent applications, invention patent authorization, product output value, and sales of new products. Bérubé & Mohnen (2009) use the 2005 Innovation Survey data provided by Statistics Canada as a research sample and use non-parametric matching estimation methods to conduct an empirical analysis of the impact of tax credits and government R&D funds on
production. The value of the company’s new products, the value of the credit, and government R&D subsidies can effectively promote the production of new products and promote the successful industrialization and commercialization of these innovative products. Asheim et al. (2011) use patents and patent citations as indicators of technological innovation performance. The research finds that government R&D funds have a positive impact on the company’s technology innovation performance. Alecke et al. (2012) through the method of model construction, it can be concluded that government R&D subsidies have a positive impact on enterprise innovation. The conclusion shows that the number of patent applications will increase for enterprises with government R&D subsidies. Government R&D funds have a positive incentive effect on company patent applications. Compared with companies that have not received government R&D funding, companies that have received government R&D funding are more likely to file patent applications. The research finds that government R&D funding can increase the probability of companies applying for patents from 20% to 40%.
3.2.2 Government R&D funding has negative on innovation efficiency
Koku (2010) takes manufacturing industry data as a research sample to empirically evaluate the impact of R&D investment on enterprise profits of manufacturing enterprises. He mainly uses R&D expenditure and advertising budget after annual scale adjustment as independent variables and finds that innovation activities of manufacturing enterprises have no direct impact on their market performance. Fritsch & Slavtchev (2011) find that there was not any significant linear relationship between government R&D investment and enterprise performance, and enterprise performance is mainly determined by enterprise capital expenditure. Qing (2013) establishes provincial panel data for 30 provinces in China from 2003 to 2008, empirically measures the production efficiency of Chinese scientific research input and found that the impact of Chinese R&D input on corporate innovation performance is not significant.
The government supports innovative policies and institutions, but the results are not always satisfactory. Bai and Li (2011) made an empirical study based on panel data of 30 regions in China from 1998 to 2008, which revealed the efficiency of China's regional innovation system. In other words, they believe that the funds spent by local
governments on R&D have a significant negative impact on the efficiency of regional innovation. There is other evidence that it is difficult to provide effective institutional support for improving the innovation capacity of Chinese companies.
3.3 The impact of government subsidies on innovation efficiency in
high-tech industries
Klette & Møen (2011) use panel data from 816 Norwegian high-tech companies from 1982 to 1995 as a research sample to conduct empirical research on the impact of government R&D funds on R&D investment in electrical and electronic products. The research results show that the government R&D fund has a more obvious incentive effect on the R&D investment of small and medium-sized enterprises, and small enterprises have higher innovation efficiency. Becker & Hall (2003) divide the samples into three groups: high, medium, and low technology-intensive industries. The explanatory variables are the proportion of government funding, the number of scientists and engineers engaged in research and development, total employment, net capital investment, the proportion of foreign investment to university distance, the size of the market (expressed in terms of industrial value added), market competition (expressed in terms of imports), exchange rates and long-term interest rates. The research finds that government funding for R&D only had a significant impact on R&D activities in low-tech industries. Research and development activities have little impact on the innovation efficiency of high-tech industries. Lee & Hwang (2003) use panel data from 515 companies in 23 industries in South Korea from 1980 to 1999 as a research sample and divided IT into two sample groups, which were used in the IT industry and non-IT industry. Through the comparison and analysis of the government R&D expenditure in these two industries, the influence of the company’s R&D investment is analyzed. Through regression analysis, market structure, enterprise size (expressed in assets), internal cash flow (expressed in dividends/sales ratio), market outlook (expressed in profit growth rate), and government R&D expenditure is used as explanatory variables in the model. This paper finds that government R&D funds have an important induction effect on the R&D investment of IT enterprises.
Hall & Bagchi-Sen (2002, 2007) select the biotechnology industries in Canada and the United States as the research objects and found a significant positive correlation
between government R&D funds and innovation efficiency. Also, R&D companies pay more attention to business strategies to improve R&D capabilities and increase cooperation opportunities for scientific research institutions, while R&D companies pay more attention to market size and the establishment of sales channels for scientific research institutions, ignoring the importance of innovation. Scholars take developing countries such as China as examples, and use company ownership (Lee & O’Neill, 2003; Choi et al., 2011), investor characteristics (Hoskisson et al., 2002; Czarnitzki & Licht, 2006) and political networks (Li & Zhang, 2007) and other factors to analyze the relationship between government R&D expenditure and enterprise innovation efficiency. They all prove the importance of government funding in the innovation and R&D efficiency of this high-tech enterprise.
On the discussion of the role of government and enterprise R&D activities in the high-tech industry, Hu (2001) use the Cobb-Douglas production function model to empirically prove the relationship between government R&D funds, enterprise R&D investment, and innovation effectiveness. The results show that the R&D investment of the company has a significant impact on improving the innovation efficiency of China’s aerospace industry, while the R&D expenditure of the government has no significant impact on improving the innovation efficiency of other industries. The government’s investment in R&D will have an impact on the company's R&D. For every 1% increase in the government’s investment in R&D, the enterprise's investment in R&D will increase by 1.58%. Kang & Park (2012) takes the small and medium-sized biotechnology industry in South Korea from 2005 to 2007 as an example. The article holds that the government’s direct R&D funding for R&D projects can greatly stimulate the enthusiasm of companies for innovation activities, and enable enterprises to invest more money in R&D. Mamuneas (1999) selects statistics from six industries to analyze the short-term impact of government R&D subsidies. The research finds that although the government R&D subsidy will increase the burden of enterprises' innovation activities and improve innovation efficiency, it will also hinder the spillover effect of government R&D subsidy on the high-tech industry.
Hong et al. (2016) used data from 2002 to 2011 in China's high-tech industry, and used stochastic frontier production functions to explore the impact of government funding on industrial innovation. The analysis results show that government grants have a
positive effect on innovation in the medical and aircraft and spacecraft sub-industries, and have a negative impact on electronic and communications equipment, computers and office equipment, and medical equipment and measuring instrument sub-industries. These results may mean that the Chinese government should optimize the structure of government funding allocations and provide additional funding for the pharmaceutical and aircraft and spacecraft sub-industries.
Based on the review of scholars' research results, this paper, with Hong et al.(2016) as main reference, uses the stochastic frontier analysis method and the statistical data of 29 provinces of China's high-tech industry from 2010 to 2017 to explore the impact of government R&D funds on the innovation efficiency of high-tech industry.
4.Methodology
4.1 Methods
Innovation efficiency is the ratio of input to output (Hollanders & Arundel, 2007; Guan & Chen, 2010). In efficiency research, most scholars use the following two measurement methods: non-parametric models, such as data envelopment analysis (DEA); the other is a parametric model, such as stochastic frontier analysis (SFA). DEA measures and decomposes the innovation efficiency of high-tech industries through unrestricted variables and linear programming but ignores low management efficiency and environmental factors. The result may be that the estimated efficiency value is too high (Wang et al., 2016). The SFA two-step method is mainly used to estimate the innovation efficiency value of high-tech industries. This method considers the problems of environmental random interference and low efficiency of high-tech industry management. This method is greatly influenced by the industry and lacks the spatial distribution characteristics of innovation efficiency (Han, 2010). For this article, it is more meaningful to use SFA to measure efficiency, because it can distinguish different units of efficiency, allow statistical noise, and effectively control heterogeneity. The SFA efficiency measure is based on the average parameter value of the regression model, so it is not very sensitive to data fluctuations of single or multiple companies, which makes SFA more suitable for industrial research than non-parametric models (Kumbhakar & Lovell, 2003; Wang, 2007; Lieberman & Dhawan, 2005).
This article uses the provincial panel data of the high-tech industry from 2000 to 2016. Because the panel data can account for some heterogeneous effects, which may be beyond the control range of using the cross-sectional method of individual influence mixing. This can be achieved by introducing “individual (unobservable) effects”, for
example, 𝜎𝑖 changes with time and does not interact with other variables
(Rashidghalam et al, 2016). This reduces the impact of residuals while continuing to use the significance test for general coefficients.
Understanding the information that the unit changes with time can also check whether the unit inefficiency persists with time, or whether the unit inefficiency changes with time. One factor of inefficiency may persist with time, while another part may change over time. Regarding individual effects that change over time, a related key question to consider is whether individual effects are persistently inefficient or whether they are ineffective and persistent unobservable heterogeneity (Rashidghalam et al, 2016). At the same time, it should be considered whether the individual effect is a fixed parameter or a random variable (Kumbhakar et al., 2015). Therefore, information about the persistence and temporal differences of inefficient effects and their separation from unobserved heterogeneity effects is important in decision-making.
The research outlines a five panel data model based on assumptions about inefficient
time behavior. All models consider inefficiency to bespecific to industry individuals.
Based on our basic assumptions about inefficient time behavior, we use five panel data
models.The five models are Battese and Coelli (1995) model, Greene (2005 a, b) true
fixed effect and true random effect model, Kumbhakar and Heshmati (1995) model, and Kumbhakar, Lien, and Hardaker (2014) model. Models 1-3 separate inefficiency effects from unobserved individual heterogeneity effects. Models 4 and 5 separate persistent inefficiencies and time-varying inefficiencies from unobservable individual heterogeneity effects. Table 1 summarizes these five models.
The general form of the SFA production function is:
𝑦 = 𝑓(𝑋𝑖𝑡; 𝛽) + 𝜖𝑖𝑡 (1)
𝜖𝑖𝑡 = 𝑣𝑖𝑡− 𝑢𝑖𝑡 (2)
𝑇𝐸𝑖𝑡 = exp(−𝑢𝑖𝑡) (3)
𝑣𝑖𝑡~𝑁(0, 𝜎𝑣2) (4) 𝑢
The stochastic frontier production function proposed a random boundary model with compound perturbation terms based on the deterministic production function. The main
idea is that the random disturbance term 𝜀 should be composed of 𝑣 and 𝑢. 𝑣 is a
random error term, an influencing factor beyond the control of the enterprise, with randomness, used to calculate system inefficiency. 𝑢 is the technical loss error term, which is an influencing factor that the company can control and can be used to calculate the technical inefficiency.
Model 1: Battese and Coelli (1995)
Battese and Coelli (1995) model inefficiency u function (2) in the stochastic frontier model.
𝑈𝑖𝑡 = 𝑍𝑖𝑡𝛿 + 𝑊𝑖𝑡 (6)
Among them, the random variable W is defined by the cutoff 𝜎2 of the normal
distribution with zero mean and variance, so that the cutoff point is −𝑍𝑖𝑡𝛿, which is
𝑊𝑖𝑡 ≥ −𝑍𝑖𝑡𝛿. These assumptions are consistent with the non-negative truncation of U
is N (𝑍𝑖𝑡𝛿, 𝜎2) distribution.
Model 2-3: Greene (2005 a, b) true fixed effect and true random effect model
Greene (2005 a, b) proposed two models, which he called the “true” fixed-effect frontier model and the “true” random-effect frontier model. The purpose of these models is to eliminate technical efficiency brought about by the heterogeneity of industries or industries effect. The “true” fixed-effect model and the “true” random-effect frontier model (we label it model 2-3) are specified as:
𝑦𝑖𝑡 = 𝛼𝑖 + 𝑥𝑖𝑡′𝛽 + 𝑣𝑖𝑡− 𝑢𝑖𝑡 (7)
𝑢𝑖𝑡~𝑁+(0, 𝜎
𝑖𝑡2) = 𝑁+(0, exp (𝜔𝑢0+ 𝑍𝑢,𝑖𝑡′ 𝜔𝑢) (8)
𝑣𝑖𝑡~𝑁(0, 𝜎𝑣2) (9) 𝜔
𝑖~𝑁+(𝜇, 𝜎𝜔2) (10)
If we regard 𝛼𝑖 as a fixed parameter that is not inefficient, the model will become the
“true fixed effect” panel stochastic frontier model (Greene, 2005a), which is the Model
2 understudy. When 𝛼𝑖 is regarded as a random variable, the model is called the “true
random effect” panel random frontier model, called Model 3, and is used in this article. The purpose of these models is to eliminate industies heterogeneity or industries effects resulting from technical efficiency.
Model 4: Kumbhakar and Heshmati (1995)
Kumbhakar and Heshmati (1995) proposed industries-specific (time-invariant) components and time-varying residual components, which assume that the technical efficiency of the model is low. They believe that identifying persistent inefficiencies may be important because it reflects that management and other investments vary from industires, but there is no difference over time. The difference between Kumbhakar and Heshmati (1995) is that persistent and residual inefficiency are significant because they have different policy implications. Therefore, our model 4 is the model specified by Kumbhakar–Heshmati:
𝑦𝑖𝑡 = 𝛼0+ 𝑓(𝑥𝑖𝑡′; 𝛽) + 𝑣𝑖𝑡− 𝜂𝑖− 𝑢𝑖𝑡 (11)
Where Vit is the noise. 𝜂𝑖 ≥ 0 means persistent technical inefficiency; 𝑢𝑖𝑡 ≥ 0 means
time-varying inefficiency. 𝜂𝑖+ 𝑢𝑖𝑡 is overall technically inefficient. It is assumed that
the error components are independent of each other and xit. For estimation, we rewrite
(12) as:
𝑦𝑖𝑡 = 𝛼0∗ + 𝑓(𝑥𝑖𝑡′; 𝛽) + 𝑣𝑖𝑡− 𝜂𝑖∗− 𝑢𝑖𝑡∗ (12).
Where 𝛼0∗ = 𝛼0− 𝐸(𝜂𝑖) − 𝐸(𝑢𝑖𝑡) 𝑢𝑖𝑡∗ = 𝑢
𝑖𝑡 − 𝐸(𝑢𝑖𝑡) and 𝜂𝑖∗ = 𝜂𝑖 − 𝐸(𝜂𝑖).
The model can be calculated in three steps. In step 1, we estimate equation (12). This
gives a consistent estimate of 𝛽. We also obtained the predicted values of 𝜂𝑖∗ and 𝑢𝑖𝑡∗,
which is a by-product of using the random effect panel model. The 𝜂𝑖∗ estimate provides
the best linear predictor for random individual effects. Please note that in step 1, we
used a pure random effect panel model. In step 2, the predicted value of 𝜂𝑖∗ is used to
estimate continuous technical efficiency. Finally, the persistent technical efficiency
measure (PTE) is obtained from exp (𝜂𝑖∗). In step 3, the remaining technical efficiency
is estimated. Then we can get 𝛼0, 𝜎𝑣2, and 𝜎2. Then we use the 𝑢̂ to calculate residual 𝑖𝑡
technical inefficiency 𝑅𝑇𝐸 = exp (− 𝑢̂ ). Then find the overall technical efficiency 𝑖𝑡
defined as the product of PTE and RTE. OTE = PTE * RTE. (Kumbhakar et al., 2014)
Model 5: Kumbhakar, Lien, and Hardaker (2014)
Model 5 is modified and expanded to include random effects.In this model, the error
term is divided into four parts. Considering the different factors that affect input and output, the error term is separated into four parts. The first element reflects the industries potential heterogeneity (Greene, 2005a, 2005b), which must be distinguished
from the effects of inefficiency. The second captures short-term (time-varying) inefficiencies. Third, as Kumbhakar & Hjalmarsson (1995) and Kumbhakar & Heshmati (1995) find that persistence or timeliness is ineffective. The last part captures random shock. Then, final model is Kumbhakar et al. (2014) model, which is specified as:
𝑦𝑖𝑡 = 𝛼𝑖 + 𝑓(𝑥𝑖𝑡′; 𝛽) + 𝜇𝑖+ 𝑣𝑖𝑡− 𝜂𝑖 − 𝑢𝑖𝑡 (13)
The single-stage ML stimulation method can be used to estimate the distribution hypothesis of the four components based on the model in (13) (Colombi et al., 2011). To this end, we rewrite the model in (14) as:
𝑦𝑖𝑡 = 𝛼0∗+ 𝑓(𝑥𝑖𝑡′; 𝛽) + 𝛼𝑖 + 𝜖𝑖 (14)
Where 𝛼0∗ = 𝛼0− 𝐸(𝜂𝑖) − 𝐸(𝑢𝑖𝑡) and 𝛼𝑖 = 𝜇 − 𝜂𝑖 + 𝐸(𝜂𝑖). In the first step, we use
standard random effects panel regression to estimate. This program also gives the
predicted value of 𝛼𝑖 and it 𝜖𝑖. In the second step, we estimate the time-varying
technical efficiency 𝑢𝑖𝑡. In the last step, we estimate 𝜂𝑖 to follow steps like step 2.
Then, we can estimate the persistent technical efficiency based on 𝑃𝑇𝐸 = −exp (𝜂𝑖).
The overall technical efficiency OTE is obtained from the product of PTE and RTE, i.e. OTE = PTE * RTE (Kumbhakar et al., 2015).
Table 1. The characteristics of the five panel data models investigated
SFA model BC95 TFE TRE KH95 KLH14
model 1 model 2 model 3 model 4 model 5
General effect Fixed Fixed Random Fixed Random
Technical inefficiency
Persistent No No No Yes Yes
Residual No No No Yes Yes
Overall technical
inefficiency No No No Yes Yes
Mean Time-inv Time-inv Zero trunc Zero trunc Zero trunc
Variance Hetero. Hetero. Hetero. Homo. Homo.
Symmetric error term
Variance Hetero. Hetero. Hetero. Homo. Homo.
Time-inv. Mean inefficiency models include determinants of inefficiency in the mean function. Zero truncation models assume inefficiency distribution to be half- normal.
Hetero. (Homo.) refers to models in which variances are functions of covariates that are both province-specific and time-varying (constant).
4.2 Variables
According to the basic principle of efficiency measurement, the evaluation system of high-tech industry innovation efficiency is constructed from the input and output variables, and the key influencing factor system of efficiency value is established.
4.2.1 Output variables
This article selects the sales revenue of new products (Y1) and the number of patent applications (Y2) as the variables of innovative production output of high-tech industries. In academia, the choice of the output for innovative products is controversial because some inventions are not patented, so the output varibales cannot fully reflect the output of innovative products (Griliches, 1998). Moreover, due to differences in patent quality, not all patents have the same economic value (Wu, 2006). Due to time lag, there is an inconsistency between patent applications and patent grants, and patent grants may change. Scholars try to find new indicators, such as the number of new product projects (Feng et al., 2006; Wu, 2008) or new product sales revenue (Zhang et al., 2003; Zhu & Xu, 2006). Therefore, the number of valid patent applications is selected as the direct output of high-tech industry innovation, and the sales revenue of new products is selected as the indirect output of high-tech industrial innovation. This paper selects two variables of new product sales revenue (Y1) and the number of patent applications (Y2) as indicators of innovation output to comprehensively research the impact of government subsidies on high-tech product innovation efficiency.
4.2.2 Input variables
Capital expenditure (K), R&D personnel (L), and government subsidies (Gov) were used as input variables to analyze the innovation efficiency of high-tech industries. Capital expenditure (K) input variable is a variable used to measure investment in technological innovation. The high-tech industry is one that needs a lot of capital investment. Capital investment has a big impact on its efficiency. The estimated R&D capital stock of the high-tech industry is the annual incremental stock of all regions in the sample period.
Here, Kit and Ki (t-1) represent the capital stock of region i, time t, and t-1. δ is the
depreciation rate. Based on Wu’s (2006) estimation and assumption of the R&D
depreciation rate, this paper uses δ = 15%. Where ΔKit is the value of the R&D capital
stock. If the initial stock of R&D funds for District i in 2000 is Ki, 2000, then formula
(15) can be converted to formula (16).
𝐾𝑖𝑡 = 𝐾𝑖,2000(1 − 𝛿)𝑡−2000+ ∑𝑡−2000−1(1 − 𝛿)𝑗
0 ∆𝐾𝑖,𝑡−𝑗 (16)
In the above formula, the unknown is the value of the R&D capital stock in 2000. Some scholars have tried to estimate China’s total R&D capital stock in 2000(Lin & Wang, 2019; Lei et al. 2017, Wei, 2016).
R&D personnel is denoted by L. This article has selected full-time equivalent R&D personnel. The increase in the stock of human capital is conducive to the improvement of labor quality in high-tech industries. As Griliches (1980) pointed out, the impact of R&D activities on knowledge production will not only be reflected in the current period but also the future knowledge production.
Government subsidies R&D is expressed in Gov. This article has chosen government expenditure on R&D of high-tech industries. In general literature, government subsidy is only used as an efficiency factor, while the innovation in this paper uses government subsidy as an output variable, because government subsidy will increase the output of innovative products in industries.
4.2.3 Efficiency factors
Innovation is a complex and dynamic system process. This paper selects five variables as efficiency factors: government support intensity (RD), enterprise size (Indu), degree of enterprise opening (Open), labor quality (Labor), and export delivery (Export). (i) RD expresses the government’s support intensity, which is the ratio of government R&D expenditures to the national R&D expenditures in the year t of province i, which is used to reflect the impact of government support on the technical inefficiency of R&D activities.
(ii) Indu stands for the scale of industrial enterprises, which is the ratio of the actual main business income in the year t of province i to the number of high-tech enterprises
and is used to reflect the influence of the scale of enterprises on the inefficiency of R&D activity technology.
(iii) Open indicates the degree of opening to the outside world, which is the ratio of the actual export delivery value of the high-tech industry in the year i to the ratio of the main business income of the year, which is used to reflect the impact of the degree of opening to the outside world on the technical inefficiency of R&D activities.
(iv) Labor stands for the quality of the R&D researched labor force. It is the ratio of the total number of high-tech industry R&D personnel in the year i and t to the total number of high-tech industry employees. It is used to reflect the impact of labor quality on the efficiency of R&D activities.
(v)Export delivery indicates the degree of export delivery. It is the ratio of the export
delivery value of new products in the hi-tech industry in the t-th year of i province to the sales revenue of new products.
Table 2. Indicators and symbols for the stochastic frontier production model
Name Symbol The specific meaning of the indicator
The sales revenue of
new product Y1
Total sales of the new products in high-tech industries
The number of patent
applications Y2
The number of patent applications for high-tech industries
Capital expenditure K The stock of Internal Expenditure for High-tech
Research Funds
R&D personnel L Full-time equivalent of scientific and
technological personnel in high-tech industries
Government Subsidies Gov Government R&D subsides in high-tech
industries Government support
intensity RD
Expenditure on R&D expenditure in high-tech industries/R&D expenditure
Enterprise size Indu Actual high-tech industry revenue/number of
high-tech enterprises Degree of enterprise
opening Open
Actual export delivery value of high-tech industry/Main business income of the year
Labor quality Labor The full-time equivalent of R&D
personnel/Total number of employees
Export delivery Export New product export delivery/The sales of new
4.3 Data
The data sampling period selected in this article is 2000-2016, and the relevant data variables are mainly from the “China High-tech Industry Statistical Yearbook” (2001-2017). The high-tech industry innovation efficiency decision-making units are selected in this paper mainly include 29 provinces (cities, autonomous regions) such as Beijing, Tianjin, and Hebei. The high-tech industries in Tibet and Qinghai were established relatively late, with only one high-tech industry and lack of data. The decision-making departments of these two provinces were not considered.
From table 3, we can see that the values of input and output variables are exceptionally large, and we need to conduct stochastic frontier analysis and regression after mathematical processing. Through the data summary, this paper can see that the minimum values of many variables are 0, because some provinces do not have high-tech industries in certain specific years, or did not fund high-high-tech industries in that year. Through data analysis, this paper can also roughly see the uneven development of high-tech industries among various provinces and cities. When compiling the data, it was found that some provinces and cities did not have the input and output of high-tech industries in certain years. The emergence of a value of 0 does not affect the calculation
of government investment in the innovation efficiency of high-tech industries.
Table 3. Data variable observations
Variable Obs Mean Std. Dev. Min Max
y1 493 5,927,463 15,000,000 0 155,000,000 y2 493 2,323.63 6,689.87 0 64,782 K 493 356,053.20 1,213,966 0 18,100,000 L 493 12,663.53 29,324.72 0 299,986 Gov 493 30,652.20 52,139.02 0 332,334 Indu 493 2.101 1.661 0.143 7.570 Export 493 2.385 10.258 0 152.130 RD 493 0.460 0.975 0 12.687 Open 493 0.215 0.197 0.0000268 0.748 Labor 493 0.038 0.026 0 0.193
5. Empirical results
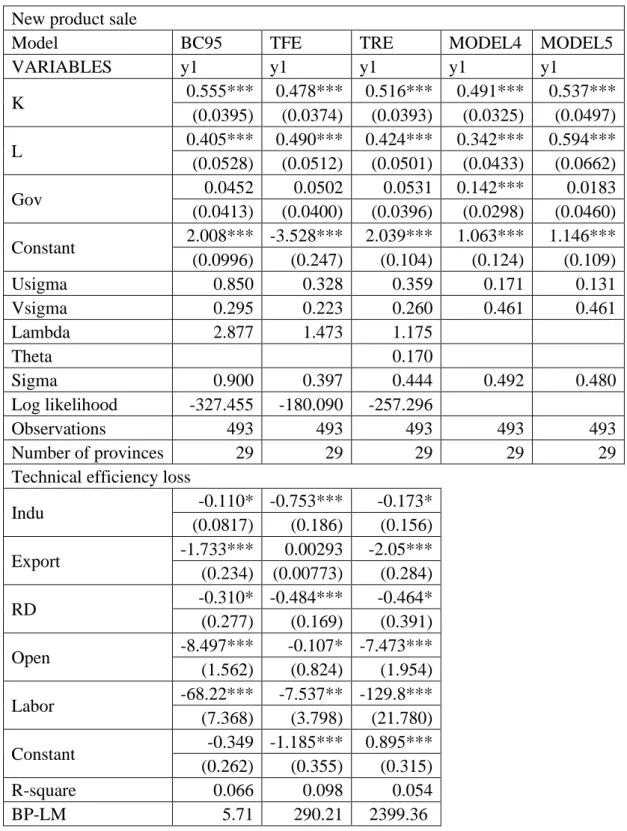
5.1 Analyze the empirical results of the sales revenue of new products
Table 4. Regression of sales revenue of the new product (Y1) of the stochastic frontier analysis for Model 1-5
New product sale
Model BC95 TFE TRE MODEL4 MODEL5
VARIABLES y1 y1 y1 y1 y1 K 0.555*** 0.478*** 0.516*** 0.491*** 0.537*** (0.0395) (0.0374) (0.0393) (0.0325) (0.0497) L 0.405*** 0.490*** 0.424*** 0.342*** 0.594*** (0.0528) (0.0512) (0.0501) (0.0433) (0.0662) Gov 0.0452 0.0502 0.0531 0.142*** 0.0183 (0.0413) (0.0400) (0.0396) (0.0298) (0.0460) Constant 2.008*** -3.528*** 2.039*** 1.063*** 1.146*** (0.0996) (0.247) (0.104) (0.124) (0.109) Usigma 0.850 0.328 0.359 0.171 0.131 Vsigma 0.295 0.223 0.260 0.461 0.461 Lambda 2.877 1.473 1.175 Theta 0.170 Sigma 0.900 0.397 0.444 0.492 0.480 Log likelihood -327.455 -180.090 -257.296 Observations 493 493 493 493 493 Number of provinces 29 29 29 29 29
Technical efficiency loss
Indu -0.110* -0.753*** -0.173* (0.0817) (0.186) (0.156) Export -1.733*** 0.00293 -2.05*** (0.234) (0.00773) (0.284) RD -0.310* -0.484*** -0.464* (0.277) (0.169) (0.391) Open -8.497*** -0.107* -7.473*** (1.562) (0.824) (1.954) Labor -68.22*** -7.537** -129.8*** (7.368) (3.798) (21.780) Constant -0.349 -1.185*** 0.895*** (0.262) (0.355) (0.315) R-square 0.066 0.098 0.054 BP-LM 5.71 290.21 2399.36
Table 4 and Appendix 1-6 show the analysis of industrial innovation efficiency of new product sales revenue (Y1) with government support.
Table 4 shows that the production function, K and L innovative production of high-tech industry (investment products) have accumulated significant positive significant effects. View of efficiency loss equation, the Breusch and Pagan (1980) of the LM evaluate a random-effects model to determine the individual effects are present, the value of BP-LM test is much larger than the critical value of 3.184. Inefficiency, Indu, Open, and Labor have a significant impact on the production of high-tech industry innovation
efficiency. Because of the inefficiency equation (2) ui is negative, so the actual impact
of the high-tech industry innovation efficiency of symbol opposite to the calculated coefficients. Government support intensity (RD) innovation efficiency improvements has significant positive impacts; the coefficient was statistically significant at the 10% level. The proportion of government funds incorporates self-financing increased by 1%, and the efficiency of innovation increased by about 0.3%. Government funds support innovation efficiency that is conducive to increased sales revenue of new products in the high-tech industry. According to technical efficiency loss of the new product sales efficiency equation, the enterprise size factor (Indu) promotes the improvement of innovation efficiency, and its significance level is 1%. It shows that the larger the scale, the better to improve the efficiency of high-tech innovation. The degree of enterprise opening (Open) indicated that the enterprise has reduced the efficiency of innovative high-tech industry of the new product sales revenue, this indicator was statistically significant only in the BC95 model. The higher the degree of openness to the outside world, the more profitable the company’s new product sales will be. The quality of labor (Labor) has passed the significance test of the three models and has a positive effect on the innovation efficiency of the high-tech industry. The labor quality coefficient is relatively large, indicating that each 1% increase in labor quality, innovation and efficiency will bring great high-tech industry. Export delivery (Export) can promote the improvement of innovation efficiency, which has statistical significance in Model 1 and Model 3. The more exports of goods, the high-tech industry innovation efficiency is higher.
In Appendix 1, Model 1 has the highest average technical efficiency (0.86), while Model 3 has the lowest average technical efficiency (0.42). As can be seen in Appendix
5, there is a difference efficiency score for each model, which represents the difference in quartiles. Model 2 has the widest distribution of efficiency scores, slightly wider than Model 3, and Model 1 has a much narrower distribution range than other models. Appendix 2 shows the kernel density distribution (the overall technical efficiency of models 5 and 6) of the technical efficiency predicted by model 1-5, and Appendix 5 shows the superposition of the first and fourth fractional values and the third and fourth fractional values of the same model each year. Various models are visible to produce different empirical distribution, and in some cases can be observed. The average technical efficiency of model 2 was the highest (0.86), while that of model 3 was the lowest (0.42). Model 3, model 4, and model 5 provide a solution for inter-firm heterogeneity. Appendix 6 lists the results of model 4 and model 5 for technical efficiency, broken down into persistent technical efficiency and time-varying technical efficiency. Persistent technical inefficiency in model 4 is the lowest initial estimate of overall technical efficiency. In other words, some potential fixed effects may have been captured in the inefficient measures since the distribution of Appendix 8 appears to be confirmed. The average continuous technological efficiency in model 4 overlaps 0.535 and the average residual technological efficiency is complex. These results show that in the high-tech industry, continuous technological inefficiency is greater than the remaining technological inefficiency, which is 0.733. As showed in model 5 at the bottom of Appendix 7, the extension of continuous technical efficiency is significantly higher than the extension of remaining technical efficiency. Assuming that all continuous noise is invalid (model 4) or that no industry-specific impacts are invalid (models 2 and 3), then these assumptions are incorrect. Model 5 overcomes these problems by decomposing the duration of the noise into a stabilizing effect and an ineffective effect of the persistence technique. The result is an efficiency overlap between model 3 and model 4 (Appendix 4). Compared with model 4 and model 5 has a more efficient persistent technique (0.623).
Efficiency focus is extremely sensitive to model specification. So, how do the different specifications used to affect the technical efficiency level of the high-tech industry? Appendix 2, pair-order correlations of models 1-5 (overall technical efficiency of models 4 and 5) illustrate the differences between model technical efficiency level models. Based on the comparison between Appendix 3 and Appendix 6, we can conclude that the relationship between model 4 and model 5 indicates that the Kendall
level correlation between model 4 and model 5 for the measurement of sustainable technical efficiency is 0.96. Also, the efficient evaluation of the residual technical efficiency of the two models is completely positively correlated, while the results based on persistent and residual technical efficiency are largely independent or random, with a rank correlation coefficient of 0.15.
5.2
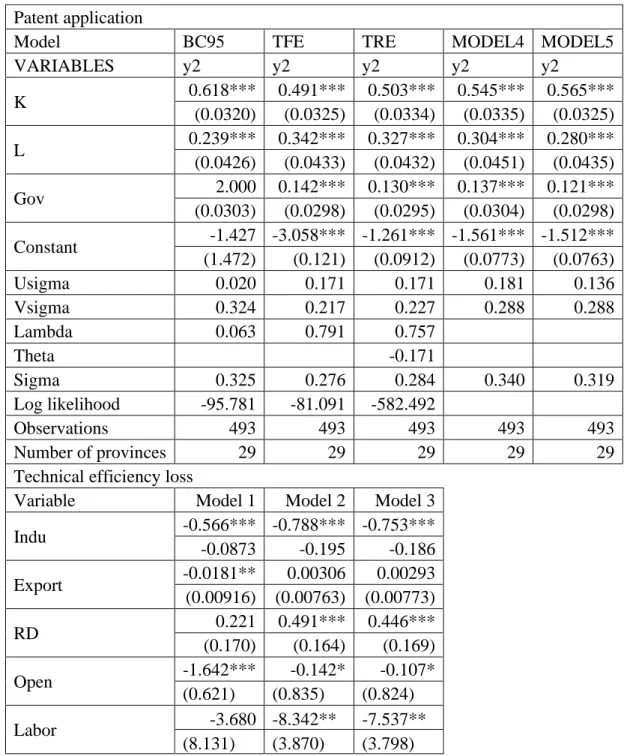
Analyze the empirical results of the number of patent applications
Table 5. Regression of the number of patent applications (Y2) of the stochastic frontier analysis for Model 1-5.
Patent application
Model BC95 TFE TRE MODEL4 MODEL5
VARIABLES y2 y2 y2 y2 y2 K 0.618*** 0.491*** 0.503*** 0.545*** 0.565*** (0.0320) (0.0325) (0.0334) (0.0335) (0.0325) L 0.239*** 0.342*** 0.327*** 0.304*** 0.280*** (0.0426) (0.0433) (0.0432) (0.0451) (0.0435) Gov 2.000 0.142*** 0.130*** 0.137*** 0.121*** (0.0303) (0.0298) (0.0295) (0.0304) (0.0298) Constant -1.427 -3.058*** -1.261*** -1.561*** -1.512*** (1.472) (0.121) (0.0912) (0.0773) (0.0763) Usigma 0.020 0.171 0.171 0.181 0.136 Vsigma 0.324 0.217 0.227 0.288 0.288 Lambda 0.063 0.791 0.757 Theta -0.171 Sigma 0.325 0.276 0.284 0.340 0.319 Log likelihood -95.781 -81.091 -582.492 Observations 493 493 493 493 493 Number of provinces 29 29 29 29 29
Technical efficiency loss
Variable Model 1 Model 2 Model 3
Indu -0.566*** -0.788*** -0.753*** -0.0873 -0.195 -0.186 Export -0.0181** 0.00306 0.00293 (0.00916) (0.00763) (0.00773) RD 0.221 0.491*** 0.446*** (0.170) (0.164) (0.169) Open -1.642*** -0.142* -0.107* (0.621) (0.835) (0.824) Labor -3.680 -8.342** -7.537** (8.131) (3.870) (3.798)
Constant -0.744*** -1.164*** -1.185***
(0.231) (0.362) (0.355)
R-square 0.095 0.063 0.098
BP-LM 3492.170 3019.33 2826.79
Table 5 and Appendix 9-14 shows the innovation efficiency analysis of patent applications (Y2) with government support.
Since the ui value in the inefficiency equation (2) is negative, the actual impact on the high-tech industry is opposite to the sign of the calculated coefficient. Improvements in the efficiency of government supported intensity (RD) innovation has a significant reduction, and model 2 and model 3 pass the significance test. Government funding increases by 1% and innovation efficiency falls by about 0.5%. The more the government subsidizes, the less efficient the innovation will be in the patent application of the high-tech industry. The inconsistency between the efficiency of government funding on the number of patent applications and the sales of new products also verifies the uncertainty of the effect of government funding on innovation efficiency in the literature. According to the results of the regression technical efficiency loss of patent, enterprise size factor (Indu) promotes innovation and efficiency, the significance level of 10%. It shows that the larger the enterprise, the more beneficial it is to improve the efficiency of high-tech innovation. The degree of enterprise opening (Open) indicates that the enterprise-scale promotes the improvement of innovation efficiency, which is of statistical significance in the BC95 model. Labor quality (Labor) has passed the significant test of model 2 and model 3. The labor quality coefficient is relatively large, indicating that every 1% increase in labor quality will increase the innovation efficiency of the high-tech industry. Export delivery (Export) can promote the improvement of innovation efficiency, which is of statistical significance in model 1. The more goods are exported, the more efficient innovation will be in high-tech industries.
Appendix 8 shows in the correlation between the pairing order of models 1-5. The correlations between model 1 and model 4 and between model 2 and model 5 are high. Appendix 9 shows the Kendall rank-order correlation of persistent technical efficiency indicators between model 4 and model 5. There was a significant positive correlation between the technical efficiency evaluation and the rank of the two models, with the order correlation being 0.98. The results based on persistent and residual technical efficiency are independent.
Appendix 10 shows the kernel density distribution for the estimated technical efficiency of models 1-5 (the total technical efficiency of models 5 and 6), and Appendix 11 shows the model with the same score for the first quartile and the third quartile. Different models will produce different empirical distribution. Model 2 has the widest distribution of efficiency scores, which is higher than Model 1. In model 2 (“true” fixed effects) and model 3 (“true” random effects), the industry effect is not considered to be inefficient.
Appendix 12 plots the results of the technical efficiency of model 4 and model 5, which are broken down into persistent technical efficiency and time-varying technical efficiency. One problem with model 4 is that all time-invariant noises are measured as continuous technical inefficiencies. It is reasonable that the persistent technical inefficiency in model 4 is the main reason for the low overall technical efficiency estimate. The average continuous technical efficiency score in model 4 is 0.54, and the average residual technical efficiency score is 0.63. As showed in Appendix 12 (model 5), the extended range of continuous technical efficiency is significantly higher than the extended range of the remaining technical efficiency. The results based on persistent and residual technical efficiency are negatively correlated to a large extent. Appendix 9 shows that the Kendall level correlation between model 4 and model 5 for the persistent technology efficiency measure is 0.96. Also, the efficient evaluation of the residual technical efficiency of the two models is completely positively correlated, and the results based on persistent and residual technical efficiency are largely independent or random.
By comparing the technical efficiency loss from Table 4 and Table 5 of Y1 and Y2, we can find that the enterprise size (Indu), labor quality (Labor), degree of enterprise opening (Open) and export delivery (Export) factors have a positive impact on new product sales and patent applications in the high-tech industry. Government support (RD) has opposite effects. The larger the scale of the enterprise, the higher the efficiency of enterprise R&D and innovation. The higher the quality of employees, the more talents companies can use to develop innovative products. The openness and export performance of an enterprise is a better way for an enterprise to sell innovative products and help the enterprise recover the initial capital in order to invest in new product development. There are two aspects of government investment. A certain
percentage of government funds will encourage companies to increase R&D investment, but more than a certain percentage of companies will squeeze out corporate funds. Our conclusions are different for the innovation efficiency of the two output products. This also verifies that the government subsidies in the previous literature have produced innovation efficiency in academic articles. Another part of the scholar's article has a positive effect on innovation efficiency. Through the analysis of this article, it can help the government to make more reasonable subsidies to improve the innovation efficiency of the high-tech industry.
6. Efficiency analysis of China’s high-tech industry
This paper investigates technical efficiency and its determinants of innovation in China’s high-tech industry. This article uses five stochastic frontier models that take into account different efficiency from time-varying/constant technologies, as well as inefficient technologies and province-specific heterogeneous effects. Analysis was applied to the inefficiencies equations of high-tech industries in 29 provinces during the 17 years from 2000 to 2016. Above empirical results reflect the relationship between innovation and efficiency of government subsidies for R&D, innovation and other input factors affects the efficiency effect.
Government subsidies (RD) play a dual role in improving the innovation efficiency of China’s high-tech industry. In sale of new products, government subsidies can improve
innovation efficiency.This result as same as Bérubé & Mohnen (2009), Asheim et al.
(2011), and Alecke et al. (2012) that government subsidies have positive impact on innovation efficiency. In patent applications, government subsidies will reduce innovation efficiency. This result as same as the analysis by Qing (2013), Bai and Li (2011) and Hong (2016) that government investment from China has a negative impact on innovation efficiency of high-tech industry.
Due to uncertainty of R&D returns, companies and governments often face huge risks, which greatly weaken their innovation enthusiasm. Currently, government needs to provide R&D subsidies to reduce risk of innovative investment and increase likelihood of success. However, government subsidies usually do little to improve efficiency of corporate innovation. Government subsidies R&D projects sometimes fail to meet
market demand, and due to investment lag, production of patents and new technologies is usually several years later than the investment cycle. Also, some companies will use government subsidies to replace R&D investments to reduce their R&D costs. Imperfect supervision policy of the Chinese government on government funds will cause some enterprises to use government subsidies for another purpose, thereby reducing the contribution of government subsidies to enterprise innovation. For enterprises, they are more sensitive to market demand than government, so they will increase R&D of new technologies and new patents, to obtain more profits. Empirical conclusions of this paper also indirectly prove importance of China’s market economic reform and the necessity of replacing innovations by government R&D institutions with enterprises as the main part of R&D.
Enterprise size (Indu) has a significant effect on innovation efficiency of high-tech industries because China’s high-tech industries are mostly concentrated in high-tech industrial parks. Each industrial park will plan and configure a high-tech industrial chain. High-tech enterprise clusters are formed on a large scale, which will strengthen collaborative development between enterprises, better allocate industrial resources, and more efficiently develop products and apply for patents.
Labor quality (Labor) has a more significant role in innovation efficiency of high-tech industry. Reason is that China's high-tech industry is still a talent-intensive industry, and contribution of talent research and development is higher. Besides, China has the largest number of high-tech talents in the world, who are concentrated and mobile, thus accelerating talent iteration and upgrading of high-tech industry.
Export delivery (Export) and degree of enterprise opening (Open) have a positive role in high-tech industry innovation efficiency. As China’s export trade is an important factor in China's economic development, more high-tech enterprises opening to the outside world, greater opportunity for their export products. Exporting products will increase sales revenue, increase profits for enterprises, and stimulate enterprises to invest more in R&D for new products. Through continuous innovation, the company has consolidated its leading position in the market with innovative products.
From analysis of two efficiency equations, innovation efficiency of new product sales revenue (Y1) and number of patent applications (Y2) are different. Government