Open Data from Copernicus
Opportunities for climate change adaption
Swedish Agency for Marine and Water Management Date: 13.12.2017
Publisher: Jakob Granit Photo: Thomas Klein ISBN 978-91-87967-90-0 Printer: Digital publication
Open Data from Copernicus
Opportunities for climate change adaption
This report has been prepared by the Swedish Agency for Marine and Water Management (SwAM) in collaboration with the Swedish Civil Contingencies
Agency (MSB), Swedish Environmental Protection Agency (Swedish EPA) and Swedish National Space
Board (SNSB). The agencies are responsible for the content and conclusions of the report.
The authors of the report are Thomas Klein, SwAM, Susanne Ingvander, MSB, Anna Maria Johansson, Swedish EPA and Göran Boberg and Björn Lovén,
SNSB.
Foreword
Digitalisation and smarter environmental data create new opportunities to
increase knowledge about the environment and sustainable development. Climate change is a key issue for our own and future generations. In order to limit climate change, a global energy shift is required. At the same time, we need to facilitate climate change adaptation of society and the environment to meet the now unavoidable effects of climate change. Digitalisation can support our work to implement this energy shift and climate change adaptation.
The European Union’s Copernicus programme is a world leader in collecting environmental data on the Earth’s climate and other global systems. The EU has highlighted Copernicus as a flagship programme for sustainable growth and innovation. Copernicus is a long-term investment that will provide high-quality environmental information, which can be trusted by users, for many decades to come. The programme is also unique in that its data is openly accessible. The development of Copernicus has been made possible by substantial investments by Member States through the European Space Agency (ESA) and the EU. The EU also allocates substantial funds for the operation of the programme. An advanced system of dedicated satellites monitors the environment, making a large number of daily observations that provide valuable data about our oceans, ice conditions, land and atmosphere. Copernicus thematic services combine data obtained from satellites with in situ measurements from sensors on land, at sea or in the air, as well as models, in order to create a range of information and services for
application in a variety of areas. These data and services can teach us a great deal about changes, trends and interactions in the environment.
Environmental data from Copernicus can support the sustainable management of oceans, rivers, lakes and land environments in many ways. One important area of use highlighted in our report is climate change adaptation. It is a matter of urgency that public authorities, researchers and developers capitalize on the investment made in Copernicus and draw benefit from the programme’s data and services to a greater extent. In part, Copernicus offers ready-to-use products that can already meet certain management needs. In addition, Copernicus also
provides open satellite data. This gives users the opportunity to create customised products. Here, there may be a need to develop methods and collaborate
nationally. One example of this is the national land cover project (NMD), implemented by the Swedish Environmental Protection Agency in collaboration with several other Swedish government agencies. In parallel, the Swedish Agency for Marine and Water Management is currently investigating possibilities for an increased use of satellite data in monitoring marine and freshwater environments.
The opportunities offered by Copernicus are many and varied. Our intention in compiling this short report is to assist users involved in climate change adaptation to discover Copernicus. We hope that the examples discussed in the report will provide inspiration, by showing how Copernicus can support Swedish initiatives on climate change adaptation at a national, regional and local level.
SUMMARY ... 7
INTRODUCTION ... 9
Copernicus in brief ... 9
Challenges ... 9
Background and purpose ... 10
RESULTS AND DISCUSSION ... 11
Copernicus – an Earth Observation programme for environment and security 11 About satellites and data reception ... 11
Access to satellite data ... 12
Satellite data and climate change ... 15
Thematic services ... 19
Land Monitoring Service ... 20
Marine Environment Monitoring Service ... 22
Atmosphere Monitoring Service ... 23
Emergency Management Service ... 25
Climate Change Service ... 28
Security Service... 31
CONCLUSIONS AND NECESSARY DEVELOPMENTS... 32
APPENDIX ... 34
B1: Swedish governmental agency network for climate change adaptation ... 34
B2: Swedish public authority cooperation on Copernicus... 34
Summary
The European Earth Observation initiative Copernicus is a world-leading user-driven programme for the collection and dissemination of data on the Earth's environment, climate and security (Copernicus 2017). Data collection is largely carried out using satellites. Copernicus data are processed and provided freely and openly. This data policy also includes data delivered in the form of user-adapted services. Copernicus currently has six thematic services that meet data and information needs in the areas of climate, marine, land and freshwater, atmosphere, emergency management and security. The services can be adapted to local and regional needs. One important area of use of Copernicus data is climate change adaptation. Copernicus has a long-term planning horizon. This is a prerequisite for the reliable detection and assessment of environmental changes, which then can underpin informed decisions. In order to create societal benefits, the programme's data and services need to be widely used. This report helps users in the field of climate change adaptation discover Copernicus and provides some concrete examples of how the programme can support Swedish work on climate change adaptation.
Sweden is covered several times a week by satellites that observe the marine, terrestrial and atmospheric environment. The European space organizations ESA and EUMETSAT have the mandate of the European Commission to collect, store and provide satellite data from Copernicus as a basis for a wide range of applications, research and data-driven innovation. All data on Swedish territory are transferred automatically from ESA to the Swedish platform Swea, run by the Swedish National Space Board (Swedish National Space Board 2017). Swea is a satellite data portal containing a web interface and an open application programming interface (API). It is possible to search for and download data from Sentinel satellites (Sentinel 1-3) and the US Landsat satellites free of charge. Data in Swea are geo-corrected according to Swedish reference systems, elevation models and map projections, facilitating use and processing of satellite images in various geographic information systems and image processing programs applied by Swedish users.
The European Commission is also preparing its own central data infrastructure – Copernicus Data and Information Access Services (DIAS). DIAS will ensure fast and secure access to data as well as access to computational capacity to process large amounts of data.
Satellite images from Copernicus provide comprehensive and continuous information about the state of the environment, infrastructure and urban areas. This makes it possible to detect and follow long-term trends and changes in terrestrial or aquatic environments. An example of this is the large forest fire in Västmanland in 2014 when the Swedish Civil Contingencies Agency (MSB) took advantage of the Copernicus Emergency Management Service to get tailor-made scenarios and interpretations on the fire area. Another example is
drought where satellite images can identify changes in vegetation, but also in areas that dry out due to changes in water levels. Copernicus also provides information about water properties such as temperature, algal blooms,
chlorophyll, suspended matter and humus which can support the assessment of water quality.
The national land cover data project (NMD) coordinated by the Swedish Environmental Protection Agency (Swedish EPA) aims at creating and managing information about the landscape and how it changes (Swedish EPA 2017a). Data from this project will be nationwide, updated every five years and hence be comparable. NMD will support climate change adaptation in various societal sectors on issues such as nature protection and conservation, urban environments and fire risks.
Several Copernicus thematic services provide data and information of relevance to climate change adaptation. The Copernicus Land Monitoring Service hosts, among other, data on European land cover as well as high-resolution data on permanent water bodies, wetlands, forests and impervious surfaces. Main application areas for the Copernicus Marine Environmental Monitoring Service are maritime safety, observation of coastal and marine environments, planning support, marine resources and support to weather prediction, seasonal
forecasts and climate observations. The Copernicus Atmosphere Monitoring Service offers daily and delayed-mode computations of atmospheric
composition, air quality and atmospheric pollen contents. The combination of heat waves and poor air quality can cause major health problems, especially in urban environments. The Copernicus Emergency Management Service uses satellite images as its main data source and has worldwide coverage. In the event of a crisis, MSB can activate the service. The Emergency Management Service is an important tool for climate change adaptation and has been used by Sweden in response to storms, fires and floods.
The Copernicus Climate Change Service uses environment and climate
observations from satellite and in-situ measurements combined with models of the Earth's atmosphere, sea, land, freshwater and ice. The Copernicus Climate Change Service will support work on climate change mitigation and in
particular climate change adaptation in many sectors, including water management, coastal planning, agriculture and forestry, transport, energy, health, nature and ecosystems, infrastructure, risk reduction and disasters. The EU Earth Observation programme Copernicus thus offers a rapidly
expanding amount of data that can support climate change adaptation in many ways and in many areas. This report provides a brief and easy-to-understand overview of Copernicus and illustrates the use of Copernicus in climate change adaptation by some simple examples. The amount of Copernicus data in support of climate change adaptation will increase further. At the same time, access to and handling of Copernicus data will improve. This will in turn improve the opportunities for the use of Copernicus in climate change
adaptation. However, in order to achieve a more widespread use of Copernicus data there is a need for complementary efforts on knowledge building,
communication and good examples that focus on the specific needs and challenges encountered by climate change adaptation users. There is also a need for skills development so that today's users, from government to research and business, easily can benefit from Copernicus data and services.
Introduction
Copernicus in brief
The European Union’s Earth Observation programme Copernicus (Copernicus 2017) provides a new source of ever-increasing amounts of open environmental data1. Copernicus is a long-term programme that provides both satellite data
and thematic services to assist work on environment, climate and security issues. The development of the programme is driven by user needs. The Copernicus services address six main thematic areas: climate change, land, marine environment, atmosphere, emergency management and security. Through Copernicus’ open data and services, a wide range of users can receive continuous, regular and reliable data that provides a comprehensive image of environmental conditions, allowing new analyses to be carried out and providing improved information to support decision making.
Challenges
Copernicus is an ambitious investment in an independent European data provision system with global coverage, financed by the European Union (EU) and the European Space Agency (ESA). The programme is already delivering more than 12 terabytes of environmental data each day. For this investment to reach its goals and be successful in creating societal benefits, the programme’s data and services must be widely used by many user groups based on their individual requirements. One important area of use for Copernicus data is climate change adaptation (EEA 2017a). There is substantial utilisation potential in the data and services provided by the programme, but the availability of these data and services is currently insufficient regarding such cross cutting concerns as climate change adaptation. Even if Copernicus is already being used by many public authorities, organisations and companies in Sweden, so far there has been a lack of concrete examples of how Copernicus data can specifically support Swedish climate change adaptation. As a result, there is insufficient knowledge among those working on climate change adaptation in Sweden as to the kind of data and services available through Copernicus, and indeed the resource these constitute for climate change adaptation.
1 The data policy for Copernicus is regulated in Regulation (EU) No 377/2014 establishing
the Copernicus Programme (EU 2014) and Commission Delegated Regulation (EU) No 1159/2013 (EU 2013). The primary principle is open access to Copernicus data and Copernicus information. As a user, it may be useful to note that registration is required before Copernicus data can be downloaded and that restrictions may be imposed on licenses for data from satellites other than the Copernicus programme’s designated Sentinel satellites. The Swedish Environmental Protection Agency’s data policy, in common with that of the Swedish Agency for Marine and Water Management, provides a more comprehensive interpretation of the term open data (Swedish EPA 2017b).
Background and purpose
The idea behind this report was conceived by a task force on data usage and supply within the Swedish governmental agency network for climate change adaptation (SMHI 2017a, see also Appendix B1). The task force works to compile existing data relevant to climate change adaptation as provided by various suppliers, making the data more easily accessible and searchable. The task force identified geodata provided by Copernicus as an important data source with great potential for Swedish climate change adaptation. The team of authors behind this report2 consists of members of the task force for data usage
and data supply and the Swedish public authority cooperation on Copernicus (the Swedish Copernicus User Forum, see also Appendix B2). The authors have not had the opportunity to carry out a comprehensive inventory of all of
Copernicus services. Based on online sources, available literature and the authors’ personal experiences of working with the Copernicus programme at European and national levels, the report aims to provide:
an overall picture of the programme’s data sources and services, and reflections on a few selected services from Copernicus, together with a
discussion of their potential benefits for climate change adaptation.
2 This report has originally been published in Swedish and with Swedish users in the domain
of climate change adaptation as a primary target group. The present version is a translation of the original Swedish report. The objective of the translated version is to facilitate the sharing of our experiences with Copernicus and climate change adaptation in this project with the wider community of European and international climate change adaptation users.
Results and discussion
Copernicus – an Earth Observation programme
for environment and security
About satellites and data reception
In order to meet the need for environmental observation data and to provide the programme’s thematic services, Copernicus uses a system comprising several families of satellites that carry out a variety of tasks. One satellite family consists of twin satellites flying in pairs with a half-orbit separation. This reduces the time between revisiting a given location, providing twice as frequent environmental observations. The frequent revisits provide good resolution in the collected data in both time and space, particularly at Sweden’s latitudes. Sweden is covered several times each week. The Copernicus satellite families are named Sentinels.
The first satellite family, Sentinel 1, consists of two radar satellites that deliver information on winds, waves, ocean currents, ice sheets and oil spills
irrespective of the weather, cloud cover and time of day. Satellite family Sentinel 2 contributes to improved mapping of land cover and environments such as woodland and other vegetation, lakes, wetlands and rivers,
urbanisation, etc. Information regarding land cover is important in assessing emission sources and land usage that might affect aspects such as water quality, nature preservation and fire hazards. Similar benefits can be expected regarding the monitoring of sensitive coastal zones. Another important area of use is landscape planning and the design of green and blue areas. The latter has large importance for ecosystem services, the preservation of biological diversity and climate change adaptation. Natural flood plains can function as detention reservoirs in the event of heavy rain, something that will become ever more important considering the likelihood of a wetter Swedish climate. Sentinel 2 has also demonstrated its potential for marine observations, such as
monitoring algal bloom in the Baltic Sea. Swedish land cover data, prepared and administered by the Swedish EPA, is largely based on Sentinel 2 data and will be used by several public authorities in climate change adaptation. The Swedish Forest Agency uses Sentinel 2 operationally to support the agency’s in situ measurements and to control compliance with the Swedish Forestry Act. This application is important in preventing illegal deforestation close to shorelines and streams, where water quality and shade from foliage must be ensured in order to preserve valuable fish stocks such as sea trout. Sentinel 2 can also be used to monitor emissions from dredging activities.
The first satellite in the Sentinel 3 family has also been launched. This satellite is carrying instruments that can analyse variations in oceans and large lakes, and provide data on, for example, currents, water temperature and water quality. One of the satellite’s instruments has been specially developed to register colours in water. The colour of water is affected by dissolved matter, suspended particles and chlorophyll. These correlations can be used to obtain a
better picture of water quality and the need for environmental improvement measures. The satellite will deliver comprehensive images of marine and freshwater areas that can supplement direct samples of water properties.
There are also Copernicus satellites that measure atmospheric variables, supporting assessments of air quality, and sea level changes. Interested readers can learn more about these satellites and their mission on the Copernicus website (Copernicus 2017) and at the European Space Agency (ESA 2017a). An important aspect of the EU’s Copernicus programme is to facilitate long-term planning through continuous measurements. This long-term approach is vital in reassuring users that measurement series will continue beyond the lifetime of a given satellite. In that respect, operation of Copernicus is similar to meteorological satellite systems aiming at long-term data continuity. For instance, within the Copernicus programme, plans are already underway for the next generation of Sentinels that will succeed the current satellites and effectively ensure the continued provision of high-quality data. Maintaining a long-term approach and comparability of measurements are prerequisites for monitoring and analysing environmental changes in a reliable manner, as a basis for well-founded decision making.
The enormous amount of satellite data collected by the sensors on-board the Sentinels is relayed to Earth when the satellite passes over a receiving station. Data can also be linked via special relay satellites. From these receiving stations, data is conveyed in near real-time to dedicated processing centres, where it is corrected to account for atmospheric disturbances and variations in terrain, to fit reference systems and map projections. All data is saved for future use in an extensive archive, where it is open and free to anyone who wishes to use it. Copernicus data is in great demand and has set a new global standard for satellite data. Public and private-sector stakeholders worldwide stand in line to gain access to the data produced by Copernicus.
Access to satellite data
The European Space Agency and EUMETSAT have been tasked by the European Commission to collect, store and process satellite data from Copernicus. The Copernicus Open Access Hub (ESA 2017b) and Copernicus Space Component Data Access (CSCDA) (ESA 2017c) are the primary entry points to Sentinel data. The Copernicus Open Access Hub guides the user through an interactive graphic interface. The CSCDA Portal also provides access to data from the ESA’s own research satellites or those sent up by cooperating Member States to collect different types of data to complement that collected by the Sentinels. For example, this may include very-high-resolution images that show details of the Earth’s surface, as small as 0.5 m (see under Pleiades). Contributing missions are not part of the core Copernicus programme and are not financed by the EU. Access to data from these is therefore linked to the data policy of each individual satellite owner. The European Commission buys a large amount of data from contributing missions,
mainly for use in Copernicus services. Data can even be requisitioned for use by public authorities in Member States.
EUMETCast is a dissemination system operated by EUMETSAT. Among other, EUMETCast distributes Copernicus satellite data and associated products in the fields of atmospheric and marine monitoring (EUMETSAT 2017).
Several countries have also created their own national platforms for archiving and distributing Copernicus data as a basis for broad utilisation, research and data-driven innovation. All data covering Swedish territory is automatically linked from the ESA’s platform to the Swedish Swea platform (Swedish National Space Board 2017), which was developed to meet the interests and needs of Swedish users. Swea is a satellite data tool comprising of an online interface and a portal with an open application programming interface (API). It is free-of-charge to search, visualize, order and download data from the active Sentinel satellites (Sentinels 1-3). Data from the US Landsat satellites is also available via Swea. Data stored in Swea is geo-corrected based on Swedish reference systems, elevation data models and map projections, making it easy for Swedish users to use the satellite images in tools such as geographic information systems (GIS) and image-handling programs. It is also possible to prepare your own mosaics and time series. Sentinel data can be downloaded either as the original product or as a processed product generated by Swea. A first version of Swea is already operational. The system will be further
developed according to the evolving needs and requests of Swedish users. The satellite image database Saccess (Lantmäteriet 2017a) will be integrated with Swea in order to offer satellite images from the late 1970s together with a continuous stream of new images. This will provide substantial opportunities for change analyses of Swedish land and water areas. As data continuity is now assured through Copernicus, it is time to consider satellite data as a natural part of Swedish geodata provision.
Within the framework of two major EU projects, the Copernicus Caroline Herschel Framework Partnership Agreement and the Interreg BalticSatApps project, many different actions are being planned. Several of these actions aim at increasing the understanding of how Swedish stakeholders can benefit from Swea in a range of activities, and how Swea can stimulate knowledge-intensive industries to develop advanced information products using the satellite data tool. In addition to this, a workshop is planned to provide good examples and interactive exercises. The purpose of this is to bring together delegates from various networks on climate change adaptation with the national group of experts and authorities collaborating on Copernicus. Gathering experts and groups from different areas of society may increase the utilisation of
Copernicus data and services in climate change adaptation and, thereby, create societal benefits. The workshop will highlight many aspects of climate change and society’s need for innovative adaptation to meet the challenge. Events such as flooding, drought, landslips, melting glaciers, erosion and rising sea levels, changing habitats and decreasing biodiversity will be among the topics discussed.
Several EU Member States have created their own equivalent to Swea. Finland provides the Finnish Data Hub System (FMI 2017). Germany and France have progressed further and produced almost global copies of collected Sentinel data. Germany’s platform, Code-DE (Copernicus Data and Exploitation Platform – Deutschland) is a portal providing access to both Copernicus satellite data and products from the thematic services (Code-DE 2017).
As Copernicus data is distributed free, several companies have also created services to provide satellite data from the programme. A couple of examples of cloud services offering Sentinel 2 data are Amazon Web Services (Amazon 2017) and Google Earth Engine (Google 2017). Google Earth Engine also offers approved users the opportunity to use many Earth observations from various sources (currently Copernicus Sentinels 1 and 2) in combination with a given quota of computation capacity on Google’s servers.
To support European users, the EU is now preparing its own central infrastructure for storing, processing and disseminating Copernicus data. Copernicus Data and Information Access Services (DIAS) will ensure fast and secure access to data in combination with access to computation capacity for processing large amounts of data. It will also be possible to temporarily move data sets of interest, for example from Swea, to be processed in DIAS and then download the results. DIAS will be the primary access point for users and companies wishing to develop data-driven innovation.
Thus, there are many access points for Copernicus data, and the solutions compete with one another to present and provide data in a user-friendly, efficient manner, in combination with access to data-processing services. Likely, the future will bring new tools linked to the enormous amount of
Copernicus data, offering simplified navigation, analyses and conclusions aided by artificial intelligence and machine learning.
It is also worth mentioning that, aside from Copernicus, Sweden now has access to a quota of satellite images from the French-Swedish Pleiades project. This data is available free-of-charge to Swedish institutional users such as public authorities and researchers. These satellite images have very high resolution and allow for the analysis of details in the order of magnitude of 0.5 m. The images are even available in 3D. These satellite images can provide a valuable source of supplementary information to Sentinel data for those users requiring more detailed information on a given area, for example an urban environment or water body. The Swedish National Space Board has a simple procedure for ordering these images.
Satellite data and climate change
Satellite images from Copernicus provide full-coverage, continuous data on the state of the environment, infrastructure or urban areas. This makes it possible to detect and monitor long-term trends or seasonally-affected changes to vegetation and water environments. Several Swedish field studies are discussed in Klein et al. (2017). Satellite images can also be used to support disaster management. This topic is discussed later in the section on the Copernicus Emergency Management Service.
Example: forest fires
The risk of fire in forests and open countryside has increased by 20% globally since the end of the 1970s. This increase can be linked to climate change and global warming (Jolly et al. 2015). During the late summer of 2014, Sweden suffered the Västmanland fire, the largest forest fire to strike the country in modern times. It took 11 days to bring the fire under control (MSB 2014, Swedish Forest Fire Investigation 2015). Even if a single event cannot be traced to climate change, the Västmanland fire is a clear illustration of the possible effects of a warmer climate. Heat, extreme drought and hard winds were identified as factors contributing to the spread of the fire.
During this emergency, Sweden sought help from the Copernicus Emergency Management Service in order to access customised images of the current situation and data for interpreting the fire area. Users wishing to study the aftermath of the fire can also download more recent satellite images from Copernicus. The nature preservation area Hälleskogsbrännan is part of the areas affected by the fire. In the aftermath of the fire, new vegetation is growing and animals and birds have returned (County Administrative Board
Västmanland 2017). At the same time, the scope and effects of the fire are still visible almost three years after the event. Figure 1 shows an image of
Hälleskogsbrännan taken by Sentinel 2B on 19 October 2017. Using Swea, you can easily select an area of interest over which to search for satellite images. If you search for optical images (often obscured by clouds), you can also set a limit for the maximum percentage cloud cover permitted for images.
Figure 1. Screen shot of the Swea online service. Left-hand image taken by Sentinel 2B on 19 October 2017. The image shows the Hälleskogsbrännan area close to the community of Virsbo in Västmanland County. The right-hand column shows the results of a search of satellite images for a selected area (a rectangle covering the area of the fire) and a maximum cloud cover of 5%.
Example: access to water
Climate change will affect both land and water environments. Even if Sweden is generally moving towards a wetter climate, the country will still encounter increasing problems with drought and water shortages, particularly in southeast regions. The last two years have shown unusually low levels of precipitation, something that has placed the issue of drought and water shortage firmly on the Swedish agenda. According to the Swedish
Meteorological and Hydrological Institute (SMHI) low water levels in Lake Hjälmaren and Lake Vättern will be increasingly common, primarily due to increased evaporation in the warmer climate (SMHI 2017b). Model
computations suggest that the mean water level in Lake Vättern will decrease by one to two decimetres by the end of the century, with roughly the same decrease throughout the year. In the case of Lake Hjälmaren, mean water levels can be expected to sink by an average of one decimetre during summer and autumn. As water in lakes and rivers heats up, water quality is also affected, leading to knock-on effects in ecosystems and vital societal functions such as drinking-water supply. Extended periods of stratification in water bodies, with surface water and deeper layers failing to mix, increases the risk of oxygen deficiency in bottom layers and a negative impact on the entire ecosystem. Algal blooms will also increase in frequency and intensity as nutrient-rich waters become warmer.
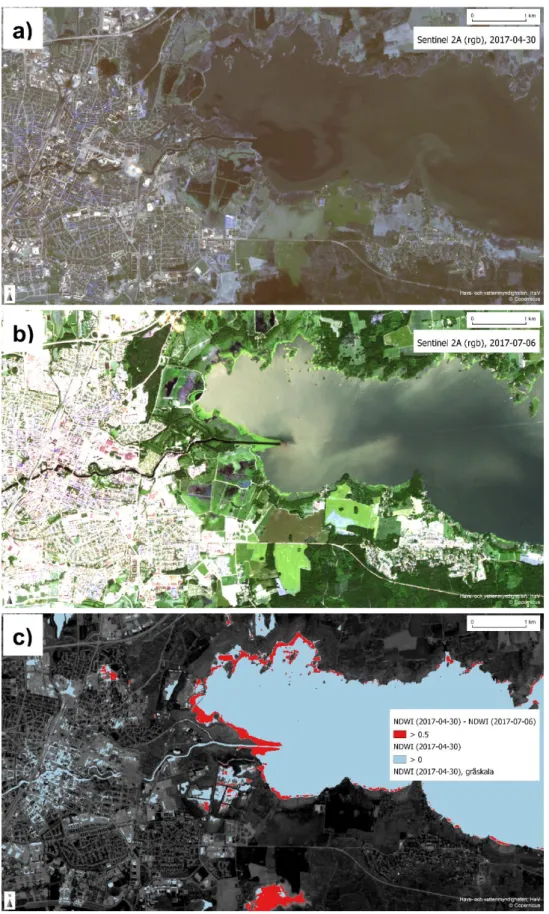
Figures 2a and 2b show changes in the shore zone of Lake Hjälmaren between spring and summer 2017, using two satellite images taken by Sentinel 2A. The images show the western area of the lake near Örebro on 30 April 2017 and 6 July 2017 respectively. The images use satellite bands red, green and blue,
Hälleskogsbrännan Virsbo
Figure 2. a) Satellite image taken by Sentinel 2A on 30 April 2017. The image shows areas of Örebro and the western area of Lake Hjälmaren. b) Same as a) but for 6 July 2017. c) Normalized Difference Water Index (NDWI) for 30 April 2017 (background image, grey scale). Area with positive NDWI (suggesting a water surface) shown in light blue. The difference in NDWI between 30 April and 6 July 2017 has also been calculated for these areas. The areas with a large positive difference (suggesting draining or transition to vegetation) are shown in red. The satellite images have been downloaded from Swea and processed using a GIS program with open source code (QGIS 2017).
Comparison of Figures 2a and 2b shows some differences in vegetation. It is also possible to see structures in the water that suggest suspended particles and material in the water. In Figure 2c, the area that has become noticeably much drier between 30 April and 6 July has been roughly estimated (areas in red close to the shoreline)3. These changes may indicate either a change in
vegetation and/or areas drained because of low water levels. During summer 2017, reports from the public were received by the Örebro County
Administrative Board regarding low water levels, particularly along the northern shore (Ernst Witter, County Administrative Board, and Lotta Carlström, Lake Hjälmaren Water Conservation Society, personal communication).
National Land Cover Data
The Swedish EPA has initiated the development of a new Swedish national land cover data product (NMD, Nationella Marktäckedata) based on Sentinel 2 data. The initiative is supported by several other public authorities (Swedish EPA 2017a). The project is intended to create and manage data for monitoring of the Swedish landscape and how it changes over time. The project will deliver a complete national cover and ensure that data is comparable between different analysis occasions. Production must be repeatable and capture change. NMD is covered by the Swedish EPA’s data policy and is thereby accessible as open data. The production and administration of the product aim to enable greatest possible cost efficiency and user uptake. Satellite data from Copernicus Sentinel 2 is a key resource for the product, and the project is in fact one of Europe’s largest users of Sentinel 2 data. The fact that Sentinels 2A and 2B fly as a synchronised pair means that the same region is revisited with only a few days gap. This increases opportunities for cloud-free passes and improved mapping and classification (Olsson 2017). Figures 3 and 4 show examples of different types of land cover. Land cover production is often complex and the higher spatial resolution offered by the Sentinel 2 series (10 m) gives the developers an advantage. NMD will be used as a basis for climate change adaptation work in a variety of sectors, including nature preservation,
agriculture, urban environments and monitoring of fire risks in woodlands and open countryside.
3Calculations were made with the aid of a simple index for water surfaces, the Normalized
Difference Water Index (NDWI). NDWI is expressed as follows: NDWI = Green - NIR/Green + NIR where Green is a spectral band in the green area while NIR is a near infrared spectral band in the optical spectrum (McFeeters et al. 1996). For Sentinel 2, these bands are equivalent to bands 3 and 8, respectively. The NDWI index varies between 1 and -1, where
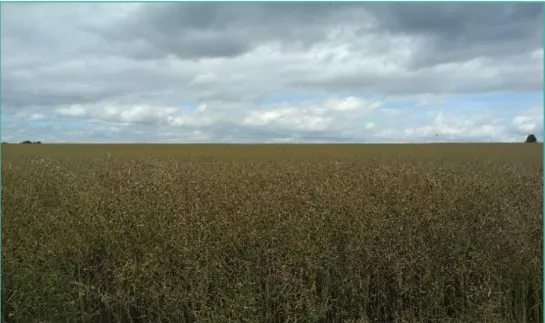
Figure 3. Agricultural landscape, Ven, southern Sweden.
Figure 4. Forest lake in Änggårdsbergen, Gothenburg.
Thematic services
Copernicus also provides thematic services. These thematic services combine satellite data with in situ measurements and models in order to produce services for different areas of use. Copernicus currently has six streams of thematic services, meeting information and data needs in the fields of climate, land, marine, atmosphere, emergency and security. At the EU’s Copernicus YouTube channel (EU-COM 2017a), there is an introduction to Copernicus (EU-COM 2017b) and an in-depth description of the programme’s various services and how these can be adapted to local and regional needs such as coastal planning (EU-COM 2017c). The following section will provide a brief description of the different thematic services, together with a few examples of how they can support climate change adaptation.
Land Monitoring Service
The Copernicus Land Monitoring Service is divided into four product groups based on geographic area and level of detail. The European Commission's Joint Research Centre (JRC) is responsible for producing data on a global scale, while the European Environment Agency (EEA) coordinates Pan-European and local components and reference data (Copernicus Land Monitoring Service 2017a).
The Pan-European component contains data such as land coverage and High Resolution Layers (HRL) for themes such as permanent bodies of water, wetlands, forests and impervious surfaces. These layers are normally updated every three to six years, thus facilitating change analyses.
Example: impervious surfaces
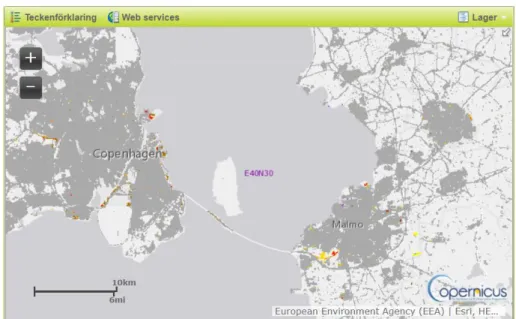
Figure 5 shows changes in imperviousness in the Öresund region between 2009 and 2012 based on the Land Monitoring Service’s mapping. The resolution of images from the Land Monitoring Service (20 m and for certain products 100 m) may be somewhat limited for detailed planning at a local level. However, there is value in the fact that mapping covers the whole of Europe and has been produced using a harmonised methodology. In this way, support is provided for international comparisons and analyses of climate effects and adaptations across national borders.
Figure 5. Copernicus Land Monitoring System, map interface (screenshot). The map shows the Öresund Region. Yellow and red areas indicate new impervious surfaces between 2009 and 2012. Areas without significant changes in imperviousness are shown in grey
Example: green infrastructure
Green infrastructure4 is generally defined by the European Commission as a
strategically planned network of high quality natural and semi-natural areas with other environmental features, which is designed and managed to deliver a wide range of ecosystem services and protect biodiversity in both rural and urban settings. Green infrastructure contributes to the preservation of
biological diversity, maintains the status of ecosystems and thereby strengthens important ecosystem services in order to reinforce the capacity for recovery after disruption. The green infrastructure perspective provides added value to societal planning and decision making as it facilitates coordination and streamlining of activities and by drawing attention to previously overlooked aspects of the landscape (Swedish EPA 2017c).
Green infrastructure is of great importance to climate change adaptation. Green infrastructure can for example be used to introduce vegetation and surfaces that naturally retain and absorb surface water, reducing the amount that drains into sewage systems and, eventually, reaches lakes and rivers (Figure 6). At the same time, urban heat islands are countered and the effects of heatwaves are considerably reduced (EU 2017). How green and blue areas are designed in Sweden’s urban environments, and how these stand up to international comparison, can be analysed using data from the Copernicus Land Monitoring Service. Figures 7 and 8 show areas of central Stockholm and Brussels respectively, as seen on maps from Copernicus Urban Atlas.
Figure 6. Impervious surface (parking lot) and lawn respectively after heavy rain.
4The term green infrastructure in this report also includes blue infrastructure such as rivers
Figure 7. Central Stockholm according to the Copernicus Land Monitoring Service Urban Atlas, 2006 (screenshot, Copernicus Land Monitoring Service 2017c). The scale is shown in the lower left-hand corner of the image. Codes are shown to the right of the map.
Figure 8. Central Brussels according to the Copernicus Land Monitoring Service Urban Atlas, 2006 (screenshot, Copernicus Land Monitoring Service 2017c). The area covered in this image is somewhat smaller than the area in Figure 7. The scale is shown in the lower left-hand corner of the image. Codes are shown to the right of the map.
Further examples of how products from the Copernicus Land Monitoring Service can support climate change adaptation and work on environmental issues can be found in the Swedish Agency for Marine and Water
Management’s new map service (SwAM 2017).
Marine Environment Monitoring Service
The Copernicus Marine Environment Monitoring Service delivers information with particular focus on four areas of benefit. These areas of benefit are maritime safety, including shipping and off-shore operations, coastal and marine environment, marine resources, and weather, seasonal forecasting and climate activities (Copernicus Marine Environment Monitoring Service 2017a). The service provides a detailed catalogue (Copernicus Marine Environment Monitoring Service 2017b) through which users can search by regional domain, parameters and temporal coverage. Among other things, the Marine
Environment Monitoring Service provides information on current conditions of the oceans. In addition to satellite data, the service also uses in situ
observations and physical and biochemical models to obtain information on the vertical structure of the oceans. Near-real-time and forecast data are further complemented by reanalyses. Reanalyses combine models and past
observations to derive consistent and comparable retrospective data records that can be used for trend analyses. The latter is an important prerequisite for identifying climate change trends and assessing climate change impacts on
Example: climatology of Baltic Sea surface waters
Working with environment and climate requires regular environmental monitoring. Environmental monitoring is a prerequisite for determining the state of the environment and environmental changes due to direct human impacts or climate change. The EU’s Marine Strategy Framework Directive (EU 2008) is the environmental cornerstone of the European Union’s integrated marine policy and explicitly highlights the marine environment as “a precious heritage that must be protected, preserved and, where practicable, restored”. Among other things, the Marine Strategy Framework Directive underlines the need to describe physical and chemical conditions in the marine environment, for example with regard to the geographic and temporal distribution of salinity and temperature. Figure 9 shows a modelled annual mean value from a
reanalysis of the Baltic Sea carried out by SMHI on behalf of the Copernicus Marine Environment Monitoring Service. For further examples of how
products from the Copernicus Marine Environment Monitoring Service can be used, see the Swedish Agency for Marine and Water Management’s new map service (SwAM 2017).
Figure 9. Climatological annual mean value of Baltic Sea surface waters: Baltic Sea Physics Reanalysis from SMHI (1989-2014) carried out on behalf of the Copernicus Marine Environment Monitoring Service, showing sea surface temperature (left) and sea surface salinity (right) in the Baltic Sea. (Data source: Copernicus Marine Environment
Monitoring Service 2017c).
Atmosphere Monitoring Service
The Copernicus Atmosphere Monitoring Service offers data and information on atmospheric composition, greenhouse gases, air quality and renewable energy (Copernicus Atmospheric Monitoring Service 2017a). A comprehensive overview of available products can be found in the service’s catalogue (Copernicus Atmosphere Monitoring Service 2017b).
Among other things, the service offers regularly updated calculations of air pollution levels. Air pollution influences how the climate changes. At the same
time, climate change also affects air quality. Warmer climate and sunny
conditions facilitate the formation of ground-level ozone. Ground-level ozone is a secondary air pollutant formed by chemical reactions in which nitrogen oxides and hydrocarbons are converted in the presence of sunlight. High levels of ground-level ozone increase the risk of premature death from respiratory diseases. Ozone is a poisonous gas with powerful oxidization properties, thereby seriously irritating to mucous membranes and eyes. Ozone also can break down certain materials. High levels of ground-level ozone are common in Europe during summer when the weather is warm and dry. The combination of heat waves and poor air quality may cause major societal problems, especially in urban environments. This problem made headlines during and after the 2003 heat wave, which resulted in thousands of premature deaths (Public Health Agency of Sweden 2015) across the southwest of Europe. Many of the world’s major cities suffer from air pollution. Europe also continues to face problems with air quality (EEA 2017b). Poor air quality affects not only people’s health but also the environment and our cultural heritage. Daily calculations from the Copernicus Atmosphere Monitoring Service provide data and information on current and expected air pollution levels. In this way, support is provided for early-warning systems and tools to manage episodes of poor air quality. Calculations are also carried out on an annual basis and for several years back in time. This information can be used to regularly monitor air quality in Europe and worldwide, to compare measures that might
contribute to improved air quality and to follow up the effects of environmental improvement initiatives. If, for example, ozone formation is enhanced by a warmer climate, even greater efforts may be required to reduce emissions of ozone precursors.
Climate change also influences phenology5, and one of the consequences of this
is an increasingly long pollen season. The Atmosphere Monitoring Service provides both global and regional European products on pollen. Pollen forecasts can, for example, be used by health services to inform the public about expected high levels. Satellite images that show blossoming and the arrival of spring across the country at frequent intervals can improve the quality of such products.
Example: ozone levels
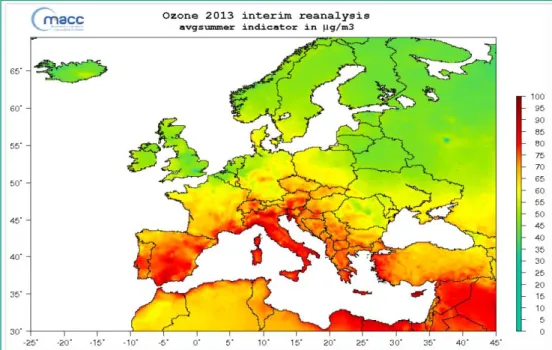
Figure 10 shows an example of modelled levels of ground-level ozone during summer 2013 in Europe. The image shows results obtained from an ensemble model, a combination of several individual models, designed to reduce
uncertainty in the calculations. During summer 2013, high levels of ground-level ozone were observed over continental Europe, particularly over the Mediterranean area. Similar calculations are carried out daily for many other air pollutants. Calculations are carried out both for Europe and for the rest of the world.
5Phenology is the study of recurring phenomena, such as animal migration and plant cycles,
Figure 10. Calculation of ground-level ozone in Europe during summer 2013 from an ensemble of air-quality models in the Copernicus Atmosphere Monitoring Service
(Copernicus Atmosphere Monitoring Service 2017c).
Emergency Management Service
The Copernicus Emergency Management Service (EMS) is coordinated by the EU’s Joint Research Centre (JRC). One of the primary purposes of the service is to prepare and make available customised information and support in emergency and disaster situations (Copernicus Emergency Management Service 2017a). Crises may be due to natural disasters such as flooding, landslides, storms, fires or earthquakes, but they may equally be man-made emergency situations, whether in the form of accidents or humanitarian crises. The service supports all phases of the emergency management cycle:
preparedness, prevention, disaster risk reduction, emergency response and recovery. Current research and compilations of research (for example IPCC 2013 and IPCC 2014) indicate an increasing trend towards natural disasters linked to climate change, and highlight the need to adapt preventative
measures and disaster management accordingly. The Emergency Management Service is therefore an important tool for climate change adaptation, both for the EU and individual Member States and in the event of international
emergencies. During 2017, the service has been used in connection with several tropical cyclones, floods and fires. Swedish use of the Emergency Management Service is coordinated by the Swedish Civil Contingencies Agency (MSB 2017a) who continually work to develop the service to meet national needs and to evaluate the service’s early warning systems.
The Emergency Management Service consists of a mapping component and an early warning component. The primary component is the mapping service (Copernicus Emergency Management Service 2017b), providing customised production of maps to support emergency measures, whether in the event of
natural disasters or humanitarian emergencies. The service uses satellite images as its main source of data and has global coverage. Activation of the service in emergency situations is implemented via the responsible national contact point (MSB 2017a). There is also an archive of maps from previous disasters for which the service produced geodata and maps to support
emergency management. This material is openly available, except for classified material, and is searchable based on type of event, affected countries, activation status and other parameters (Copernicus Emergency Management Service 2017c). This also allows for the retrospective analysis of emergencies by comparing maps of areas affected during an actual situation with areas previously mapped as risk zones. The Emergency Management Service’s mapping service consists of two components. The first one is rapid mapping (RM) for urgent emergency management activities. The second component is risk and recovery mapping (RRM). Rapid mapping has been activated on some 300 occasions since its introduction, with flooding the most common reason. After activation, the first product should be available within 12 hours. The estimated time for product delivery is however dependent on satellite data availability which induces a challenge to be able to deliver products within the stated time requirements. Risk and recovery mapping can be implemented for preventive purposes or to evaluate the situation and necessary measures after the event. This service is still underutilised and an increase in the number of activations is desirable.
From 2018, the Emergency Management Service will offer three early warning systems, the European Flood Awareness System (EFAS 2017), the European Forest Fire Information System, (EFFIS 2017) and the European Drought Observatory (EDO 2017). The European Flood Awareness System (EFAS) will offer monitoring, early warning and risk assessments related to flooding. EFAS is a collaboration between the European Response and Coordination Centre (ERCC) and national meteorological and hydrological institutes. SMHI is the Swedish member of this network and supplier of information.
The European Forest Fire Information System (EFFIS) offers support and current information on forest fires in Europe to EU institutions and responsible organisations in Member States. The service prepares prognoses, identifies hot spots (potential fires) and compiles statistics covering previous fires. The third early warning service, the European Drought Observatory (EDO) will become operational during 2018. The focus of EDO will be on mapping and compiling indicators of drought.
Example: flooding in Småland, 2012
In July 2012, the region Småland suffered heavy rains that caused extremely high water levels (SMHI 2012). These water levels caused flooding, including in the districts of Mariannelund and Hultsfred and around Lake Hulingen. The County Administration Boards of Kalmar and Jönköping then contacted MSB, who activated Copernicus EMS. The service produced a comprehensive list of material that is available via the activation list (Copernicus Emergency
Copernicus EMS to analyse the flooded area along the Emån river near Målilla, Småland.
Figure 11. Satellite-based analysis of the flooding along the Emån between the communities of Järnforsen and Målilla in 2012. The map was produced by Copernicus EMS to support the management of the flood (Copernicus Emergency Management Service 2017d).
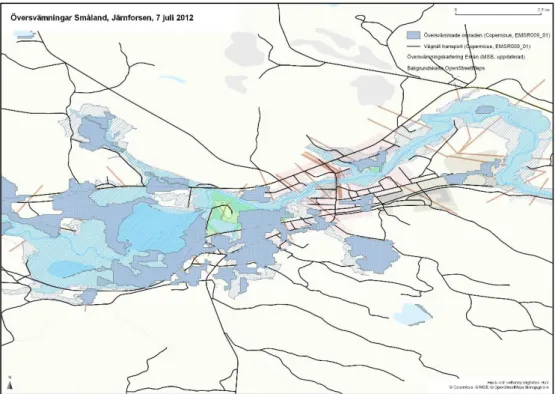
It is also important to learn from those emergencies that do occur, in order to improve risk assessment and preparedness for future emergencies. Satellite-based mapping of the areas actually flooded in July 2012 can be compared to flood inundation mapping carried out previously to assess risk areas. An example of this is shown in Figure 12, where a map from Copernicus showing the Järnforsen area of Småland during the flood is compared with a flood inundation map. Overall, the comparison shows a good match. However, there are also areas that were flooded during the actual event that are not highlighted as risk areas in the flood inundation map, while other areas that were assessed as risk zones escaped without flooding. MSB’s flood risk maps are available through their flood risk portal (MSB 2017b).
Figure 12. Satellite-based mapping of the flooded area near Järnforsen, Småland, 7 July 2012 (blue with white dots (Copernicus Emergency Management Service 2017e) and MSB’s flood risk map for the Emån (turquoise with diagonal lines, source MSB 2017b). Roads are shown as black lines (source Copernicus; background map © OpenStreetMaps
contributors).
Climate Change Service
The Copernicus programme’s thematic Climate Change Service (Copernicus Climate Change Service 2017a) is still in the development phase. The
Copernicus Climate Change Service uses environmental and climate
monitoring data from satellites and in situ data, together with atmospheric, marine, freshwater, land and ice condition models. Climate change is a horizontal issue that is also addressed by the land, marine and atmosphere services. As the data provided by the above-mentioned services is expanded and improved, the quality of the products offered by the Climate Change Service will improve accordingly. So far, the Climate Change Service has a limited product catalogue (Copernicus Climate Change Service 2017b), but this will be supplemented during 2018. During 2018, the Climate Change Service is expected to operate a new data warehouse and a portal that will provide access to large climate data archives from global and regional climate reanalyses, seasonal forecasts and climate projections (Copernicus Climate Change Service 2017c). Climate projections use models to estimate climate change for various scenarios of future greenhouse gas emissions.
The Copernicus Climate Change Service will support the mitigation of climate change and, in particular, facilitate climate change adaptation in many sectors, including water management, coastal planning, agriculture and forestry,
disaster management. Copernicus data and information on long-term climate scenarios, the coming years or simply the next season are expected to provide important information for planning in areas such as hydroelectric production or other sources of renewable energy. Several pilot projects are working to demonstrate information systems for various societal sectors. One example is the Service for Water Indicators in Climate Change Adaptation (SWICCA), a project to provide readily available climate impact data to speed up the workflow in climate change adaptation of water management (Copernicus Climate Change Service 2017d).
Example: global air temperatures
The world is moving towards a warmer climate (see, for example, IPCC 2013, IPCC 2014) and Sweden is seeing temperature rises above the global average (Kjellström et al. 2014). The development of global warming can be followed using calculations from the Copernicus Climate Change Service. The service has even produced an animation showing the rise in global temperature between 1979 and the present day (Copernicus Climate Change Service 2017e).
Example: precipitation
The Copernicus Climate Change Service also offers hydrological products that provide information on precipitation. According to the latest knowledge (e.g. Kjellström et al. 2014, Swedish Drinking Water Investigation 2015), Sweden is moving towards a wetter climate. At the same time, evaporation is increasing and growing seasons are being prolonged because of higher temperatures. This may result in lower water levels, including low groundwater levels in southern Sweden. There may also be periods of less precipitation that lead to water shortages and lower groundwater levels, as already experienced in some parts of the country (MSB 2017c). Changes to rainfall patterns and water flows affect many societal functions, including the provision of drinking water and
hydroelectric energy production. Figure 13 shows an example of an analysis of hydrological variables from the Climate Change Service for May 2017.
Figure 13. Precipitation, relative humidity, volumetric soil moisture and temperature for May 2017 (in relation to May average between 1981 and 2010) according to a reanalysis of ERA-Interim (Copernicus Climate Change Service 2017f).
Example: ice monitoring
Figure 14 shows ice information for the Arctic and Antarctic from a global reanalysis. Sea ice was much more widespread in September 2017 than on average during September months between 1981 and 2010, which correlates directly to higher atmospheric and marine temperatures. The effects are particularly visible in the Arctic.
Figure 14. Sea ice according to the ERA-Interim reanalysis. The images show the deviation of September 2017 from the September average for the period 1981-2010 (Arctic in the left-hand image, Antarctic to the right) (Copernicus Climate Change Service 2017g).
Security Service
The Copernicus Security Service is intended to support EU security policy by providing information and decision-making materials that contribute to meeting Europe’s security challenges (Copernicus Security Service 2017). The Security Service’s products support emergency management, preparedness and response with regard to border and maritime surveillance, and the European External Action Service (EEAS). National public authorities with responsibility for border surveillance, maritime security and defence have the right to activate the service when required, such as in the event of suspected illegal trawling, smuggling and threats to foreign missions, etc. Large-scale refugee movement, changes to cultivation systems, conflicts concerning resources limited by climate change and humanitarian crises are examples of issues that the service addresses. Climate change creates and influences emergencies and conflicts. Many of the Security Service’s products respond to activities that may be forms of climate change adaptation, or symptoms of the inability to adapt to a
changing climate. The Security Service can therefore serve as an important tool for climate change adaptation. The Security Service products are not made public but are shared within those networks of European and national authorities whose mandate falls within the area of security policy.
Conclusions and necessary
developments
The EU’s Copernicus Earth Observation programme offers a rapidly expanding array of data that can be used to support climate change adaptation in a variety of ways and within many different areas. These areas include water supply, energy supply, physical planning and construction, health, the natural environment and ecosystems. In this report, we have conveyed a brief, comprehensible overview of Copernicus, and illustrated the use of the programme’s data in climate change adaptation with a few simple examples. The report has been produced using very limited resources. To present a detailed picture of the entire Copernicus programme and its many possible areas of use is a far too complex and comprehensive task to be undertaken within the existing framework for Swedish public authority cooperation on Copernicus. Still, these types of small-scale pilot studies, carried out through inter-agency cooperation, are a most suitable information tool if one wishes to effectively reach users within various thematic areas. As more user needs are identified, further reports may be produced. Based on this brief report, we draw the following conclusions:
1. Increasing amounts of data: Already during 2018, the amount of data from Copernicus applicable to climate change adaptation will increase rapidly. The Copernicus programme will expand to include more data sources, such us further Earth Observation satellites. In addition, the Copernicus Climate Change Service will open a new comprehensive climate data store. The climate data store will provide access to vast quantities of past, present and future climate data and information that will facilitate reliable analyses and projections of possible scenarios. 2. Better access to data: Overall, access to Copernicus data will improve
which also will benefit users in the field of climate change adaptation. In parallel to work on national platforms such as Swea and commercial solutions, the EU is currently engaged in the procurement of the Copernicus Data and Information Access Services (DIAS), a new platform for access, processing and use of Copernicus data. Climate change adaptation is a field which should be able to benefit
substantially from the increasing quantity of data and information available from Copernicus. In order to do so, it will however be vital to prioritise awareness-raising initiatives. It should be possible to include some of these in the user uptake activities already planned in the current Copernicus Caroline Herschel Framework Partnership Agreement and the Interreg BalticSatApps project. However, it will also be necessary to provide further national support and to deepen cooperation between public authority networks. It seems especially important to mention the following necessary developments:
Communication: There is an evident need for tailored communication regarding the possibilities and limitations of the Copernicus
climate change adaptation encounter in their respective fields.
Information is also required regarding how Copernicus can supplement existing methods and data sets. One path forward might be to compile a collection of good examples and illustrative use cases divided into different societal benefit areas or thematic areas.
Training and skills development – short- and long-term: There is a need for teaching materials on climate change adaptation (courses, instruction videos and other suitable support) that make it easier for current users - from public authorities to researchers and the private sector - to utilise Copernicus data and services in a simple manner. There is a need to increase awareness regarding how Earth Observation and other geodata can be used together with freely-available image processing software and geographic information systems (GIS). In addition to producing communication and education material, there is also a more long-term educational imperative to prepare tomorrow’s users to utilise geodata in climate change adaptation. Inspiration for this could well be found at the Swedish Geodata Council’s Geo-school (Lantmäteriet 2017b). Geo-school is a digital learning environment that offers teachers access to lesson support for primary and secondary education. For example, teaching materials aimed at climate change adaptation could be built on open data from Copernicus satellites and thematic services. Relevant stakeholders would naturally need to participate in specifying the content of such materials. Inspiration for this work can be garnered from sources such as the Nordic European Space Education Resource Office (ESERO 2017), which already provides teacher training on scientific subjects. Nordic ESERO was established by ESA and the space agencies of the Nordic countries. Its task is to coordinate educational resources and provide teacher training on scientific subjects for Nordic primary and secondary school teachers. It currently offers one to two-day courses in subjects such as Earth Observation and remote sensing for teachers in Sweden, Norway and Finland. Several of ESERO’s distance university courses also focus on Earth Observation, geodata and climate research. This line of work could be further developed. Nordic ESERO also offers a comprehensive range of teaching materials developed by teachers participating in their courses.
Improved dialogue with users: The Swedish public authority agency cooperation on Copernicus and the Swedish public authority network for climate change adaptation are also in good positions to improve dialogue with users regarding their experiences. The continuous collection of feedback on the usability of Copernicus in climate change adaptation, and the integration of users’ viewpoints in national
communications, is one working method that central government agencies may investigate further. Existing networks and reference groups linked to national public authorities that are engaged in climate change adaptation can be used to collect feedback and to coordinate any developmental initiatives that might be identified as important.
Appendix
B1: Swedish governmental agency network for
climate change adaptation
Collaboration within the Swedish governmental agency network for climate change adaptation has resulted in the Swedish Portal for Climate Change Adaptation (SMHI 2017c). The purpose of the Climate Change Adaptation Portal is to support various stakeholders in society and citizens preparing for the consequences of climate change. The portal is hosted and administered by the Swedish National Knowledge Centre for Climate Change Adaptation at SMHI. The portal gathers knowledge about climate change adaptation, such as data on how the climate is changing, the likely effects on society and
environment, and how climate change adaptation is being carried out at national, regional and local levels. The portal also monitors news, provides a calendar and case studies giving examples of climate change adaptation. The agency network consists of 18 public authorities with sector or information responsibility for how Swedish society and the environment is and will be affected by current and future climate conditions, as well as 21 county administrative boards who are responsible for coordinating climate change adaptation at regional level. The Swedish Association of Local Authorities and Regions (SALAR) is also a member of the network. Network members
collaborate to strengthen the ability of society and the environment to manage the positive and negative effects of climate change. This involves cooperation in areas such as data management, climate change adaptation action plans and arranging joint training courses. These activities are carried out in thematic working groups or task forces. The idea for the present report emerged from the network’s task force on data use and supply.
B2: Swedish public authority cooperation on
Copernicus
At the request of the Swedish government, a national public authority cooperation on Copernicus was formed. This was necessary because working with Copernicus requires fully-functioning coordination between the relevant public authorities. The working group is tasked with ensuring that the
resources of the authorities are utilised as efficiently as possible and that the authorities’ need for data and services is correctly channelled. The
collaboration must also increase awareness of the information, data and services available from Copernicus. It must also create favourable conditions for data-driven innovation and the development of services based on
Copernicus, so that the programme leads to growth.
In addition to consulting on public authority data requirements, the network also aims to identify gaps in knowledge, prepare and support joint Swedish standpoints and deal with the many different aspects of Copernicus for the benefit of society and its users. This work includes communication and
information activities, networking and data accessibility via Swea, and the dissemination of knowledge on how data can be utilised.
The vision is that Copernicus should become an appreciated and
well-functioning aid to routine daily work in many public authorities, organisations and companies, thus providing increased societal benefits. The collaboration is open to all relevant national public authorities that may wish to join. Currently, there are 16 Swedish public authorities (see Figure 15) engaged in the
collaboration under the leadership of the Swedish National Space Board. Several of these authorities contribute to the organisation through voluntary annual grants.
Figure 15: Swedish public authorities that participate in the national working group for collaboration with Copernicus (2017).
References
Amazon (2017). Sentinel 2 data on Amazon web services. http://sentinel-pds.s3-website.eu-central-1.amazonaws.com/ [06.12.2017].
Code-DE (2017). Copernicus Data and Exploitation Platform – Deutschland. https://code-de.org/ [01.12.2017].
Copernicus (2017). EU website for the entire Copernicus programme http://www.copernicus.eu [01.12.2017].
Copernicus Atmosphere Monitoring Service (2017a). Homepage for the
Copernicus Atmosphere Monitoring Service. http://atmosphere.copernicus.eu [01.12.2017].
Copernicus Atmospheric Monitoring Service (2017b). Product catalogue for the Copernicus Atmosphere Monitoring Service. http://atmosphere.copernicus.eu [01.12.2017].
Copernicus Atmosphere Monitoring Service (2017c). Model calculations from the Copernicus Atmosphere Monitoring Service.
http://www.regional.atmosphere.copernicus.eu/index.php?category=eva_acce ss&subensemble=eva_products&date=LAST&species=o3&statistic=yearlyavg [05.11.2017]
Copernicus Climate Change Service (2017a). Homepage for the Copernicus Climate Change Service. http://climate.copernicus.eu [01.12.2017].
Copernicus Climate Change Service (2017b). Product catalogue for the Copernicus Climate Change Service. http://climate.copernicus.eu/monthly-maps-and-charts [01.12.2017].
Copernicus Climate Change Service (2017c). Climate projections. http://climate.copernicus.eu/climate-data-store [01.12.2017].
Copernicus Climate Change Service (2017d). Water management in changing climates. http://swicca.climate.copernicus.eu/ [01.12.2017].
Copernicus Climate Change Service (2017e). Animation of global temperatures, 1979 until present.
http://climate.copernicus.eu/resources/data-analysis/average-surface-air-temperature-analysis [01.12.2017].
Copernicus Climate Change Service (2017f). Copernicus climate service ERA-INTERIM. Precipitation, relative humidity and volumetric soil moisture, May 2017. https://climate.copernicus.eu/monthly-summaries-precipitation-relative-humidity-and-soil-moisture/may-2017 [10.11.2017].
Copernicus Climate Change Service (2017g). Copernicus climate service ERA-INTERIM. Sea ice, September 2017.
https://climate.copernicus.eu/products/monthly-sea-ice-maps/monthly-maps/september-2017 [10.11.2017].