Effect of combined treatment with
R-(+)-methanandamide and chemotherapeutic
drugs in mantle cell lymphoma and
chronic lymphocytic leukemia
By Vasanthakumar Thirugnanam
Master of Science Degree project, 30 credits points
Mälardalen University
Supervisors:
Dr. Jenny Flygare, Karolinska Universitetssjukhuset Huddinge,
Dep. of Laboratory Medicine, Division of Pathology, KI.
Dr. Kristin Gustafsson, Karolinska Universitetssjukhuset Huddinge,
Dep. of Laboratory Medicine, Division of Pathology, KI.
Examiner:
Abstract
Mantle cell lymphoma (MCL) is a non-Hodgkin B-cell lymphoma with very bad prognosis. The genetic hallmark of MCL, is the translocation t(11;14)(q13;q32) which leads to
overexpression of cyclin D1, a D-type cyclin that is not usually expressed at high levels in normal B lymphocytes.
Previous studies indicate that cannabinoid receptors are expressed in lymphoma and have shown that lymphoma cell death is induced as a result of exposure to cannabinoids (ligands). The aim of this diploma work was to combined cytostatics with the cannabinoid receptor ligand R (+)-Methanandmide (R-MA). Our data suggest that combination treatment with cytostatics and R-MA induces synergistic effects in most cases.
List of abbreviations
2-AG 2-arachidonoyl glycerol AEA Arachidonoylethanolamide CB Cannabinoid
CB1 Cannabinoid receptor 1 CB2 Cannabinoid receptor 2
CLL Chronic lymphocytic leukaemia CNS Central nervous system
LR Lower right-hand quadrant MCL Mantle cell lymphoma
MAPK Mitogen-activated protein kinases PI Propidium iodide
R-MA R(+)-Methanandmide THC ∆(9)tetrahydrocannabinol
Win55 (R)-(+)-[2,3-dihydro-5-methyl-3-(4-morpholinylmethyl)] UR Upper right-hand quadrant
Table of contents
1 Introduction______________________________________________________________5 1.1 Mantle cell lymphoma________________________________________________5
1.2 Chronic Lymphocytic Leukemia________________________________________5
1.3 The Endocannabinoid system__________________________________________6 1.4 The Cannabinoids receptors and their ligands_____________________________6
1.5 Ceramide__________________________________________________________8 1.6 Chemotherapeutic drugs used in lymphoma treatment_______________________8
2 Materials and methods______________________________________________________9
2.1 Cell culturing_______________________________________________________9 2.2 Cell proliferation kit (XTT)____________________________________________9 2.3 Cell death ELISA____________________________________________________9 2.4 Flow cytometric analysis______________________________________________10
3 Results_________________________________________________________________11 4 Discussion______________________________________________________________19 5 Acknowledgments________________________________________________________19 6 References______________________________________________________________20
1 Introduction
1.1 Mantle cell lymphoma (MCL)
Mantle cell lymphoma (MCL) is a lymphoid neoplasm which is characterized by an abnormal proliferation of mature B lymphocytes. MCL is characterized by short remissions and poor prognosis. The disease is rare and accounts for about 6% of all cases of non-Hodgkin
lymphomas and mainly affects older men . MCL usually begins with lymph node enlargement but it can spread to other tissues such as the liver, bone marrow and gastrointestinal tract[1]. The median survival in MCL is about 3 years[2]. The first pathogenetic even in mantle cell lymphoma is a genetic change involving chromosome 11 and chromosome 14, called a “reciprocal translocation,” and abbreviated as t(11;14)(q13;q32)(Fig.1)[3]. This leads to an overexpression of cyclin D1, a D-type cyclin that is not usually expressed at high levels in normal B lymphocytes.
Figure 1. The genetic change involving chromosome 11 and chromosome 14 occurs in about 85 % of the patients with MCL. That results in a overexpression of cyclin D1. Patients who do not overexpress cyclin D1 instead overexpress cyclin D2 or D3 [17].
1.2 Chronic Lymphocytic Leukemia (CLL)
Chronic lymphocytic leukemia (CLL) is an abnormal neoplastic proliferation of B
lymphocytes. CLL is the second most common type of leukemia in adults[4]. The symptom of CLL are enlarged lymph nodes like MCL, enlarged liver and spleen, fatigue, bone pain, excessive sweating, loss of appetite, weight loss e.g. The bone marrow is the starting point for CLL, but it can spread to blood, lymph nodes, spleen, central nervous system (CNS). The median survival of patients with CLL is around 10 years but the individual prognosis is highly variable. [5] D38 expression and the IgVH gene mutational status are independent predictors
of prognosis. Consequently, no association was found between CD38 expression and IgVH
1.3 The Endocannabinoid system
Previous studies indicate that cannabinoid receptors are expressed in lymphoma and have shown that lymphoma cell death is induced as a result of exposure to cannabinoids (ligands). The endocannabionoid system includes the cannabinoid receptors, endogenous cannabinoid ligands(endocannabinoids) and endocannabinoid-metabolizing enzymes. The name
cannabinoid derives from the fact that cannabinoid receptors are the targets of
D9-tetrahydrocannabinol (THC), the main psychotropic agent in the plant Cannabis sativa[19].
1.4 The Cannabinoids receptors and their ligands
Two different types av cannabinoid receptors have been identified and cloned in the early 1990s, the cannabinoid receptor 1 (CB1), and cannabinoid receptor 2 (CB2). CB1 is mostly located in the central nervous system but also in peripheral tissues, and CB2 mostly in the immune system. Low levels of CB2 have recently been detected in neuronal cells of the brain. Both CB1 and CB2 receptors transmit signals via inhibition of adenylyl cyclase and mitogen-activated protein kinases (MAPK) [7].
Two well studied endocannabinoids were identified some years after the cannabinoid receptors. The first endogenous cannabinoid ligand was isolated in 1992. It was arachidonoylethanolamide (anandamide, AEA) (Fig 2) and the second was
2-arachydonoylglycerol (2-AG)(Fig 3) in 1995.The name arachidonoylethanolamide derives from the Sanskrit word ananda, which means "bliss, delight".[8] Both are synthesized from phospholipids precursors. 2-arachydonoylglycerol (2-AG) has much higher serum and brain concentrations than anandamide [9].
Fig 3. The structure of 2-AG[8]
Anandamide is a weak CB1 and CB2 agonist. Endocannabinnoids are not stored in intracellular compartments like neurotransmitters, instead they are released upon demand from lipid precursors in the cytoplasmic membrane through enzyme activation[9].
Several synthetic cannabinoids have been engineered. Win-55 belongs to the substance group aminoalkylindoles, which is a non-selective agonist for both CB1 and CB2. There is another group called eicosanoids, which includes anandamide and analogues of anandamide such as R-(+)-methanandamide (R-MA)(Fig 4)[10]. R-MA is a metabolically stable analog of AEA [11].
1.5 Ceramide
Ceramide is a sphingolipid that regulates a variety of cellular processes including
proliferation, differentiation and apoptosis and it comprises approximately 2% of the total sphingolipid content of the cell. In some cases, cannabinoids have been shown to induce accumulation of ceramide, which mediates growth inhibition and cell death (Fig 5)[10]. There are two major pathways from which ceramide can be produced, de novo ceramide synthesis and sphingomyelin degradation [10].
Fig.5. First of all the cannabinoids bind to the CB1 and CB2 receptors. Signaling leading to apoptosis is mediated via the second messenger ceramide, which induces phosphorylation of p38. This in turn induces a loss of the mitochondrial membrane potential, which leads to caspase activation. Thereafter apoptosis takes
place[10].
1.6 Chemotherapeutic drugs used in lymphoma treatment
Doxorubicin: Doxorubicin is a chemotherapy drug that is given as a treatment for many different types of cancer. Doxorubicin intercalates between base pairs in the DNA helix, thereby preventing DNA replication and ultimately inhibiting protein synthesis. Doxorubicin also inhibits replication by blocking an important enzyme called topoisomerase II[15]. Ara-C (Cytarabine): Ara-C belongs to the category of chemotherapy called antimetabolites. When the cells incorporate Ara-C into the cellular metabolism, they are unable to divide.Ara-C is cell-cycle specific. That means they attack cells in the S phase[20].
2 Materials and methods
2.1 Cell culturing
The mantle cell lymphoma cell lines Rec-1, Jeko-1 and the chronic lymphocytic Leukemia cell line Mec-1 were grown at 37°C in 5 % CO2 and humified atmosphere. The Rec-1 cell line
was obtained from Dr. Christian Bastard, Ronan, France. Mec-1 and JEKO-1 were obtained from Deutsche Sammlung von Microorganismen und Zellkulturen (DSMZ; Braunschweig, Germany).Cells were grown in RPMI 1640 medium supplemented with 10% fetal bovine serum (FBS) and 50 цg of the antibiotic gentamicin. Both medium and supplements were from Invitrogen. All experiments were performed in serum-free AIM medium. This is due to the fact that R-MA is known to bind to serum, which would affect the results.
2.2 Cell viability assay
XTT(Biological Industries Kibbutz Beit) is a simple method for the determination of cell viability using standard micro plate absorbance readers. This method is mostly used to study growth factors and cytokines as well as screening for cytotoxic agents and lymphocyte activation. XTT is a tetrazolium derivative that measures cell viability based on the activity of mitochondria enzymes in live cells that reduce XTT and are inactivated shortly after cell death. [12]The viability tests were performed in AIM medium(Invitrogen). 200µl of cell suspension with different treatment was cultivated in a flat 96-well plate. The cells were incubated for 72 hours in 37°C and 5 % CO2. After the desired incubation period 50 µl XTT was added to each well and the plate was incubated for 4 hours. Afterward the absorbance was measured at a wavelength of 690 with an ELISA reader.
2.3 Cell death ELISA
Cell death ELISA (Roche, Mannhein, Germany) is a quantitative sandwich ELISA that detects histone and intranucleosomal DNA fragmentation by binding to 2 different monoclonal antidodies. The cells were washed and resuspended in AIM-V medium. 10 millions cells with different treatment that induce cell death were incubated for 24 h in 37°C and 5 % CO2. Lysis buffer was added and samples were incubated at room temperature for 30
min. The cells were transferd to 96-well plates. Anti-histone biotin and anti-DNA-POD and incubation buffer were added to each well and incubated for 2 hours in room temperature. Anti histone antibody reacts with the histones H1, H2A, H2B, H3 and H4 and anti-DNA POD antibody binds to single- and double-stranded DNA. After three washes with incubations buffer, the ABTS substrate was added for 20 minutes. Adding stop solution terminated the reaction, and the emission was determined at 405 nm[13][14].
2.4 Flow cytometric analysis
The distribution of the phospholipids of the plasma membrane is asymmetrical, this can be perceived between the inner and outer leaflets of the membrane. The substance
phosphatidylserine is situated on the inner surface. A disruption of the asymmetry occurs during the apoptosis phase and phosphatidylserine becomes released on the outside surface of the plasma membrane. Due to the fact that the anticoagulant protein Annexin V binds with high affinity to phosphatidylserine, fluorochrome conjugated annexin has found a method as a marker of apoptotic cells. This is specifically utilised for their detection by flow cytometry. A reaction is caused within the cells with annexin V, and they lose the ability to exclude cationic dyes as PI in the plasma membrane. This draws the conclusion
that by staining cells with a combination of annexin V and PI, there is likelihood to detect unaffected, non-apoptotic cells, early apaptotic cells and late apoptic cells.[21] Rec-1 and Jeko cells were treated with different treatment and harvested 24 h after treatment. Thereafter the cells were washed in PBS and resuspended in 100 µl binding buffer. 5µl of Annexin V-FITC and 5 ml of propidium iodide (PI) were added and incubated in dark for 15 min. Cells were then subjected to FACS analysis[16]. Annexin-V-PE aptosis Detection Kit (BD Biosciences Pharmingen) was used to detect apoptosis[10] .
3 Results
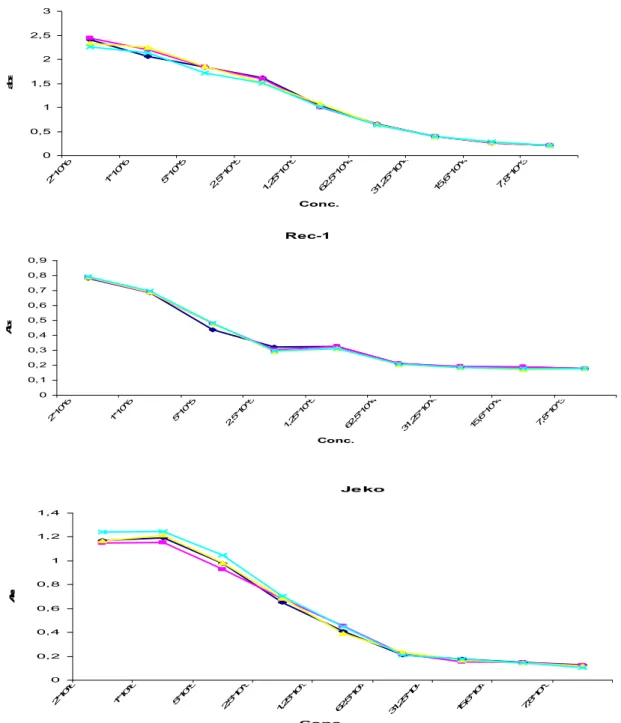
Before using the XTT assay it is necessary to optimize the method for the specific cell line. This is done by measuring the absorbance for different dilutions of the cells. You choose the cell number to be used in further experiments by looking at the area in which the relationship between cell concentration and absorbance is linear. Rec-1, Jeko (MCL) and Mec-1 (CLL) were incubated for 24h in AIM-V medium and the cell proliferation was estimated using XTT assay. The optimal concentration of Mec-1, Rec-1 and Jeko cell lines was 0, 5 million cells/ml (Fig 1).The range of cell concentrations was from 2*106 cells/ml to 7,8 * 103 cells/ml.
Mec-1 0 0,5 1 1,5 2 2,5 3 2*1 0^6 1*1 0^6 5*1 0^5 2,5 *10 ^5 1,2 5*1 0^5 62 ,5*1 0^4 31 ,25 *10 ^4 15 ,6*1 0^4 7,8 *10 ^3 Conc. a b s Rec-1 0 0,1 0,2 0,3 0,4 0,5 0,6 0,7 0,8 0,9 2*1 0^6 1*1 0^6 5*1 0^5 2,5 *10 ^5 1,2 5*1 0^5 62 ,5*1 0^4 31 ,25 *10 ^4 15 ,6*1 0^4 7,8 *10 ^3 Conc. A b s Je ko 0 0,2 0,4 0,6 0,8 1 1,2 1,4 2*1 0^6 1*1 0^6 5*1 0^5 2,5 *10 ^5 1,2 5*1 0^5 62 ,5*1 0^4 31 ,25 *10 ^4 15 ,6*1 0^4 7,8 *10 ^3 Conc. A b s
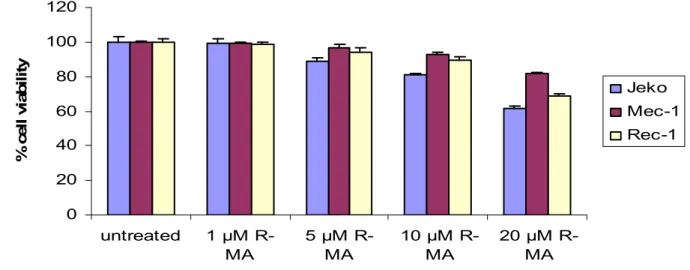
In order to find the optimal dose of R-MA I performed a titration. Mec-1, Rec-1 and Jeko cells were treated with different dose of R-MA for 72 hours in AIM-V medium (Fig 2). The dose below 5 µM R-MA had no effect on viability. 10ul was chosen as the optimal dose, as it has earlier been shown that higher doses are not specific for the cannabinoid receptors.
0 20 40 60 80 100 120 untreated 1 µM R-MA 5 µM R-MA 10 µM R-MA 20 µM R-MA % c e ll v ia b il it y Jeko Mec-1 Rec-1
Figure 2. Viability of the different cell lines after treatment with different doses of R-MA for 72 h in AIM-V medium measured with the XTT assay.
Titration was also performed in order to acquire the optimal dose of doxorubicin to be used in combination with R-MA.
The different cell lines display a variable loss of viability after treatment with doxorubicin (Fig 3). The cell lines were treated for 72 h with increasing doses of doxorubicin. For further experiments I chose 200 and 300nm due to their high effects and the fact that higher doses of doxorubicin are known to be toxic to normal cells.
0
20
40
60
80
100
120
un
tre
at
ed
nM
d
ox
or
ub
ic
in
nM
d
ox
or
ub
ic
in
nM
d
ox
or
ub
ic
in
nM
d
ox
or
ub
ic
in
nM
d
ox
or
ub
ic
in
%
c
e
ll
v
ia
b
il
it
y
Jeko
Mec-1
Rec-1
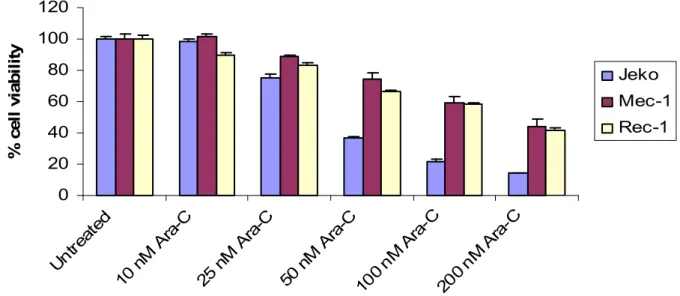
The last titration was performed in order to acquire the optimal dose of Ara-C to be used in combination with R-MA. I chose 50nM and 100nM due to their high effects and the fact that higher doses of Ara-C are known to be toxic to normal cells. The different cell lines were seeded at a concentration of 0, 5*106 cells/ml in a 96-well plate and exposed to different concentrations of cytarabin (AraC). The cell lines were treated for 72 hour in AIM-V medium with increasing doses of Ara-C (Fig 4).
0 20 40 60 80 100 120 Un trea ted 10 n M A ra-C 25 n M A ra-C 50 n M A ra-C 100 nM Ara -C 200 nM Ara -C % c e ll v ia b il it y Jeko Mec-1 Rec-1
Figure 4. The different cell lines were treated with Ara-C and incubated for 72 hours in AIM-V medium. Cell proliferation was estimated by using XTT assay.
In the first experiment the different cell lines were treated with 10 µM R-MA in combination with Ara-C (Fig 5). The concentration of Ara-C we used was 50 and 100 nM. Cells were incubated for 72h in AIM-V medium and the cell proliferation was estimated using XTT assay. R-MA and Ara-C induced synergistic in both Jeko and Rec-1 but not in Mec-1.
Mec-1 0 20 40 60 80 100 120
untreated 10µM R-MA 50 nM Ara-C 100 nM Ara-C 10 µM R-MA+ 50 nM Ara-C 10 µM R-MA+ 100 nM Ara-C % c e ll v ia b il it y Rec-1 0 20 40 60 80 100 120
untreated 10µM R-MA 50 nM Ara-C 100 nM Ara-C 10 µM R-MA+ 50 nM Ara-C 10 µM R-MA+ 100 nM Ara-C % c e ll v ia b il it y Jeko 0 20 40 60 80 100 120
untreated 10µM R-MA 50 nM Ara-C 100 nM Ara-C 10 µM R-MA+ 50 nM Ara-C 10 µM R-MA+ 100 nM Ara-C % c e ll v ia b il it y
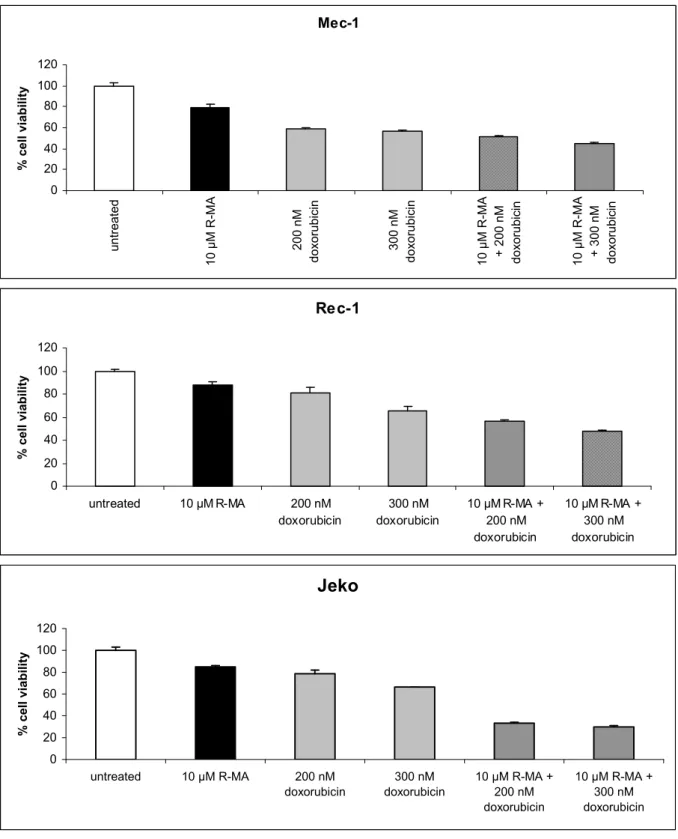
In the next experiment the cell lines were treated with 10 µM R-MA in combination with 200 nM or 300 nM of Doxorubicin (Fig 6). Cells were incubated for 72h in AIM-V medium and the viability was measured with the XTT assay. R-MA and doxorubicin showed synergistic effects in both Jeko and Rec-1 but not in Mec-1.
Mec-1 0 20 40 60 80 100 120 u n tr e a te d 1 0 µ M R -M A 2 0 0 n M d o x o ru b ic in 3 0 0 n M d o x o ru b ic in 1 0 µ M R -M A + 2 0 0 n M d o x o ru b ic in 1 0 µ M R -M A + 3 0 0 n M d o x o ru b ic in % c e ll v ia b il it y Rec-1 0 20 40 60 80 100 120 untreated 10 µM R-MA 200 nM doxorubicin 300 nM doxorubicin 10 µM R-MA + 200 nM doxorubicin 10 µM R-MA + 300 nM doxorubicin % c e ll v ia b il it y Jeko 0 20 40 60 80 100 120 untreated 10 µM R-MA 200 nM doxorubicin 300 nM doxorubicin 10 µM R-MA + 200 nM doxorubicin 10 µM R-MA + 300 nM doxorubicin % c e ll v ia b il it y
In order to investigate if the decreased viability was caused by cell death, the MCL cell lines Jeko and Rec-1 were treated with 10 µM R-MA in combination with Ara-C. Cells were incubated for 24h in AIM-V medium and were measured with the Flow Cytometric Analysis. The cells were labeled with Annexin V and propidium iodide. The concentration of Ara-C we used were 50 nM and 100 nM (Fig 7). R-MA and Ara-C induced additive effect in Rec-1 but not in Jeko. 081216.021 100 101 102 103 104 Annexin V FITC Control R-MA 99,90% 0,08% 0,01% 0,01 % 081216.025 100 101 102 103 104 Annexin V FITC 1,17% 84,60% Control 7,22 % 7,02% 50 nM Ara-C 081216.030 100 101 102 103 104 Annexin V FITC 0,24% 6,59% 84,32% 8,86% 081216.032 100 101 102 103 104 Annexin V FITC 0,78 % 13,8 5% 77,1 7% 8,21 % 100 nM Ara-C 081216.031 0,26% 8,0% 83,55% 8,18% 081216.033 0,40% 10,02% 11,65% 78,13%
Rec-1
Control R-MA Control 081216.041 100 101 102 103 104 Annexin V FITC 081216.045 100 101 102 103 104 Annexin V FITC 99,98% 0,02% 2,03% 19,55% 71,02% 7,40% 50 nM Ara-C 081216.050 100 101 102 103 104 Annexin V FITC 1,70% 13,08% 78,96 % 6,26% 081216.052 100 101 102 103 104 Annexin V FITC 2,30 % 22,14% 66,46 % 7,11% 081216.051 100 nM Ara-C 1,84% 15,84 % 76,70 % 5,62 % 081216.053 4,75 % 23,62 % 64,98 % 6,64 %Jeko
Next the cell lines Jeko and Rec-1 (MCL) were treated with 10 µM R-MA in combination with 200 nM and 300 nM Doxorubicin. Cells were incubated for 24h in AIM-V medium. Thereafter the cells were labelled with Annexin V and PI and analyzed by flow cytometri (Fig 8). R-MA and Ara-C induced additive effect in Rec-1 but not in Jeko.
Figure 8 Jeko and Rec-1 (MCL) were treated with Doxorubicin alone or in combination with R-MA. Flow cytometry analysis of Annexin V and propidium iodide was performed. One representative cytogram showing early apoptotic cells that bind to Annexin V-FITC but exclude PI, lower right-hand quadrant (LR), and late apoptotic/necrotic cells that bind to both Annexin V-FITC and PI, upper right-hand quadrant (UR).
081216.021 100 101 102 103 104 Annexin V FITC Control Control R-MA 99,90% 0,08% 0,01% 0,01 % 081216.025 100 101 102 103 104 Annexin V FITC 1,17% 7,22% 84,60% 7,02% 200 nM Doxorubicin 081216.026 100 101 102 103 104 Annexin V FITC 0,34 % 5,99 % 89,78 % 3,89 % 081216.028 100 101 102 103 104 Annexin V FITC 0,61 % 11,96% 78,84% 8,59% 300 nM Doxorubicin 081216.027 100 101 102 103 104 Annexin V FITC 0,39% 6,59% 87,91% 5,11% 081216.029 100 101 102 103 104 Annexin V FITC 0,49% 10,87% 81,06% 7,58%
Rec-1
081216.041 100 101 102 103 104 Annexin V FITC 99,98% 0,02 % Control R-MA Control 081216.045 100 101 102 103 104 Annexin V FITC 71,02 % 7,4 % 2,03% 19,55% 200 nM doxorubicin 081216.046 100 101 102 103 104 Annexin V FITC 1,87% 14,67% 78,07% 5,40% 081216.048 100 101 102 103 104 Annexin V FITC 1,84% 21,50% 69,16% 7,50 % 300 nM doxorubicin 081216.047 100 101 102 103 104 Annexin V FITC 1,64 % 14,03% 78,39% 5,96% 081216.049 100 101 102 103 104 Annexin V FITC 70,74 % 7,22% 2,28% 19,77%Jeko
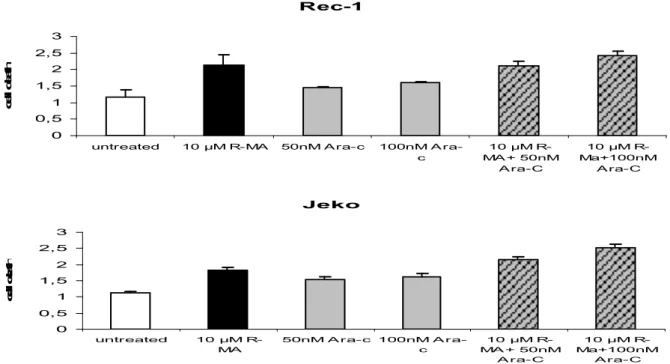
To investigate the amount of apoptosis after treatment with 10 µM R-MA in combination with Ara-C I performed cell death ELISA. MCL cell lines Jeko and Rec-1 were resuspended in AIM-V medium and treated with R-MA in combination with Ara-C for 24 h (Fig 8). Thereafter the cell death ELISA was performed, and fluorescence units are shown on the y-axis. We also treated Jeko and Rec-1 with MA in combination with Doxorubicin (Fig9). R-MA in combination with both Ara-C and Doxorubicin induced additive effects on both Jeko and Rec-1 cell lines.
Rec-1 0 0,5 1 1,5 2 2,5 3
untreated 10 µM R-MA 50nM A ra-c 100nM A ra-c 10 µM R-MA + 50nM A ra-C 10 µM R-Ma+100nM A ra-C c e ll d e a th Jeko 0 0,5 1 1,5 2 2,5 3 untreated 10 µM R-MA 50nM A ra-c 100nM A ra-c 10 µM R-MA + 50nM A ra-C 10 µM R-Ma+100nM A ra-C c e ll d e a th
Figure 8. R-MA in combination with Ara-C induce cell death. The cell death ELISA was performed.
Rec-1 0 0,5 1 1,5 2 2,5 3 untreated 10 µM R-MA 200nM doxorubicin 300nM doxorubic in 10 µM R-MA +200nM doxorubic in 10 µM R-MA +300nM dox orubic in c e ll d e a th Je ko 1 1,5 2 2,5 3 c e ll d e a th
4 Discussion
Mantle cell lymphoma (MCL) is a moderately aggressive disease, which is not curable with chemo-immunotherapy. The median survival duration is short, approximately three years. Observations were made by Gustafson et al [10] that cannabinoids induce receptor-mediated apoptosis in mantle cell while normal cells remain unaffected.
The use of cytostatics is an effective way in controlling tumour growth. It works by
preventing the tumour cells from dividing and growing, and since tumour cells divides faster than normal cells cytostatics is very effective against these.
Normally when treating patients with cytostatics you use a combination of several different cytostatics in order to attack cell division at different points of the process. The older patients cannot receive high doses of cytostatics without the potential of getting seriously ill. In order to deal with this problem I performed experiments in which I combined cytostatics with the synthetic cannabinoid R (+)-Methanandmide (R-MA).The two types of cytostatics we used in this studies(Ara-C and Doxorubicin) are often included in the treatment of lymphomas. The mantle cell lymphoma cell lines Rec-1, Jeko-1 and chronic lymphocytic leukemia cell line Mec-1 were treated with the R-MA with and without combination of chemotherapeutic drugs. My results suggest that a combination of a low dose of cytostatica with R-MA induces more cell death than just treatment with cytostatica.
R-MA is known to induce cell death by apoptosis whereas cytostatics induces cell cycle arrest in the cells. And since the low dose of cytostatica wouldn’t affect older persons in a negative way, this combinatorial treatment could in theory be used in in vivo treatments in the future.
5 Acknowledgments
It is suitable to thank my supervisors for this study, Jenny Flygare and Kristine Gustafsson for giving me opportunity to perform my master project at Department of Laboratory Medicine, Division of Pathology, Karolinska Institutet.
I acknowledge Marcus Nordgren, my partner in the cell lab for sometimes splitting my cell lines and for all non scientific discussions down in the canteen. And last but not least I would like to give a special thanks to my examiner Professor Carl Påhlson.
6 References
[1] Decaudin, D. (2002) Mantle cell lymphoma: a biological and therapeutic paradigm. Leuk. Lymphoma 43, 773-781.
[2]Andreas Rosenwald, Elias Campo The proliferation gene expression signature is a quantitative integrator of oncogenic event that predicts survival in mantle cell lymphoma.
[3]http://www.bio.davidson.edu/Courses/immunology/Students/spring2006/Fried/mantelcell.ht [4] E. Montserrat & C. Moreno Chronic lymphocytic leukaemia: a short overview
[5] Kostareli E, Smilevska T, Chronic lymphocytic leukaemia: an immunobiology approach [6]Maurizio Bifulco, Cannabinoids and cancer:pros and cons of antitumour strategy
[7] Jenny flygare The endocannabinoid system in cancer [8] wikipedia.org/wiki/2-arachidonoylglycerol
[9]Balapal.S Basavarajapp Critical Enzymes involved in Endocannabinoid Metabolism
[10] Kristin Gustafsson Cannabinoid Receptor-mediated apoptosis induced by R(+)Methanandaminr and Win 55 [11]T u järbe (R)-methanandamide and Delta 9-THC as discriminative stimuli in rats.
[12]mdbiosciences.com/CellProliferationkitWithXttReagent.html
[13] Oliveras-Ferraros C Growth and molecular interactions of the anti-EGFR antibody Cetuximab and the DNA cross-linking agent cisplatin in gefitinib-resistant MDA-MB-468 cells: New prospects in the treatment of triple-negative/basal-like breast cancer
[14] http://www.roche-applied-science.com/pack-insert/1544675a.pdf
[15] http://www.chemocare.com/bio/arac.asp
[16] Xia Chen, Jie LiuSalidroside attenuates glutamate-induced apoptotic cell death in primary cultured hippocampal neurons of rats
[17] www.bio.davidson.edu/Courses/immunology/Students/spring2006/Fried/characterisictranslocations.jpg
[18] J Dürig The pattern of CD38 expression defines a distinct subset of chronic lymphocytic leukemia (CLL) patients at risk of disease progression.
[19] Kent-Olve Jonsson, The Endocannabinoid System: Current Pharmacological reasearch and therapeutic possibilities
[20] www.chemocare.com/bio/arabinosylcyosine.asp
[21] Piotr Pozarowski Current protocols in Cell biology(200)18.8.1-18.8.33
[22] Wilborn J, Bailie M, Coffey M, Burdick M, Strieter R, Peters-Golden M. Constitutive activation of 5-lipoxygenase in the lungs of patients with idiopathic pulmonary fibrosis. J Clin Invest 1996;97(8):1827-36

![Fig 2. The structure of AEA[8].](https://thumb-eu.123doks.com/thumbv2/5dokorg/4899157.134519/6.892.102.570.733.957/fig-the-structure-of-aea.webp)
![Fig 3. The structure of 2-AG[8]](https://thumb-eu.123doks.com/thumbv2/5dokorg/4899157.134519/7.892.105.573.106.373/fig-the-structure-of-ag.webp)