Bachelor Thesis in
Aeronautical Engineering
15 credits, Basic level 300
School of Innovation, Design and EngineeringInvestigation of Different Airfoils on Outer
Sections of Large Rotor Blades
Authors: Torstein Hiorth Soland and Sebastian Thuné Report code: MDH.IDT.FLYG.0254.2012.GN300.15HP.Ae
Sammanfattning
Vindkraft står för ca 3 % av jordens produktion av elektricitet. I jakten på grönare kraft, så ligger mycket av uppmärksamheten på att få mer elektricitet från vindens kinetiska energi med hjälp av vindturbiner.
Vindturbiner har använts för elektricitetsproduktion sedan 1887 och sedan dess så har turbinerna blivit signifikant större och med högre verkningsgrad.
Driftsförhållandena förändras avsevärt över en rotors längd. Inre delen är oftast utsatt för mer komplexa driftsförhållanden än den yttre delen. Den yttre delen har emellertid mycket större inverkan på kraft och lastalstring. Här är
efterfrågan på god aerodynamisk prestanda mycket stor.
Vingprofiler för mitten/yttersektionen har undersökts för att passa till en 7.0 MW rotor med diametern 165 meter. Kriterier för bladprestanda ställdes upp och sensitivitetsanalys gjordes. Med hjälp av programmen XFLR5 (XFoil) och Qblade så sattes ett blad ihop av varierande vingprofiler som sedan testades med bladelement momentum teorin. Huvuduppgiften var att göra en simulering av rotorn med en aero-‐elastisk kod som gav information beträffande
driftsbelastningar på rotorbladet för olika vingprofiler. Dessa resultat
validerades i ett professionellt program för aeroelasticitet (Flex5) som simulerar steady state, turbulent och wind shear.
De bästa vingprofilerna från denna rapportens profilkatalog är NACA 63-‐6XX och NACA 64-‐6XX. Genom att implementera dessa vingprofiler på blad design 2 och 3 så erhölls en mycket hög prestanda jämfört med stora kommersiella HAWT rotorer.
Abstract
Wind power counts for roughly 3 % of the global electricity production. In the chase to produce greener power, much attention lies on getting more electricity from the wind, extraction of kinetic energy, with help of wind turbines.
Wind turbines have been used for electricity production since 1887 and have since then developed into more efficient designs and become significantly bigger and with a higher efficiency.
The operational conditions change considerably over the rotor length. Inner sections are typically exposed to more complex operational conditions than the outer sections. However, the outer blade sections have a much larger impact on the power and load generation. Especially here the demand for good
aerodynamic performance is large.
Airfoils have to be identified and investigated on mid/outer sections of a 7.0 MW rotor with 165 m diameter. Blade performance criteria were determined and investigations like sensitivity analysis were made. With the use of XFLR5 (XFoil) and Qblade, the airfoils were made into a blade and tested with the blade
element momentum theory. This simulation gave detailed information regarding performance and operational loads depending on the different airfoils used. These results were then validated in a professional aero-‐elastic code (Flex5), simulating steady state, turbulent and wind shear conditions.
The best airfoils to use from this reports airfoil catalogue are the NACA 63-‐6XX and NACA 64-‐6XX. With the implementation of these airfoils, blade design 2 and 3 have a very high performance coefficient compared to large commercial HAWT rotors.
Carried out at: Statoil ASA, R&D NEH OWI
Advisor at MDH: Sten Wiedling (KTH)
Advisor at Statoil ASA: Andreas Knauer, Dr.-‐Ing.
Examiner: Mirko Senkovski
Nomenclature
B – Number of Blades
BEM – Blade Element Momentum theory
c – Chord length (m)
Cd – Section Drag Coefficient
CD – Total Drag Coefficient
Cl – Section Lift Coefficient
CL – Total Lift Coefficient
Cl/Cd – L/D – Lift to drag ratio
Cm – Pitching Moment Coefficient
CP – Pressure Coefficient / Performance Coefficient
H12, H32 – Shape factor
HAWT – Horizontal-‐Axis Wind Turbine
M – Mach number
NACA – National Advisory Committee for Aeronautics P – Power output (W) p – Pressure (Pa) R – Global radius (m) r – Local radius (m)
RPM – Revolutions Per Minute
S.U., S.L. – Separation Upper and Separation Lower
T.U., T.L – Transition Upper and Transition Lower
t/c – Thickness to chord ratio (%)
V – Free stream wind speed (m/s)
x/c – Location along the chord (m)
α – AoA – Angle of Attack (degrees °)
β – Inflow angle (degrees °)
Γ – Circulation
γ – Twist angle (degrees °)
δ1, δ2, δ3 – Displacement, Momentum and Energy thickness
η – Efficiency
λ -‐ TSR – Tip Speed Ratio
μ – Dynamic viscosity (𝑃𝑎 ⋅ 𝑠)
ρ – density (kg/m3)
Ω – Angular velocity (rad/s)
SAMMANFATTNING 2 ABSTRACT 3 NOMENCLATURE 5 1. INTRODUCTION 9 2. HISTORICAL PERSPECTIVE 10 3. AIRFOILS 15
3.1 National Advisory Committee for Aeronautics (NACA) 15 3.2 National Renewable Energy Laboratory (NREL) 17
4. METHODS 18
4.1 Historical Turbines 18
4.2 General Blade Design Criteria 18
4.2.1 Blade Performance Criteria 19 4.2.2 Inner Root Section Criteria 20 4.2.3 Middle Section Criteria 21
4.2.4 Outer Section Criteria 21
4.2.5 Blade Section Calculation 21
4.2.6 Specific Blade Design 22
4.2.7 Blade Design Procedure 23
4.3 Airfoil Catalogue and Roughness Insensitivity Analysis 24
4.3.1 Airfoil Design for Wind Turbines With Roughness Insensitivity 25
4.3.2 Boundary Layer Theory 28
4.4 Blade Element Momentum (BEM) Theory 32
4.4.1 Momentum Theory 32
4.4.2 Blade Element Theory 33
4.5 Qblade 38
4.5.1 General Validation of Simulation Results 38
4.6 Javafoil 39 4.6.1 Roughness analyses 39 4.6.2 Limitations 40 4.7 Flex5 41 5. RESULTS 42 5.1 Historical Turbines 42
5.1.1 Gedser Wind Turbine 42
5.1.2 MOD-‐2 Turbine 44
5.2 Blade Design Criteria 47
5.4 Qblade Blade Design and Turbine Simulation 50
5.4.1 Blade Design 1 50 5.4.2 Blade Design 2 56 5.4.3 Blade Design 3 61 5.5 Flex5 66 5.5.1 Blade Design 2 67 5.5.2 Blade Design 3 71 6. DISCUSSION 74 6.1 Historical Turbines 74
6.1.1 Gedser Wind Turbine 74
6.1.2 MOD-‐2 Turbine 74
6.2 Roughness Insensitivity Analysis 76
6.3 Qblade 76 6.3.1 Blade Design 1 76 6.3.2 Blade Design 2 77 6.3.3 Blade Design 3 78 6.4 Flex5 79 6.4.1 Blade Design 2 80 6.4.2 Blade Design 3 81
6.5 Comparison of Qblade and Flex5 82
7. CONCLUSION 83
8. FURTHER WORK 84
APPENDIX A 85
Airfoil Catalogue 85
APPENDIX B 104
Use of Qblade 104
APPENDIX C 108
Airfoil Catalogue 108
APPENDIX D 111
Example of Aerodynamic Data and Blade Geometry Input for Flex5 111
APPENDIX E 113
Wind Shear Simulation in Flex5 113 Turbulence Simulation in Flex5 115
1. Introduction
The selection of airfoil shape directly influences the efficiency and loading of wind turbine rotors. In this graduate project at Mälardalens Högskola and carried out at Statoil Research Center in Bergen, Norway, several airfoils have been investigated for use in offshore wind turbine operation. The selected airfoils are for the use on a 7.0 MW turbine with a diameter of 165 m. Statoil, primary an oil company, is also involved in the offshore wind turbine industry, especially as an operator of wind farms. Statoil has an interest in the trends in turbine size and airfoils being used.
The first part of the report is a study of performance criteria for airfoils and blade design. Since wind turbine operation is somewhat different to aircraft operation, a literature study was performed. An introduction to the history of wind energy and development trends is also included. Historical wind turbine blades were studied and analyzed, so that operational/test data and software data could be compared to newer turbines.
The second part consists of airfoil analyses, primarily for the middle and outer sections of a large rotor blade, based on performance criteria. An airfoil
catalogue was developed including aerodynamic performance data and roughness insensitivity. Experimental data and analysis tools, such as XFoil (XFLR5) and Javafoil were used.
The third part of the report is the main part. Blade design optimization was developed in Qblade. By combining 2D airfoil aerodynamic performance coupled with the Blade element momentum theory and a 3D correction, a viable result was achieved.
The last part is a rotor investigation of the results from part three. This was done in aero-‐elastic simulation with Flex5. The blade optimized in Qblade was verified by employing professional software.
Since this is a public report in collaboration with industry, there were certain limitations to the use of airfoil geometry. Because of license and other
limitations, only airfoil geometry found easily on the Internet was investigated. Therefore, a handful of different airfoils have not been studied in this project and entire airfoil families have been excluded, especially the Risøe A-‐ family, which is licensed, tailored wind turbine airfoils.
Since the airfoils used were open source, there was no opportunity to validate the correctness of the airfoil geometry. An assumption was made that they are.
XFoil, Qblade and Javafoil only account for steady state, incompressible laminar flow while the real operational state would differ from this. Compressibility was not taken account of, since the blade rotation will be less than Mach 0.3. As for
10 turbulent flow and wind shear, which a real turbine will encounter during
normal operation, this is checked in Flex5.
A wind turbine blade designer has to take account of structural limitations. Because of the limited time, the project did not include a structural investigation of the blades. Avoiding very sophisticated blade structures and keeping to industry standards, the structural limitations would presumably not need detailed investigation.
General losses due to mechanical and electrical efficiencies have not been
analyzed. Losses have been set at 3 % for calculations, except when other values were given.
2. Historical Perspective
A wind turbine is a machine that converts kinetic energy into mechanical energy and the mechanical energy is then usually converted into electrical energy through a generator. There are two major types of wind turbines:1 Horizontal-‐ axis and Vertical-‐axis, the horizontal being the primary type used.
The first use of windmills where in old Persia in the 7th century, introduced in Europe during the 15th century. The windmills got towers, twisted blades, tapered planforms and control devices to point the mill into the wind in the 17th century. The Dutch brought the windmill expertise to North America in the 18th century, where wind energy was used to pump water.
The first horizontal-‐axis wind turbine (HAWT) for generating electricity was built in Scotland, in 1887. In the early 1890s, the Danish scientist Poul la Cour was the first to discover that fast rotating turbines with fewer rotor blades were more efficient in generating electricity over slow rotating drag or impulse wind turbines.
In 1931 in Yalta, in the Soviet Union, a predecessor to the modern HAWT was built. It had a 30 m high tower producing 100 kW. The wind turbine had a maximum efficiency of 32 %, which is still respectable at today’s standards.
Ten years later, the pioneering Smith Putman wind turbine was built in Pennsylvania and ran for four years, until it encountered a blade failure. The device had a two-‐bladed variable pitch rotor working downwind of the tower. The rotor was 53 meters in diameter with a rotational speed of 28 rpm, giving a peak output rating of 1.25 MW and was therefore the first producing in excess of 1 MW. The blades were untwisted and rectangular with a chord of 3.7m and consisted of NACA 4418 airfoil.
Ulrich Hütter pioneered the industry in Germany during the 1950´s using innovative materials and designs for several different horizontal axis wind turbines. The turbines were medium sized with rotors made of glass fiber
reinforced plastic and had an airfoil shape. This, combined with variable pitch system, resulted in a lightweight and efficient wind turbine. Hütter also
developed a load shedding design (teeter hinge) that decouples the gyroscopic force from the turbine, which is still being employed today. Through the work of Ulrich Hütter the European wind turbine industry had a great advantage over the rest of the world for several years.
Johannes Juul developed and built the Gedser wind turbine (Figure 1) in
Denmark in the early 1950s2. It operated for eleven years and was shut down in 1966. During these years it generated an annual average of 450 MWh. At the request of NASA, the turbine was repaired and ran for another three years in the 1980´s for testing purposes. 3
Figure 1: Gedser wind turbine4
12 The Gedser turbine had three twisted fixed pitch rotor blades mounted upwind of the tower with a diameter of 24 m where the outer 9 m of each blade was of useful surface having the NACA 4312 and later the CLARK Y airfoil shape.
An asynchronous generator held the nominal rotation speed of the rotor. In case of disconnection from the grid and racing, ailerons placed at the tip turned 60 degrees by the action of a servomotor controlled by a flywheel regulator. The Gedser turbine was at that time the largest turbine in the world and operated without any significant maintenance for eleven years. More specifications are found in Table 1.
Table 1: Gedser wind turbine specifications
After the Smith Putman wind turbine was decommissioned due to economies and the failure of a rotor blade, development in wind energy in the US laid
dormant until the oil crisis in 1973. Since 1940 the development in the aerospace sector had skyrocketed with the introduction of jet airliners. With more powerful computers, better materials and better general engineering skills in designing large aluminum structures, the wind energy industry had better opportunities for success.
The MOD turbine family5 (Table 2) developed in cooperation between NASA and aircraft makers, was a two bladed design with blade diameters and design power ranging from 37.5 m and 0.1 MW to 128 m and 7.2 MW. This family of turbines did not result in sufficient reliability and an economic producer of electricity. They were merely used to understand what was going to work and what was not. The first design only lasted four weeks, before failure, as opposed to the earlier Smith Putman design, that lasted four years.
Gedser Wind Turbine
Rotor blades Three fixed twisted blade Rotor position Upwind
Airfoil NACA 4312, CLARK Y Useful blade length 9 meters
Diameter 24 meters
Blade chord 1.54 meters Rotational speed, rpm 30
Design tip speed ratio, TSR 4.4
Twist 16 degrees at root, 3 degrees at tip Cut-‐in wind speed Self starting at 5 m/s
Cut-‐out wind speed 20 m/s
Table 2: MOD turbine family specifications
Problems Boeing and NASA encountered during the development were the weight of the turbines and the cost of producing them. Also, the MOD-‐1 turbine produced audible vibrations, because of the interaction between rotor and tower. Therefore, the next generation turbine model MOD-‐2 (Figure 2) was built with the rotor upstream of the tower.
General Electric and Boeing designed the third generation MOD-‐5A and MOD-‐5B having diameters of 122 m and 128 m respectively giving 6.2 and 7.2 MW output. The 5B version also used a variable speed generator instead of constant speed generators, as used on earlier models. After this model the MOD project was terminated due to ending of government funding in the mid 1980s. During the MOD period, a lot of smaller wind turbine producers gained experience in smaller scale wind turbines powering 50 – 100 kW generators.
Figure 2: Mod-‐2 turbine
MOD-‐0 MOD-‐0A MOD-‐1 MOD-‐2 Number of rotor blades 2 2 2 2 Rotor position Downwind Downwind Downwind Upwind Rotational speed, rpm 40 40 34.7 17.5 Generator output, MW 0.1 0.2 2.0 2.5
Airfoil section NACA-‐23000 NACA-‐23000 NACA-‐44XX NACA-‐23024 Effective swept area,
m2
1.072 1.140 2.920 6.560 Rotor diameter, m 37.5 37.5 61 91.5 Max rotor performance
coefficient, Cp, max
14 From the end of the 1980s until today, engineering in general has had a huge evolution, especially computing power and computer simulations. With computer tools wind turbines are easier, more cost effective to design and are therefore less expensive to develop and produce. Some of the largest wind turbine manufacturers are as of today:6 Vestas, Sinovel, Goldwind, Gamesa, Enercon, GE Wind Energy, Suzlon and Vestas/Siemens.
Wind turbines have also been situated offshore for better wind resource, thus creating more energy. These wind turbines are put on concrete casings that are attached to the seabed. Statoil was the first to put a wind turbine onto a floating device in 2009. This turbine, named Hywind,7 has a 2.3 MW Siemens turbine on top of a floating element that extends 100 m beneath the water surface. The rotor diameter is 82.4 m and Hywind can be placed anywhere as long as the ocean depth is between 120 and 700 m.
Vestas is currently developing the largest onshore/offshore wind turbine. It is a 7.0 MW turbine with a rotor diameter of 164 m.8 The prototype is expected operational in the fourth quarter of 2012 and series production to begin in the first quarter of 2015. The largest wind turbine in use today, by rotor diameter, is the G10X by Gamesa,9 which has a diameter of 128 m.
Table 3 shows configuration types used on wind turbines. In the early 1980s wind turbines were merely stall regulated, fixed speed and employed a gearbox. The stall regulated type encountered vibrations and oscillations when stall occurred, which decreased the turbine life. Also, a fixed speed and a gearbox meant that the turbine had to speed up before connecting to the electrical grid and therefore could only produce in a certain wind speed range.
Table 3: Wind turbine technology trend
In the 21st century, the trend is to use pitch regulated, variable speed and direct drive wind turbines so it is possible to extract energy through a wider wind speed range.
For wind energy to be cost effective, the trend is towards larger turbines, which means a larger rotor sweep area. This is necessary, since the power transferred to the generator is directly proportional to the rotor surface area. From old trend estimates, the industry was to have turbines operational in 2010 with a rotor diameter of 150 m driving 10 MW generators.10 As of 2012, this estimate should
Early 1980´s Early 1990´s Late 1990´s 2000 -‐ 2007 Stall Regulated X X Active Stall X Fixed speed X X X X Limited variable speed X Gearbox X X X X X X Pitch Regulated X X X X X Variable Speed X X X X Direct Drive X X X X “Multibrid” X X
have been a bit lower, with the introduction of the Vestas V164-‐7.0 MW turbine in the fourth quarter of 2012. The trend estimate for 2020 is for wind turbines up to 20 MW with rotor diameters of 250 meters, which is shown in Figure 3. Wind turbines rotor diameter is expected to increase by around 5 m per year starting the upcoming decade.
Wind energy power plants at onshore locations are expected to prove viable as an economic source of energy, as opposed to offshore wind power having difficulties to overcome. Risø DTU (Technical University of Denmark) set the target for cost reduction to 50 % for offshore wind power, to be competitive to coal-‐fired power by 2020.11
Figure 3: Wind turbine size trend estimate (1980 -‐ 2020)12
3. Airfoils
Different airfoil shapes have been developed over the years with NACA as the first systematic numerically defined standard and numerous other designs later on. There also exist airfoils developed for wind turbines only.
3.1 National Advisory Committee for Aeronautics (NACA)
Before NACA developed their famous airfoil series, they used theoretical methods instead of geometrical methods to design their profiles. The designs were rather arbitrary with the only thing to guide NACA being past experience with known shapes and experimentation with modifications to those shapes. Those methods began to change in the early 1930s when NACA published a report titled ‘The Characteristics of 78 Related Airfoil Sections from Tests in the
16 similarities between the airfoils that were most successful, and that the two primary variables that affected those were the slope of the airfoil mean camber line and the thickness distribution. Incorporating these two variables into equations, NACA generated entire families of airfoils. The first two families were the 4/5-‐digit series where the series numbers define the shape of the airfoil in percentage of the chord length. 13
For the four-‐digit series, the fist digit specifies the maximum camber (m) in percentage of the chord length, the second digit indicates the position of the maximum camber (p) in percentage of the chord multiplied by ten, and the last two numbers provide the maximum thickness (t) of the airfoil in percentage of the chord. Description of airfoil nomenclature is shown in Figure 4.
Figure 4: Airfoil nomenclature for an NACA XXXX14
For a NACA 4412 with a chord length of 2 m, the maximum camber would be 4% of 2 m; the maximum camber would occur 40 % behind the leading edge; and the maximum thickness of the airfoil would be 12 % of 2 m. By utilizing the m, p and t values, it is possible to compute the coordinates for an entire airfoil.
For the five-‐digit series, the first and the last two digits designate camber and thickness as in the four-‐digit series. However, the second digit indicates the location of maximum camber in the twentieths of a chord rather than tenth as in the four-‐digit series. The middle digit is an indication on whether it is a straight mean camber line (0) or a curved mean camber line (1).
The 6–series airfoil family were the first NACA airfoils to be developed through an inverse design. At a later stage, the family has also been changed, thus the letter A can be included in the NACA code. The modification (A) leads to a less cusped trailing edge region. The 6–series has a high Cl, max, very low drag over a small range of operating conditions and it is optimized for high speeds. However, the airfoil has a high pitching moment, poor stall behaviour, suscseptible to roughness and has a high drag outside of its optimum range of operating conditions.
NACA 632-‐612
1. The first digit (6) represents the NACA family designation
2. Chordwise position of minimum pressure of thickness distribution 10 * x/c.
3. The subscript digit gives the range of the lift coefficient in tenths above and below the design lift coefficient. Favorable pressure gradients exist on both surfaces.
4. A hyphen.
5. One digit giving the design lift coefficients in tenths.
6. Two last digits describe the maximum thickness as a percentage of the chord.
There are also the 7-‐ and 8-‐digit series where each series were an attempt to maximize the region of laminar flow on the airfoil.15
3.2 National Renewable Energy Laboratory (NREL)16
NREL started the development on airfoils that were specially made for
horizontal-‐axis wind turbines in 1984. Since then NREL has come up with nine airfoil families that have been designed for different rotor sizes. The families consist of twenty-‐five airfoils with their designation starting at S801 and ending with S828. The designations represent the numerical order, which the airfoils were designed during 1984-‐1995. After this period there have been some modifications to the airfoils. Some of the airfoils have been improved after wind tunnel testing and other have undergone more comprehensive testing at the Technical University of Delft (TUDelft), in their low-‐turbulence wind tunnel.
All these airfoils, except the early blade-‐root airfoils (S804, S807, S808, S811), are designed to have a Cl, max which is relatively insensitive to roughness effects.17 This is accomplished by ensuring that the transition point from laminar to
turbulent flow is near the leading edge on the suction side of the airfoil, just prior to reaching Cl, max. At its clean condition, the airfoil achieves low drag through the extensive laminar flow. The tip-‐region airfoils have close to 50 % laminar flow on the suction surface and over 60% laminar flow on the pressure surface.
The pitching moment coefficient (Cm) is mostly proportional to Cl, max for the NREL airfoils. Therefore, the tip region airfoils with its low Cl, max exhibits lower Cm than other modern aft-‐cambered aircraft airfoils.
The NREL airfoils are also designed to have a soft-‐stall characteristic, which is a result from the progressive separation at the trailing edge. This helps the blade in turbulent wind conditions, by mitigating power and load fluctuation.
Other institutions have designed and developed airfoil families as well. Table 4 displays these institutions and their most popular airfoils.18
Table 4: Other wind turbine airfoil families
FFA – Sweden TU Delft RISØE (Denmark) NASA
FFA-‐W3-‐211 DU91-‐W2-‐250 A1-‐18 LS1-‐0413
FFA-‐W3-‐241 DU93-‐W-‐210 A1-‐21 LS1-‐0417
18
4. Methods
4.1 Historical Turbines
Analyzing historical turbines will present an introduction and validation of the Qblade software. Comparing the results to the real operational data, could determine how trustworthy and accurate the software is. The MOD-‐219 and the Gedser turbine were selected for this process due to having the most
specifications and references to give a valid comparison.
4.2 General Blade Design Criteria
The blade of a wind turbine is the most important part of the structure. If the blade has a poor aerodynamic design it will not be efficient. Therefore, it is very important that the blade exhibits good aerodynamic extraction of energy. But the best aerodynamic design is certainly not always the best solution for the wind turbine as a whole, since a turbine that exhibits good aerodynamic performance may not meet the structural limitations.
For a variable speed and variable pitch wind turbine, the blade geometry is designed to give the maximum power at a given TSR, while also a good off-‐
design. Good off-‐design provides a high performance over a greater TSR interval. The variables for the optimization are a fixed number of sectional airfoil profiles, chord lengths and twist angles along the blade span. The aerodynamic data is extracted from the respective airfoil database, which has experimental and computed lift and drag coefficients and other data for different Reynolds numbers.
There are three different approaches to the blade design for handling wind loads:20
- Withstanding the loads
- Shedding/managing the loads
- Managing loads mechanically/electrically
A design that is built to withstand the wind loads is the Paul la Cour turbine from 1890. This design is reliable, has a low TSR with three or more blades, high solidity but non-‐optimum blade pitch. Design built after the shedding/managing of the loads principle is optimized for performance, optimum blade pitch, high TSR and a low solidity. The third design principle has innovative mechanical or electrical systems to protect the turbine. It is optimized for control, either two-‐ or three-‐bladed and has a medium TSR.
IEC is a worldwide organization for standardization, and offshore wind turbines have to follow certain wind turbine design requirements given in IEC 61400-‐3.21 The turbines have to withstand several of different extreme design load cases for wind and wave conditions. For wind regime the load and safety considerations are divided into two groups: the normal wind conditions which will occur more
frequently than once per year during normal operation and the extreme wind conditions which are defined as a 1-‐year or 50-‐year reoccurrence period.
The wind turbine rotor is designed to work through a wind speed envelope and to have a maximum power output at a desired wind speed, usually in the high region of that speed envelope. The cut-‐in speed is the beginning of the envelope and the desired wind speed is the rated wind speed. The turbine also has a cutout wind speed, which is the maximum wind speed allowed when the turbine is operational (Figure 5). The turbine also has to withstand increasing wind speed while the rotor is not rotating.
Figure 5: Power curve versus wind speed (m/s)
4.2.1 Blade Performance Criteria
The major focus in this project has been on the middle and outer sections of the rotor blade. The turbine is a HAWT design with three blades upstream of the tower. The rotor diameter is given with a length of 165 m powering a 7.0 MW turbine. The turbine is a variable pitch and variable speed design, so it can operate efficiently through a wind speed envelope. The inner section airfoil is predetermined to consist of FFA-‐W3-‐XX1.
Since this is an offshore wind turbine, the blade design has to have very low maintenance requirements, resulting in 220 000 hours or 25 years of operating time between maintenance.22 Therefore, the selected airfoils for the blade need to be insensitive to leading edge and upper surface build-‐ups. This build-‐up is particles in the air, ice, salt crystals and bugs.23
The blade should also have an airfoil that has a benign post-‐stall behavior to reduce the dynamic loading on the support structure during wind gusts. Therefore, it is reasonable to look at post-‐stall behavior for different airfoils, where this is possible.
20
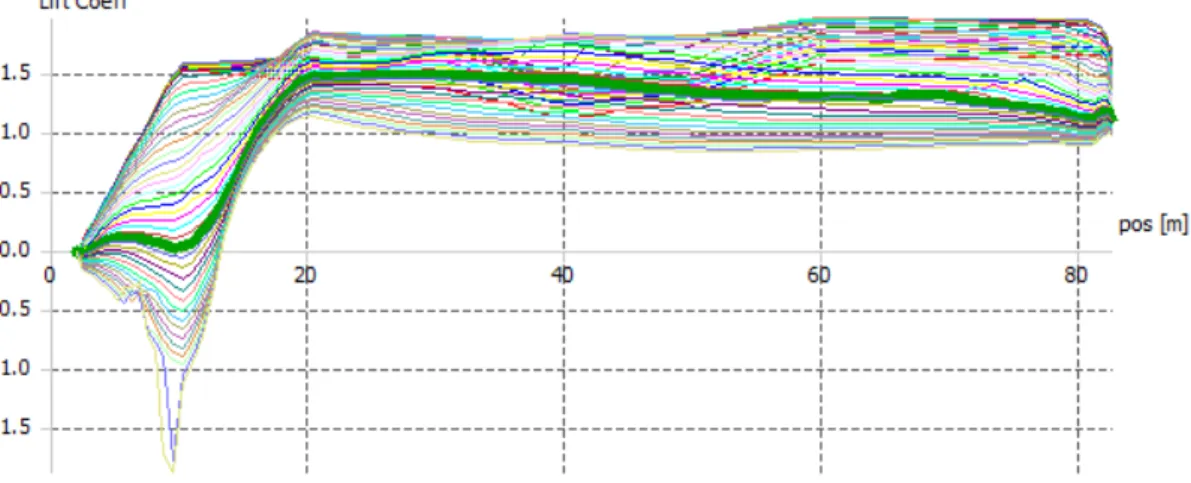
Since the blade structure is designed with the blade loading capabilities in mind, the aerodynamic blade loading should be somewhat linear locally along the span. Random Cl peaks along the span of the blade would create stress loading along the blade. A comparison of various airfoil types in a Cl – α diagram should reveal which airfoils have similar Cl at given angles of attacks. Twisting the blade can help generate a loading that is somewhat linear along the span. The downside is higher production cost when twisting the blade. Therefore, similar airfoils should be used over a certain length of the span, with minor amount of local twisting, so that design CL for the whole blade can be obtained through the entire pitching envelope.24
The zero-‐lift pitching-‐moment coefficient for the selected airfoils should be in a reasonably negative range but not too low, since it would give the blade higher stress to withstand. Using an airfoil with an increased leading edge camber would decrease the pitching moment coefficient. The pitching moment coefficient is however neglected in this project.
For onshore wind turbines, the noise levels from the blade should be low. Since this blade is for an offshore wind turbine, the noise levels are not taken into account. A higher tip speed will increase noise levels.
There are also major limitations when designing a rotor blade. The forces acting on the blade can not be larger than the structural limitations. The bending of the blade is limited to the distance to the tower. If the blades were designed for aerodynamic efficiency, which means thinner profiles towards the tip, the consequence would be increased bending, increased weight and higher
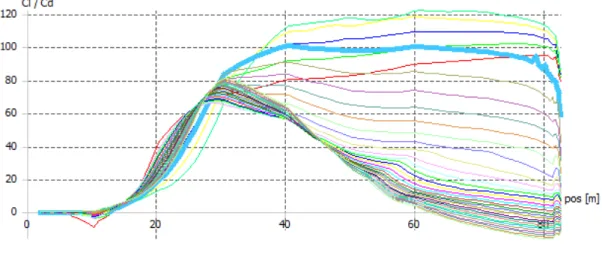
production cost. Using thicker airfoils towards the tip can reduce these factors, but also reduced aerodynamic efficiency. Airfoils with the best Cl/Cd are used for the middle and outer section of the rotor to get the highest efficiency within the limitations. Airfoils with high Cl max are used for the inner section, since the drag penalty is negligible in that area.
4.2.2 Inner Root Section Criteria
The inner section of the rotor blade is the part that takes up all the forces put upon the entire blade length and therefore has to be designed to withstand these forces. A large blade results in a very thick root section (≈ 0.4 t/c), which is not positive aerodynamically, but the thickness also stiffens the blade, resulting in blade deflection. The inner section has a low tangential speed, since it is near the hub and with a variable incoming wind speed, the relative wind component would have a wide angle of attack. This variation of angle of attack and a thick airfoil is a compromise because of the design criteria to withstand the blade loads. Because of this design compromise together with the low tangential speed,25 the inner section of the blade develops a minor part of the total bending moment for the blade. In this section the lift-‐drag ratio is of less importance, but the Cl, max should be high in order to reduce the blade area.26
4.2.3 Middle Section Criteria
The middle section has to withstand the forces put upon itself and forces from the outer section. This section would consist of a decreasing thickness to cord ratio towards the outer section. At high tangential speed, the angle of attack for the relative wind component changes less than for the inner section. Normal t/c is between 18 and 30 %.
4.2.4 Outer Section Criteria
The most torque generated on a wind turbine is at the outer section. With a very high tangential speed (80 – 90 m/s) at the tip, the wind speed has little effect on the angle of which the relative wind speed is attacking the blade. Since this section only needs to take up its own forces, which results in a thinner structure, a good aerodynamic design can be achieved. The outer section is optimized with L/D at maximum. t/c should be somewhere between 8 and 18 %.
4.2.5 Blade Section Calculation
The entire blade is divided into 18 sections which gives around 5 m spacing between them throughout the blade. Each station was analyzed before selecting suitable airfoils for further testing. Known parameters at each station is the tangential and the incoming free stream wind speed, so the relative velocity of the blade can be calculated through Pythagoras equation and thus
𝛼 = arctan 𝑉 𝑊
(1)
can be calculated. α is angle of attack in degrees, V is the free stream wind speed and W the relative velocity for the blade at the applicable radius section.
Reynolds number can be approximated, giving an estimate of the blade chord at each section. 𝑅𝑒 = 𝜌 𝑊 𝑐 𝜇 (2)
Re is dimensionless, ρ is the density of the air, c is the chord and μ is the dynamic
viscosity of the air.
With the known variables above and an estimate of the chord length at each section, a number of airfoils can be analyzed for performance. With Cl max and at
which α it occurs for airfoils, a twist for each section can be selected. Further on, a study of the selected airfoil has to be made to check if this is the best solution for the blade.
22
4.2.6 Specific Blade Design
In this project, an offshore wind turbine blade was to be designed in open source software and verified in professional wind turbine software. With a diameter of 165 meter the blade design has to deliver 7.0 MW. Since the size of this turbine is somewhat similar to other commercial wind turbines, it was reasonable to use some of these operational data, given in Table 5.
Example of commercial wind turbine operational data
Power regulation Pitch regulated with variable speed
Operational data
Rated power 7.0 MW Cut-‐in, cut-‐out wind speed 4 m/s – 25 m/s Operational rotational speed 4.8 – 12.1 rpm Nominal rotational speed 10.5 rpm
Design parameters
Wind Class IEC S Annual avg. wind speed 11 m/s
Weibull shape parameter, k 2.2 Weibull scale parameter 12.4 m/s
Turbulence intensity IEC B Max inflow angle (vertical) 0 degrees
Rotor
Rotor diameter 164 m Blade length 80 m Max chord 5.4 m
Table 5: Example of turbine specification
Figure 6: Vestas v164 power curve
Using these specifications, a reasonable comparison could be made of the power curve (Figure 6) of professionally designed wind turbines. There is no
information of airfoil, chord and twist distribution available.
4.2.7 Blade Design Procedure
The whole blade design procedure was done through computer software, but essential initial values for the procedure were calculated using an excel spreadsheet.
The following procedure shows a simple theoretical aspect when designing and optimizing a rotor blade.
• With the given parameters and design criteria, the power coefficient can be extracted from the following equation:
𝑃 = 𝐶!𝜂1
2𝜌𝜋𝑅!𝑉!
(3)
P is the power output, Cp is the power coefficient, η is the electrical and
mechanical efficiencies where 0.9 is a reasonable number, ρ is the density,
24
Solving for CP, the whole rotor has to have a power coefficient of 0.304
with a wind speed of 12.5 m/s or 0.446 at a wind speed of 11 m/s, if it is to produce 7.0 MW.
• A blade tip speed ratio (TSR) and the number of blades have to be selected.
• Airfoils have to be selected for their respective radial blade section for their respective performance and geometry so that the overall
performance requirements can be attained.
• The first step is to choose an initial chord distribution for the blade. The following equation is very susceptible to large chord lengths and is normally only used on middle and outer section for large turbines. - 𝐶!"# = !!" ! ! !!! !!"#$%& !!! (4) •
• COpt – optimum chord length (initial)
• vdesign – design wind speed
• vr – local effective velocity
• λ – local tip speed ratio
• Cl – local design lift coefficient
• r – local blade length • B – number of blades
• The solution for the flow around the blade is optimized employing the blade element momentum theory.
This procedure is only a simple road map on how to develop a blade. The full design of a rotor blade, including the twist and chord distribution has to go through an iterative process that is very time-‐consuming.
The design of rotor blades is in this project was mainly developed with the freeware software Qblade and verified in the professional software Flex5.
4.3 Airfoil Catalogue and Roughness Insensitivity Analysis
The airfoils under consideration for a wind turbine were the NACA 63-‐XXX, 64-‐ XXX, DU and FFA profiles, as these are available on the Internet and in published airfoil catalogues.27 The airfoil catalogue therefore consists of almost 40 different airfoils. Some of them are tailored for use on wind turbines,28 while other were designed for aircraft.
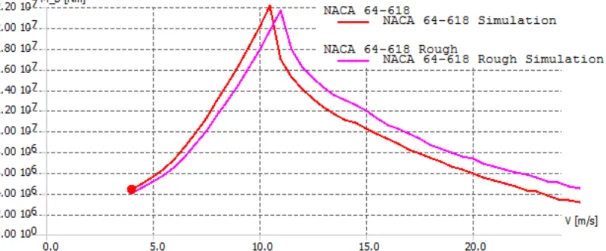
The roughness insensitivity analysis is performed at two Reynolds numbers and forced transition at 2 % of the chord. The first Reynolds number at 4 millions
indicates a thin boundary layer while at 500 000 Reynolds number indicates a thick turbulent boundary layer, the latter one simulating a rough surface and increased drag. The comparison between the two simulations was done at Cl, max. There is also a comparison of the roughness insensitivity when the airfoil has the best Cl/Cd. The difference in performance between the results in the first
simulation would be an indicator on how insensitive the airfoils are against surface roughness.
4.3.1 Airfoil Design for Wind Turbines With Roughness Insensitivity
The desired behavior of an airfoil for wind turbines differs from the expected behavior for airfoils designed for airplanes. As wind turbines are built to operate over an extensive period of time between maintenance, the airfoil selected should be insensitive to surface roughness. Therefore, the goal when selecting an airfoil for a wind turbine is to pick a design that gives a maximum lift coefficient that is relatively insensitive to leading-‐edge roughness.
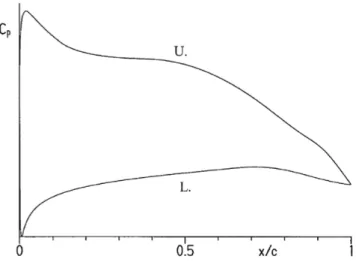
Figure 7 shows the drag polar that meets these design requirements.29 The figure shows the S902 airfoil design where point A is the lower limit of low drag, lift coefficient range, while B is the upper limit. Point C however, is outside the low-‐drag range and thus drag increases, because the boundary layer transition (laminar to turbulent flow) moves rapidly towards the leading edge with increasing (or decreasing) lift coefficient.
By this design, the profile produces a suction peak close to the leading edge at higher lift coefficients, ensuring that transition will occur at the leading edge. Therefore, point C in Figure 7 shows the maximum lift coefficient with turbulent flow along the whole upper surface. This design, at max lift coefficient, is
therefore relatively insensitive to surface roughness at the leading edge.
Figure 7: Cl/Cd for the S902 airfoil