Attraction to Violent Game Concepts
Felicia Boman
Degree Project in Game Design, 15 ECTS Credits
Game Design and Graphics, spring 2013
Supervisors: Iwona Hrynczenko, Göran O:son Waltå
Examiner: Masaki Hayashi
Abstract
This is a small scale research conducted by a Game Design student about attraction to a game concept of violent nature. A survey was executed and launched on social media such as Facebook to gain many participants in a short period of time. They were asked how attracted they were to the graphics of the concept and also if and how much money they would pay for a game like it. One of the most important parts of this research is that the participators are of a mixed group when it comes to age and gender, but also location, since these things tend to control our environment which in turn can shape a person and their morals.
The results are presented in simple graphs and discussed together with results from similar research regarding violent games and how they affect the players and in turn society. Despite the violent contents of the graphics used in the survey, the most popular rating indicates that many participants are attracted to it and that they would consider paying for such a game.
Table of Contents
Abstract ... 2
Table of Contents ... 3
1 Introduction ... 4
2 Background ... 5
2.1 The Present Report ... 5
2.2 Target Market and Game Types... 5
2.3 Violent Games and Ages ... 6
2.4 Product Example ... 6 2.5 Previous Research ... 6 2.6 Aim ... 7 3 Method ... 8 3.1 Instruments ... 8 4 Results ... 9 4.1 The Participants ... 9
4.2 Opinions about the Graphics ... 11
5 Discussion ... 14
5.1 Pricing - What to Pay?... 15
5.2 Morals and Values ... 15
6 Conclusion ... 17
6.1 Notes for Future Research ... 17
7 References ... 19
7.1 Image References ... 20
8 Appendixes ... 22
8.1 Appendix 1: The Online Survey ... 22
1 Introduction
Violence and computer games have a long history together and it is something up for debate since it is considered an issue in society. Extreme measures have been taken in several countries to prevent violent games affecting children or teenagers. These measures include completely banning some games or removing particular effects within the games that are sold in that country, such as blood splattering. Some studies show links between violence in games and the level of aggression that differs between people who play these games and not.
Conversely, others claim that games with violence do not affect society more than pictures of snakes do.
This constant debate regarding violent graphics served as motivation to convey a small scale research about violence in computer game graphics. The present report documents the online survey made, which asks a group of people how attracted they are to the graphics shown. The graphics were of a violent nature and the results indicate that many were attracted to the graphics, though the majority said they would not want to pay for a game with such graphics.
2 Background
2.1 The Present Report
This report will document the progress of a small survey regarding target audience group for a specific game concept called “Epoch”. The concept of Epoch is a zombie apocalypse survivor game which allows the player to take the role of a survivor trying to put the world back to order by killing zombies and accepting the challenge of finding a cure. The environment of the game is a city with sky rise buildings which is broken and abandoned by the looks of it, with vegetation on its way to take a grasp of the unattended grounds.
A survey will be conducted on social media in the form of five questions concerning the participant's age, gender, nationality but also the graphics of the concept, Epoch. The focus of the survey is primarily to see to what extent a wide age range and mixed genders are attracted to the graphics of this game and if the result is expected or not. When marketing a product like a computer game with a small budget, the way the money is spent on marketing may end up being crucial for the success of the game.
The project Epoch is not a launched game and it will not be in the future either, but this is a university school project designed by students. In this report its concept is used for the purpose of the survey and will serve as a tool to research attraction to violent game graphics.
2.2 Target Market and Game Types
When considering the marketing of a computer game, there are several important issues to consider. A few things to start with are mentioned at the website of Entrepreneur (2010) where they express opinions about how you need to narrow down your target group and really get to know them since being too general in the hope of attracting more customers can lead to less profit.
For example, the questions to start with could be: What ages are they? Where do they live? What do they do for a living? These socio-demographic questions may prove extremely important when marketing a game since they define the customers and make them more unique than before. The age question appears to be the most powerful here, since age defines the stage of life a person is in and often what they have time for and an interest in.
Consequently the result for how many active gamers that can be found in different age groups will vary with the younger groups being larger almost always when speaking of computer games.
On the website Gamasutra (2013) many articles regarding this can be found, and a thorough survey was made in USA in 2006 which clearly shows how middle aged people are the ones to invest the most time into games. Besides this it is worth noticing that younger and older age groups are not insignificant and if given the right kind of game could become rather crucial as a marketing target.
According to Jenkins (2006) people aged from 18-49 represent almost half the gamers while 31 per cent are below eighteen years of age. Moreover another interesting fact from this article is that women represent 38 per cent of all gamers that participated in the survey.
Regarding the age group for Epoch, these kind of first-person shooters (Dictionary 2013) directed towards survival of the fittest may be suited for a younger audience even though other popular games of this type seem to attract an older audience as well.
2.3 Violent Games and Ages
There are numerous studies that research the possible relationship between simulated violence in games and aggression with the player (Williams & Clippinger, 2002). When children have been examined, some are affected in other ways than with aggression, like with how they become less pro-social or perceived lower self-esteem.
Violence in games is a frequently discussed subject and according to Rasmussen (2010) it increases the violence in society. The on-going debate about it tells us that it is a real issue whether violence in games does affect crimes or not. Opinions are mixed as in any other important debate, but some say that many topics will generate more violence in society, for example pictures of snakes (Wagner, 2013). This becomes relevant in the present study since the concept of the game consists of violence and bloody scenes involving zombies which might be repellent to some audiences.
Violent games might not increase violence in society directly, but through their relationship with sensation-seeking, aggressiveness and risk-taking, they can affect adolescents to be more violent in the future (Slater, Henry, Swaim & Anderson, 2003). However, the link between violent games and aggression is not the only reason for adolescence becoming aggressive, and nor the most prominent one. Alcohol-using peers are still considered much larger and more predictable to have an impact on the development of aggression and violence.
2.4 Product Example
There are several good examples of extremely violent games and accessories on the market today, and one is the sculpture in illustration one which is available for purchase with the game Dead Island (2013). The game itself is a video game available to several consoles, but this sculpture is something fans can purchase in addition to the game. As seen in the picture, this is a torso of a woman's body that is decapitated and filled with cuts and blood, which purpose is for people to enjoy looking at.
2.5 Previous Research
Violence in computer games has often raised the suspicions of parent, teachers and scientists about the danger they have for children (Bleumke, Friedrich & Zumbach, 2010). Many studies point towards their negative effect in both long and short term periods of time. Computer games with their increasingly realistic graphics which enables the players to enact the violence rather than just watching it.
Movies and TV violence lead the debate before computer games were invented and consumed on such a large scale as it is today. The research made on the link between aggression and violent computer games is relatively small compared to the link between major exposures to violent media, which show almost no positive effects.
The study of Bleumke, Friedrich and Zumbach tests how first-person shooters affect the players when the violence is swapped for non-violent actions with the same sort of game play. The simulation that they used let the players was based on typical mechanics where the player uses the computer mouse to click and shoot targets that appear in the landscape in view. When the test went further the concept of shooting was replaced by watering flowers which took the role as targets. The findings of Bleumke, Friedrich and Zumbach showed signs in all
participants of increased aggressive self-concept when playing violent games.
The judgement and attitude towards violent games change depending on our previous
experiences. For example, people who have previously role-played a role of a violent criminal may show less signs of punitive attitudes towards real life crimes of similar nature (Lee, Peng & Klein, 2010). In comparison, people who have not role-played a violent criminal were indifferent in their judgement between a simulated event and a real life situation regarding violent crime. These results indicate that the negative effects from playing violent games are only significant when the role of judgement matches the simulated event to the real kind.
2.6 Aim
In this minor scaled research the effect of the violent graphics is not primarily tested, but how the participants value the painting itself when first viewing it. Since the picture is very violent, it will most likely be brought to everyone's attention and reflected upon the participants rating. Pricing is also in focus here, as a way to confirm the effectiveness of the graphics and its possible use for commercial games.
The main purpose is to study: How a mixed group of people rate a game concept containing
violence and blood according to their attraction level.
As the present study includes a mixed age group, the results may show some indication to the acceptance in society really is towards violent games and if a big percentage of the
participants like the concept and how much they would be willing to pay for it. The result could show how much interest the mixed group of people have for a violent game concept and if they are willing to pay any amount of money.
3 Method
The survey that this report is based on was executed by asking five simple questions to people in several different social media. First age, gender and location was asked of the participants and then two questions about the actual graphical style for the project “Epoch”. The survey is posted on social media online sites such as “Facebook” and “DeviantArt” which are social and art communities. The reason for using these communities to reach out to people with the survey is to reach as many recipients as possible within a small period of time.
Besides the obvious advantages of attracting participants through these social media, it will still bring some downsides. For example how the participants could be biased in their opinions about the art since they want to be nice or too helpful and they are not analysing it critically. Furthermore, most participants will likely be younger since a greater percentage of the people connected to the user account are a younger age in both of social media used. The participants are of a mixed age and from different countries, but since the survey was posted in Sweden most will probably be from the same area.
When creating the questions, it is important to consider all options that the participants wish to choose, and that if the options available create uncertainty when participating it will not render accurate data about the participant’s opinions. This is essential in all questions, but in this survey it may be most crucial in the gender and the price question because money and genders usually have a particular place in people’s morals and emotions. It is important to make the participant feel at ease with the options making them more willing to contribute with their time and answers.
3.1 Instruments
The questions in appendix one were those used in the survey. A free online software was used to launch the survey which also presents the gathered data in several diagrams (KwikSurveys, 2013). The participants were allowed to choose one option only except for the last question which allowed the participants to choose multiple answers since the amount they would pay for a game like Epoch might be wide spread. The first questions were straight forward about gender, age and their current residence. These are important for analysing of the results so an understanding of whose opinions are being evaluated in this case study. Once these answers are gathered the information will define the group that the opinions in the following questions are extracted from.
Moreover, the fundamental questions in this research are the final two, which tests the
participant’s opinions about the graphics but also how much they would pay for a game like it. The rating of the graphics may appear as the core question here; however, the follow up
question regarding spending money will put pressure on the participants and create a more real circumstance forcing them to consider their actual level of attraction to the graphics. When the survey is set up and finalized it is ready to be launched and posted on the social media described earlier. During the two weeks that the survey is open for response, the link to it will be reposted in the social media after one week to remind people or to catch more people's attention.
4 Results
In two weeks 83 people answered the survey and rated the graphics for Epoch according to how attracted they were to it, and also how much they would pay for the game if it was launched. These last questions on the survey are the most important ones and they can be analysed to give a clue to how the participants apprehend the graphics. However, the first three are the building-bricks for the purpose of the present research because they place the opinions gives in a person which makes it more interesting.
4.1 The Participants
When two weeks and 83 people had answered the survey online, it was closed and ready to be analysed. The first question asked the participants for their gender, and with no destined plan to attract an evenly divided group despite it being desirable, the result was a pleasant surprise. Since women are under-represented in games in general, having such a large percentage
women answer this survey allows for an interesting analysis. As seen in illustration one above, 34 (n = 42%) were women and 47 (n = 58%) were men. The third answer was available for possible participants who do not place themselves fully in either of the two gender roles, though no one chose that option. Out of the 83 participants, two did not pick an option on this question.
The next question, which concerns the participants age is perhaps more important than the first question, but also more different regarding the results. The majority who answered the survey were in their twenties, which may direct the result towards their opinions.
Illustration three shows us how the participants are of a wide spread age range; however, the age group going from 20-29 are dominating the data. The result is less than desirable in this case, nevertheless, the fact that almost all age groups are represented except for three (the two youngest and the oldest) is considered a success. It is also interesting to note that the age group of 50-59 stands out with nine answers.
The third question might be the least necessary, nonetheless still useful. It asks the
participants where they currently live, divided into large regions. Since it was expected that most were from Europe, it was divided into four large regions which are commonly used around the world (Wikipedia 2013).
The fact that Northern Europe is represented in this magnified way is simply due to how the survey was launched. The audience on the social media where it was posted mainly have links to people in that area, and it would not have been exposed to many people outside that area. Additional information linked to this question was given by the software used to launch the survey, since it had a built in tracker of the participant’s location and where they found the link.
Illustration 3: Survey question: Age
In the map of illustration five, the countries with a darker shade of grey show the location of all participants while the coloured circle shows what websites they found the survey through. In the circle it is apparent that Facebook is the primary source for the answers received. The blue part of the circle represents Facebook, but also the green one since it is a secondary link on the site leading to the survey. It means that people have shared the link originally posted and from then on leading more people the survey site.
The big surprise here is how much space the red block has in the survey, which is slightly confusing. It is uncertain how this works, since nothing was posted on Kwiksurvey's website knowingly, but using the software, the link will be available to anyone who clicks it. If it was somehow seen by other people using this website they could have contributed with their answers. Another possibility is that people were directed to the Kwiksurvey site and then directed towards the survey, meaning that even if they originally clicked the link to the survey on Facebook, they would not count as such by the software.
4.2 Opinions about the Graphics
From then on in the survey, the following questions were only based on the participant’s opinions about the graphics unlike the previous ones which gathered simple data about the participant. The fourth question in the survey asks them to rate illustration five on a scale from one to ten of how attracted they are to the graphics displayed.
Illustration five represents the foundation of this whole research, since its’ contents is the subject for the participants judgement and criticism, which in turn is what generates the answers and the result of the survey. The image contains features undoubtedly saturated with violence, such as the blood splattered along the edges, the shattered town and the gun. It becomes obvious when examining the graphics that this game is influenced by violence in a significant way, and the rough looking people in the illustration assures a game-play
containing some sort of struggle for survival.
When studying illustration seven it becomes obvious that the majority of the participants thought that the rating of eight was most fitting for their attraction to the graphics. Except for this major bump in the graph the rest seems to vary and have no clear direction. Worth noting here is that only 78 people out of the 83 participants answered this question, meaning that some participants concluded into the first questions are missing in this data.
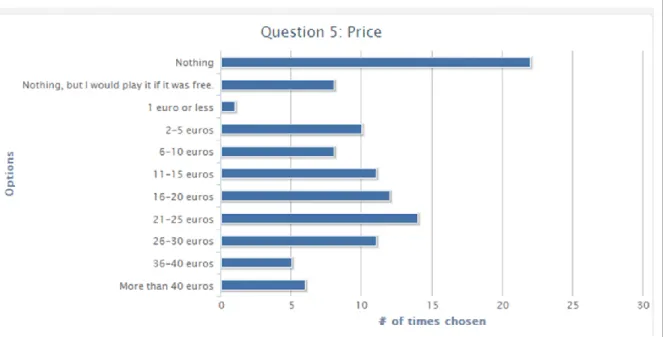
Perhaps the most vital question of them all is the last one. It asks the participants how much they would be willing to pay for a game with these kinds of graphics, and this is more crucial than the previous question since games have a hard time to make profit if there are no
consumers.
Illustration 6: Image of the graphics used in the survey
In the graph shown in illustration eight, the first option is in a clear majority, and it means that most participants do not desire to spend money on a game with these kinds of graphics. Besides this, the rest of the answers seem fairly diverse and only one of the answers is lacking in picks. Only one person picked the option “1 Euro or less” meaning that only one person chose to conclude that into their answers on this question. Since this question allowed the participants to choose multiple answers, the data will represent all of these answers and not just one answer per person. Of course, the fact that somebody did not choose anything and the opposite must be considered.
5 Discussion
When studying the results, it becomes apparent that all the opinions combined from the participants show a clear direction to what the majority thought in the two last questions. The findings of this study suggest that the attraction to the graphics used is quite high, despite its violent nature. There is a possible relation between the biggest age group of participants and the high rating on the fourth question of the survey. If younger age groups have a higher level of acceptance for violent media the result of this study could look radically different in case only people of older age groups were asked these questions.
As the age group in majority is 20-29 years an assumption can be made that this group also stands for the majority of the influence on the other questions as well. However, since this is not known in this study, this topic will be avoided.
What can be discussed however is how the genders play a role in the rating of the graphics and what they could have been most attracted to. Females are less known for playing violent games than men, even though it occurs, detailed studies of these females and their relation to aggression remains less clear. It seems that when asking females about games and how often they play, it matches men in many cases, but they spend significantly less time on violent games (Sigurdsson, Gudjonsson, Bragasson, Kristjansdottir & Sigfusdottir, 2006). The attitudes towards violence in media are affected with experiences and in turn the reason to a person's opinion and morals about it.
The major flaws in this research is primarily its size, since opinions put together vary a lot unless they appear in masses, they then tend to mould together to some degree. The results here appear to show a general direction of opinions, but since the participants were not evenly divided into the age groups it remains uncertain if this remains true in case each age group claimed the same percentage. This is also relevant when looking at the locations for the participants. Even though obtaining responses from nine countries is a pleasing number for this minor survey that reached out with unconventional methods, it is still not enough to properly represent a diverse group of people.
A secondary and minor issue with this study is how the level of the graphics used may affect the result in a negative way. Some people may compare it to graphics made by professionals in the gaming industry, which is far from the graphics used in this survey, and it may therefore be valued less for the participant. Those with high experience of games and graphics made by talented and experienced artists may be jaded in how they rate the graphics in case it has less impact that what they are used to.
On the contrary, the strengths of this research would include the simplicity of rating graphics of a specific genre this way, allowing the participants to give their opinion in a collected and easy way, which is appropriate with the purpose of this research. This becomes very true when considering the short period of time available and also the limitations of attracting participants. The graph in illustration seven shows the flow of ratings, how more and more people valued it to an eight, before diving back down to similar amounts of the lower scores. The irregularities in the lower scores may indicate how participants that do not respond well to violent graphics, still enjoy some part of the picture which does not involve any violent features.
5.1 Pricing - What to Pay?
Since computer games is a fairly new invention that has barely seen a short phase of two centuries is still not a common feature of every person's life and may in fact seem very alien to a lot of people around the world. Even though games have, with today's technique, been made easy to access and available for all generations via smart-phones and similar devices, they are still frowned upon due to old prejudice. In some cases, the quick mini-games that surround the modern human today may be hard to avoid at some point, and they will be tried out by many new possible consumers.
Even though this sheds some positive light on the game design business, games may yet be dismissed as an annoyance due to how they are advertised in abundance. The fact that this new genre of creative designing allows for many young students to create a new future and work hard to earn money, is sometimes overlooked by older generations anyway. All this ignorance because they are not willing to pay one Euro or less for a game that somebody worked hard for weeks at, because they can play it to a certain extent for free. What is needed here is a larger study of the reasons someone would or would not pay a very small amount of money for a game.
Considering this study, the rating for the graphics was considered high, since the majority picked eight out of ten as their rating. Therefore, the fact that how much people would be willing to pay for such a game, did not match their rating of the graphics. Money is linked to complex feelings which are often based on our experiences and morals. When being asked to pay money for something, we all think differently depending on the situation, the price and the item for sale. This could affect the participants answers when being asked to pay for something; emotions and morals stir and the situation make us consider the question more seriously compared to when being asked to anonymously rate a picture. The link between money and our emotions breaks the link between the high rating of the picture and the pricing question.
Despite the fact that a major part of the participants would not consider paying anything for a game like this, the amount of answers on the other options reveal that there is an interest for this game within the groups asked. If this still is the case with more people in a larger survey, this game could be suited to be marketed as a computer game which could be played online and/or offline. This type of game allows for a small starting fee with optional further payment rewarding for the player within game world.
5.2 Morals and Values
It is obvious that violent games sell and plenty of consumers are buying games of popular genres such as first-person shooters. The question is whether it is right morally to continue to allow children who are easily affected negatively by the abundant violence. Even though more research is needed in this field, plenty can be learned from the numerous studies regarding violence in other media such as TV and movies (Bleumke et al. 2010). If violence in games affects people in a similar way, precautions should be taken to ensure society remains as unaffected as possible.
If the level of our judgement is affected by our use of games and interaction, their link to violence in society should be considered before selling it to consumers but also how to treat those who are affected (Lee, Peng & Klein, 2010). When judgement and attitude is dampened by our usage of violent computer games, it may also dampen the reaction to similar events in real life, causing less support for crime resistance. What separates games from other media is that in all other cases the consumers have been referred to as “audience” and similar words because they are only, for example, watching motion pictures. Games force the audience to interact and take part of the violence and sometimes make the moral decisions of whether to commit a crime or not themselves. In books or movies, the decision is almost always made for the reader/viewer.
More research of this subject should focus on the difference between watching fictional violence and taking part in making it to ensure the effects on players of violent games.
6 Conclusion
In conclusion, the results indicate that several of the participants were attracted to the graphics despite the violence included. The majority of the participants chose the rating of eight, which is considered a high value on the scale of one to ten. Since ten on the rating scale means “very attracted”, an assumption that the graphics were enjoyed by the participants is valid when eight, being so close to ten, is the most popular answer.
In addition to this, it is surprising that the third option on the fifth question on the survey only got chosen once. This question concerned paying for a game with similar graphics, and the option was “one Euro or less” meaning that whomever chose that option would consider paying one Euro or less for such a game. The reason this is peculiar is because the options close to this one, for example paying nothing at all or paying a higher price was chosen in abundance, meaning that this option was almost unnecessary.
Finally, another interesting fact about this research is that a study like this is possible to conduct via social media such as Facebook, and it may even be a valuable source for
attracting varied responses from many age groups at once. Even though the age groups in this study differenced greatly in size, almost all age groups were represented and if a larger study was to be distributed over a longer period of time and in a greater scale, it could be more successful in attracting participants.
6.1 Notes for Future Research
To validate this research even more, a more diverse set of graphics could have been used, preferably from similar games to Epoch. This might have generated a more clear result since many aspects when considering your attraction to the present graphics were present. Since violence was the main feature to be tested here, all images in the graphics used should have contained something of a violent nature. If the concept of Epoch was the only one to be tested (possibly for its future benefit in marketing) more elaborate graphics from the actual game play could have been used to show a sample of the game in whole.
The biggest issue with this research was that each participant was untraceable through the answers of the survey. It was not possible to make out the individuals among the questions, meaning that they could not be linked together as for example: A 30-34 years old woman who likes the graphics to a rating of seven. This flaw in the software (KwikSurveys, 2013) reduced the amount of analysing possible for the results, since it would have been interesting to isolate specific groups of gender and age and compare their ratings. If a bigger survey were to be conducted in the future this would be important to consider including in the survey to be able to analyse the results in more detail.
Furthermore, if the research was to be continued in a greater scale more questions should be included in the survey, which preferably allows for more detailed answers and in addition, more detailed results. The most given follow up question would be: What caused them to rate the graphics the way they did?
The participant’s opinions were somewhat muffled in the present research because they were not allowed to express their opinions in words about the graphics. If they were to answer such a question, the reasons they liked the graphics would reveal if the violence has anything to do with in, in either a negative or a positive way. In case this sort of question becomes the essence of the research, even more detailed questions could be asked such as: What did you think about the blood and violence in the graphics?
It is clear when looking at the result of the present research that the graphics were successful at attracting its audience, even though many would not pay money for this particular game. Perhaps an elaborate research focused on why people rate violent graphics as good would be most beneficial, rather than how good they do rate it.
7 References
Bluemke Matthias, Friedrich Monika & Zumbach Joerg (2010) 'The Influence of Violent and Nonviolent Computer Games on Implicit Measures of Aggressiveness', AGGRESSIVE
BEHAVIOR, 36, pp. 1-13.
Boman Felicia (May 2, 2013) Quick Survey About Graphics, Available at:
http://kwiksurveys.com/s.asp?sid=o9qm13r45cn05aw138931 (Accessed: 14/5 2013 12.17).
DeviantArt (2013) Available at: www.deviantart.com (Accessed: 17/5, 2013 13.50).
Dictionary (2013) Dictionary.com, Available at: http://dictionary.reference.com/browse/first-person+shooter (Accessed: 17/5, 2013, 10.38).
Entrepreneur (2013) Target Market, Available at:
http://www.entrepreneur.com/encyclopedia/target-market (Accessed: 4/5 2013 21.25).
Facebook (2013) Available at: https://www.facebook.com/ (Accessed: 17/5, 2013 13.48).
Graft Kris (December 3, 2009) NPD: 82% Of U.S. Children Are Gamers, As Older Teens
Game Less, Available at:
http://www.gamasutra.com/view/news/117307/NPD_82_Of_US_Children_Are_Gamers_As_ Older_Teens_Game_Less.php (Accessed: 4/5 2013 21.31).
Jenkins David (May 17, 2006) ESA Stats: Average U.S. Gamer 33 Years Old, Available at: http://www.gamasutra.com/view/news/100295/ESA_Stats_Average_US_Gamer_33_Years_O ld.php (Accessed: 4/5 2013 21.36 ).
Kris Graft (November 15, 2010) Survey: 54% Of U.S. Adults Believe Violent Games Cause
Violent Society, Available at:
http://www.gamasutra.com/view/news/122171/Survey_54_Of_US_Adults_Believe_Violent_ Games_Cause_Violent_Society.php (Accessed: 11/5 2013 23.55).
KwikSurveys (2013)
Available at: http://kwiksurveys.com/ (Accessed: 27/4 2013 10.13).
Lee Kwan Min, Peng Wei & Klein Julian (2010) 'Will the experience of playing a violent role in a video game influence people’s judgments of violent crimes?', Computers in Human
Behavior, 26, pp. 1019-1023.
Rasmussen (November 11, 2010) 54% Think Violent Video Games Lead to More Violence in
Society, Available at:
http://www.rasmussenreports.com/public_content/lifestyle/general_lifestyle/november_2010/5 4_think_violent_video_games_lead_to_more_violence_in_society (Accessed: 11/5 2013
00.05).
Sigurdsson Jon, Gudjonsson Gisli, Bragason Atli, Kristjansdottir Elsa, Sigfusdottir Inga (2006) 'The role of violent cognition in the relationship between personality and the involvement in violent films and computer games', Personality and Individual Differences, 41, pp. 381–392.
Slater Michael, Henry Kimberly, Swaim Randall & Anderson Lori (2003) 'Violent Media Content and Aggressiveness in Adolescents: A Downward Spiral Model', Communication Research, 30(6), pp. 713-736.
Techland (2012) Dead Island – Riptide, Available at:
http://deadisland.deepsilver.com/agegate.php (Accessed: 22/5, 2013).
Wagner Jayce (03/08/13) Violent video games make people violent. But so do pictures of
snakes. Available at:
http://gamasutra.com/blogs/JayceWagner/20130308/188166/Violent_video_games_make_peo ple_violent_But_so_do_pictures_of_snakes.php (Accessed: 11/5 2013 00.14).
Wikipedia (April 6, 2013) Template: Regions of the world, Available at:
http://en.wikipedia.org/wiki/Template:Regions_of_the_world (Accessed: 2/5 2013 15.14).
Williams RB & Clippinger CA (2002) 'Aggression, competition and computer games: computer and human opponents', Computers in Human Behavior, 18, pp. 496.
7.1 Image References
1. Illustration of product: Dead Island, 2013 – Techland
2. Data from the first question of the survey: Gender.
3. Data from the second question of the survey: Age.
5. Data of the participant’s location when answering the survey, a feature of Kwiksurvey's software.
6. Image used in the survey. Artist: Felicia Boman, 2013
7. Data from the fourth question of the survey: Rating.
8 Appendixes
8.1 Appendix 1: The Online Survey
1) What is your gender?
• Female
• Male
• Other
2) What is your age?
• Under 9 years • 10-14 years • 15-19 years • 20-24 years • 25-29 years • 30-34 years • 35-39 years • 40-49 years • 50-59 years • 60-69 years • 70-79 years • 80 years or older
3) What region do you currently live in?
• Africa • Asia • Australia • Central Europe • Northern Europe • Southeastern Europe • Western Europe • North America • South America • Other
4) Copy and paste the link below in a new tab/window of your browser and look at the image. Rate how attracted you are to the art style by scoring it from 1 to 10, where 1 is not so
attracted and 10 is very attracted.
https://dl.dropboxusercontent.com/u/19537484/zombies1.jpg
1 2 3 4 5 6 7 8 9 10
5) Look at the same picture as in the question above. How much is the most you would be willing to pay for a computer game that looks like the concept portrayed in the picture? You can choose multiple answers.
• Nothing
• Nothing, but I would play it if it was free. • 1 euro or less • 2-5 euros • 6-10 euros • 11-15 euros • 16-20 euros • 21-25 euros • 26-30 euros • 36-40 euros
8.2 Appendix 2: The Image Used in the Survey