The Vajont slide
Facing the complexity of nature
Bachelor thesis in Geology and GeotechnicsABDULRAHMAN AL SHAMAA
ALICE JOHNSSON
DANIEL WALLIN
MIA ENGMAN
Department of Architecture and Civil Engineering CHALMERS UNIVERSITY OF TECHNOLOGY Gothenburg, Sweden 2019
Bachelor thesis ACEX10-19-32
The Vajont slide
Facing the complexity of nature
ABDULRAHMAN AL SHAMAA ALICE JOHNSSON
DANIEL WALLIN MIA ENGMAN
Sammandrag
Skredet i Vajont var en katastrof som inträffade i oktober 1963. Skredet genererade en våg som översteg dammens höjd och förstörde byn Longarone vilket dödade drygt 2000 personer. Denna rapporten undersökte anledningarna till skredet och effekten av höjningen och sänkningen av vattennivån på glidytan av Vajont. Utöver detta undersöktes mekanismerna kopplade till skredet i Vajont utifrån tre olika fall; 1) Mekanisk glidning; 2) Hydromekanisk glidning; och 3) Termomekanisk glidning. Dessutom genomfördes en litteraturstudie gällande dagens moderna standarder inom fältet för geoteknik, mildringsåtgärder och tidigare varningssignaler.
Resultatet från fallet med hydromekanisk glidning gav de mest framträdande resultaten då detta fall inkluderade fler parametrar såsom effekten av införd friktionsvinkel, snabb sänkning av vattennivån, hydrostatiskt vattentryck, kohesion och införandet av en upplyftande kraft. Utöver detta genomfördes en litteraturstudie som behandlade användningen av moderna standarder inom fältet för geoteknik och resultatet renderade ingen konkret slutsats. Detta berodde på komplexiteten av platsen ifråga och alla aktörer som var inblandade. Dock genomfördes åtgärder för att minska skadan av ett potentiellt skred, men dessa åtgärder var inte av tillräcklig omfattning för att förhindra katastrofen. Dessa åtgärder skapades som en respons på ett antal olika varningssignaler såsom en ökad hastighet av förskjutningen på skredet, ett antal stenras samt en spricka med en längd på 2 km. Rapporten presenterar ett antal förslag på åtgärder som hade kunnat mildra konsekvenserna av skredet. Exempelvis föreslogs en dräneringstunnel samt ett förslag rörande en generell sänkning av hastigheten för uppdämningen av dammen.
Abstract
The Vajont slide was a disaster that took place in October 1963. The landslide generated a wave which overtopped the dam, destroyed the village of Longarone and killed approximately 2,000 people. Attempts were made to mitigate the potential landslide, but these were not sufficient to prevent the disaster from taking place. These mitigations were created as a response to several warning signs such as increased landslide velocity, numerous rockfalls and a crack with a length of 2 km.
This thesis investigated the origins of failure and the filling-drawdown effects for the Vajont slide. In addition, the failure mechanisms of the Vajont slide were analyzed for three different cases; 1) Mechanical sliding; 2) Hydromechanical sliding and 3) Thermomechanical sliding. Furthermore a literature review regarding the current modern standards within the field of geotechnics, mitigation measures and the past warning signs was performed. The results from the hydromechanical case yielded the most extensive results since it included numerous parameters such as the effect of friction angle, rapid drawdown, hydrostatic water pressure, cohesion and uplift force. Furthermore, the literature study on the use of modern standards within the field of geotechnics and its application of the Vajont slide rendered inconclusive results. This is due to the complexity of the site itself and the actors involved.
Furthermore, a line of action is proposed that includes suggestions on preventive measures that could have been used to mitigate the consequences of the disaster. For example a drainage tunnel is proposed along with a suggestion to reduce the velocity of water impoundment in the dam.
Key words: Vajont slide, origins of failure, filling-drawdown effects, factor of safety, slope stability, mechanical sliding, hydromechanical sliding, thermomechanical sliding, thermal softening.
Table of contents
Sammandrag ...I Abstract ... II Preface... VI Notations ... VII 1. Introduction ... 1 1.1 Background ... 11.1.1 Location and geological context ... 1
1.1.2 Line of events ... 3
1.2 Purpose ... 5
1.3 Limitations ... 6
2. Theory ... 7
2.1 Failure behaviour of a landslide ... 7
2.2 Factor of safety ... 8
2.3 Mohr-Coulomb ... 10
2.4 Kinematics ... 11
2.4.1 Simple mechanical sliding ... 11
2.5 Impact of water ... 12
2.6 Filling-drawdown effects ... 13
2.6.1 Rapid drawdown ... 13
2.6.2 Increasing the water level ... 13
2.7 Thermomechanical aspects ... 14
2.7.1 Basic thermomechanics ... 14
2.7.2 Thermal softening ... 15
2.8 Modern standards ... 16
2.8.1 Ground-based monitoring techniques ... 16
2.8.2 Geophysical and geotechnical Methods... 16
2.9 Warning signs ... 17
2.9.1 Indications of concern pre-finalisation of the Vajont Dam ... 17
2.9.2 Indications of concern post-finalisation of the Vajont Dam ... 18
2.10 Mitigations ... 19
2.10.1 Drawdown ... 19
2.10.2 Bypass tunnel ... 19
3. Method ... 20
3.1.1 Input parameters... 20
3.1.2 Assumptions and applications... 20
3.1.3 Geometry of Vajont ... 21
3.1.4 Geometry and considered forces ... 21
3.1.5 Performed calculations... 22
3.2 Case 2 - Hydromechanical sliding ... 23
3.2.1 Input parameters... 23
3.2.2 Assumptions and applications... 24
3.2.3 Geometry of Vajont ... 24
3.2.4 Geometry and considered forces ... 25
3.2.5 Performed calculations... 26
3.3 Case 3 - Thermomechanical sliding ... 27
3.3.1 Input parameters... 27
3.3.2 Assumptions and applications... 28
3.3.3 Geometry and considered forces ... 28
3.3.4 Performed calculations... 29
4. Results ... 31
4.1 Case 1 - Mechanical sliding ... 31
4.2 Case 2 - Hydromechanical sliding ... 33
4.2.1 Study of the equilibrium forces... 34
4.2.2 Fast drawdown ... 36
4.2.3 Velocity vs. displacement of the landslide ... 37
4.3 Case 3 - Thermomechanical sliding ... 40
5. Discussion ... 43
5.1 Case comparison ... 43
5.1.1 Factor of safety ... 43
5.1.2 Velocity vs. displacement ... 44
5.2 Suitability and further studies ... 45
5.3 Mitigations and modern standards ... 45
Preface
This Bachelor thesis was composed by four students at Chalmers University of Technology at the Department of Architecture and Civil Engineering. The project began in January 2019 and was completed in May 2019. During the entire time of the project Prof. Eleni Gerolymatou supervised the working process.
We would like to give special thanks to:
Carina Sjöberg Hawke, Fackspråk och kommunikation
Eleni Gerolymatou, Department of Architecture and Civil Engineering
Liza Nordfeldt, Bibliotekarie vid informationskompetens för lärande och forskning Minna Karstunen, Department of Architecture and Civil Engineering
Gothenburg May 2019 Abdulrahman Al Shamaa Alice Johnsson
Daniel Wallin Mia Engman
Notations
Roman letters
𝑎 Acceleration
𝑐 Cohesion
𝐷 Driving force
𝑒 Thickness of shear band ℎ𝑤 Height of water level
𝑖 Hydraulic gradient
𝐿 Length of different sections 𝑀 Frictional thermal parameter
𝑁 Frictional rate-sensitivity parameter 𝑃 Hydrostatic water pressure
𝑞 Flow rate of water
𝑄 Water force 𝑅 Resisting force 𝑆 Degree of saturation 𝛥𝑆 Degree of displacement 𝑡 Time 𝑢 Pore-water pressure 𝑈 Uplift force 𝑉 Velocity
𝑉𝑣 Total volume of voids 𝑉𝑤 Total volume of water
𝑊 Weight of rock mass
𝑤̇ Rate of work input per unit volume of band material
𝑋 Frictional force
Greek letters
𝛽 Slope inclination
𝜀 Inclination of rock mass 𝜇 Friction coefficient
𝜌 Density of water
𝜏 Shear strength
𝜎 Total stress
𝜎′ Effective normal stress 𝜑 Angle of internal friction 𝛾 Shear strain rate
1. Introduction
The Vajont slide is an example of a landslide of an enormous magnitude where the consequences of the disaster were both severe and prolonged and the lives of approximately 2000 people were lost (Petley, 2008). The construction of the Vajont dam and the filling of the reservoir contributed to this tragedy. Despite investigations and warning signs, the risks that were attached to the landslide were to some extent overlooked due to conflicting interests. This case is still relevant today due to landslides being a contemporary issue. The problem of landslides, in general, is linked to the complexity of the number of stakeholders involved. For example economical, political, social and ethical interests interplay with different aims and visions for the project. This report will address the circumstances of the landslide including the warning signs, mitigations, modern standards and the mechanics involved. To better understand the circumstances of the landslide the report will include theory supporting the mechanisms.
1.1 Background
In 1939, at the commencement of the Second World War, Italy’s GDP had dropped significantly (Rossi and Toniolo, 1996). As a result, there was a need to restore and stabilise the Italian economy during the post-war period (Bianchizza & Frigerio, 2013; Chernov & Sornette, 2016). The development of hydraulic works was part of the Italian government’s nationalist programme (Bianchizza & Frigerio, 2013). The planning of the dam started in 1920, but residents in villages surrounding the valley did not hear of the project until 1958. SADE, Società Adriatica di Elettricità, a privately-owned electricity company, gained a permit for constructing the dam in 1943, mid-Word War II (Bianchizza & Frigerio, 2013).
This background will introduce the setting to gain an overview of the situation leading up to the landslide. Location and geological context and the line of events will provide knowledge of how the landslide was triggered.
1.1.1 Location and geological context
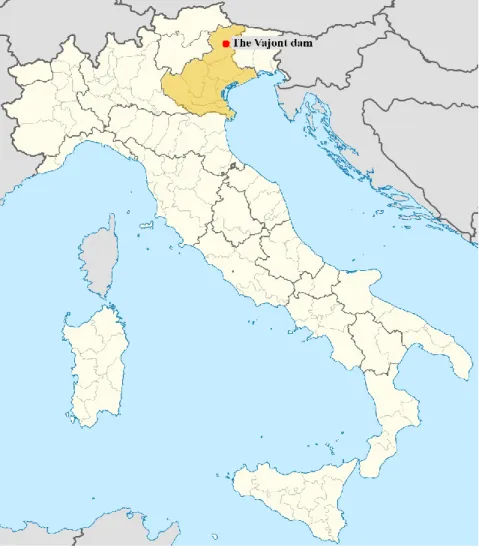
The Vajont dam is constructed in the Piave river which runs through the valley by the mountain Mount Toc located in the southeast Alps domain (Wolter, Stead, Ward, Clague & Ghirotti, 2019), figure 1. The Piave river runs through the town of Longarone and is surrounded by smaller villages such as Erto and Casso. The location of the dam in relation to the surrounding communities will later prove to be of crucial importance, with regards to the damage that was caused on each community.
Figure 1. The location of the Vajont dam. Author's own copyright.
Mount Toc, see figure 2, consists of limestones of the Fonzaso and Socchèr formations but also thin intercalations of clay (Wolter et al., 2019). The southern part of the village Erto syncline is an area with a high sensitivity of displacement (Massironi et al., 2013).
1.1.2 Line of events
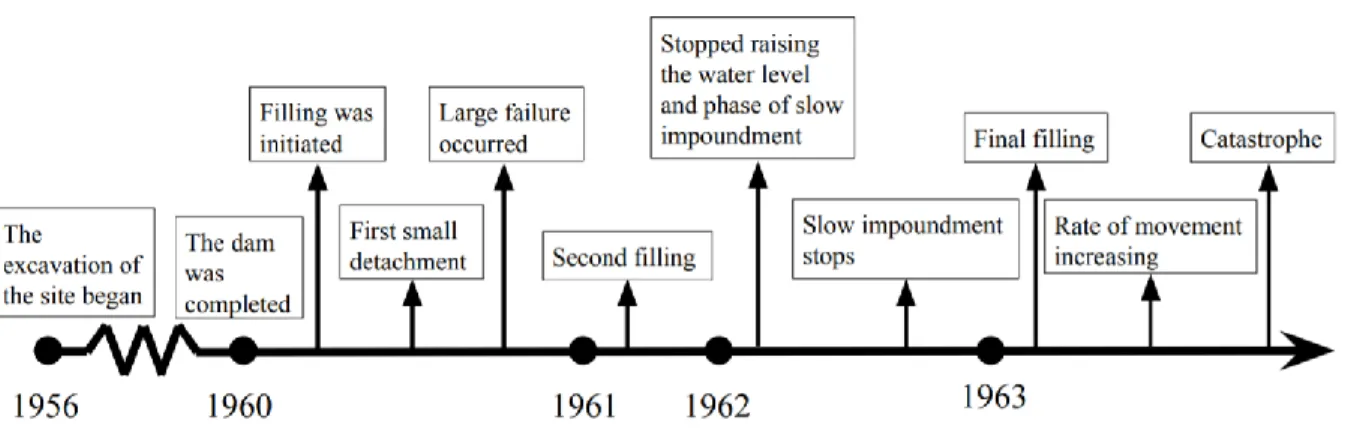
Excavations preparing for the construction of the Vajont Dam began in 1956, as can be seen in figure 3. The dam was fully constructed, and ready to be initiated with the three filling-drawdown processes on the 2nd February 1960 (Paronuzzi et al., 2013). In all the stages of the filling-drawdown procedures the rate of displacement and the amount of rainfall were observed. The observations took place in the southern part of Vajont because that was the most sensitive side of Mount Toc (Paronuzzi et al., 2013).
Figure 3. Timeline for the filling-drawdown process. Author's own copyright.
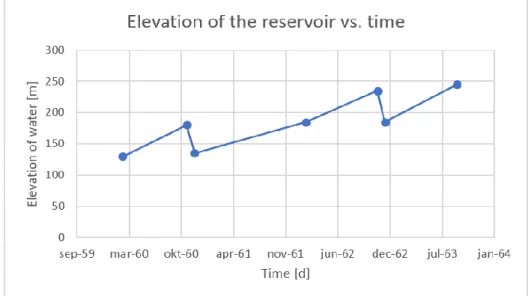
The first sign of concern was reported in March 1960 when the reservoir level had reached a level of 130 m, see figure 4. This led to numerous rockfalls nearby the so called Massalezza gorge. However, a much worse event occured in the very beginning of November 1960 when the water level had reached a level of 180 m (Petley, 2008). This formed an enormous crack of 2 km in length in the northern part of Mount Toc (Paronuzzi et al., 2013). The event occured whilst heavy precipitation was ongoing in the area. After this event the water level was dropped back to 135 m (Petley, 2008).
Between October 1961 and February 1962, the level of the reservoir was raised a second time after the initial filling. It was raised to an elevation of 185 meters, as can be seen in figure 4. The elevation of the reservoir increased to a level of 235 meters by November 1962. At that time, the velocity of the displacement of land mass had increased to 1.2 cm/day (Petley, 2008). The increase in the velocity of the displacement was regarded as a warning sign. As a response, the reservoir level was reduced to the former reservoir elevation of 185 meters to slow down the velocity of the displacement. This measure proved to be successful in the short-term and the velocity of the displacement was reduced to 0 cm/day. Engineers were now assured that they had been able to control the displacement by reducing the level of the reservoir (Petley, 2008). However, it was also noted that the behavioural response of the landslide was slightly paradoxical. The velocity of the displacement was much slower during the second filling,
In September 1963 the velocity reached a very concerning magnitude of 3,5 cm/day and the reservoir level had increased to 245 m (Petley, 2008). Since this value of elevation and displacement exceeded previous records of average measurements, engineers decided to initiate a drawdown procedure of the Vajont dam. This was done in belief that lowering the reservoir would contribute to a decrease in the movement of the slope (Kilburn & Petley, 2003). However, the rate of the movements continued to increase and reached 20 cm/day (Petley, 2008). In comparison to the behaviour during the second filling, the behaviour of the landslide mass during the third filling was as expected (Müller-Salzburg, 1986). By the evening at 22:39 on the 9th October (GMT +1) the Vajont slide was initiated (Paronuzzi et al., 2013). Veveakis et al. (2007) claim that the landslide was caused by the filling of the reservoir coupled with external effects of rainfall and snowmelt.
A volume of 270 million 𝑚3of rock displaced from the mountainside and reached a staggering velocity of 30 m/s (Kilburn & Petley, 2003). The sliding rock mass, with a length of 1700 m and 1000 m in width, plunged into the reservoir with force. The landslide remained intact and it generated a massive wave. The wave overtopped the dam and reached a maximum height of 260 meters and stretched to the other side of the valley. The village of Longarone was totally destroyed by this event while other villages were partly damaged (Müller, 1987).
1.2 Purpose
The purpose of this report is to discuss and study the origins of failure and the filling-drawdown effects for the Vajont slide. Many scholars have suggested that the landslide could have been avoided if proper investigations and monitoring had been conducted. Therefore, the report will include a literature review discussing the warning signs that were overlooked and current modern standards that are in place to avoid disasters of this kind. A line of action will be discussed further in accordance with the preceding warning signs and contemporary modern standards. To create a better understanding for the failing mechanisms and the discrepancy of the research conducted in this area, the report will include three different analyses; 1) Mechanical sliding; 2) Hydromechanical sliding; and 3) Thermomechanical sliding.
1.3 Limitations
The disaster of the Vajont slide was a catastrophe triggered by many factors. One of these factors was the combined misconduct of the government and SADE, which did not clarify who was accountable if a disaster was to happen and, also, it gave little room for the local people to have a say in the matter. Many reports have discussed this matter, and even though this is an important subject, this report will not conduct an extensive ethical analysis of the Vajont slide. However, this matter will slightly be analysed in the discussion section of this thesis.
One of the limitations is related to the construction of the dam. The landslide did not have any direct correlation to the body of the dam, in fact the dam endured a load eight times greater than what it was dimensioned for. Therefore, no further investigation of the body of the dam will be carried through as that has no direct correlation to the landslide, which was the cause of the disaster.
The economical consequences of the disaster will not be covered in this report. It is an interesting point to consider but the main focus is the mechanical aspect of the catastrophe. Investments in geotechnical studies such as further extensive drilling prior to the disaster may have provided more information about the risk related to the landslide in advance. Additionally, the economic circumstances of the project are not applicable to this study since it has no correlation to the mechanics of the landslide itself.
It is possible to conduct an analysis of the Vajont slide using 3D geometry. However, this would require an advanced numerical analysis. Therefore, 3D geometry will not be considered. The effect of precipitation and snowfall will not be taken into account in the three different cases. Only the effect of raising and lowering the reservoir will be the main factor contributing to the analyses presented in this report.
Characteristics related to the rock mass and the sliding surface such as permeability, tension cracks and stratification will not be within the scope the analyses presented. For example the entire weight of the rock mass will be based on a single value of unit weight, despite the natural variation of density in the limestone.
The conducted research provided in the literature of the Vajont slide will not extensively be compared to the output from the cases presented in this report. This is because most of the analyses in the research has different geometries compared to the calculations of this report. To conclude, the large number of simplifications in the cases would lead to inaccurate comparison with conducted research of the Vajont slide.
2. Theory
This chapter will explain theoretical aspects that are important to better understand the origins and mechanics behind the Vajont slide. Mechanical characteristics and processes related to landslides such as failure behaviour, simple mechanical sliding, filling-drawdown effects and thermomechanical aspects will be explained to create a general basis of knowledge for the reader. In addition, warning signs, mitigations and modern standards will be reviewed to better understand the case specific issues related to the Vajont slide. Despite these not being mechanical mechanisms they might also be rightfully considered as the origins of the failure.
2.1 Failure behaviour of a landslide
Landslides have caused many disasters and continue to do so. In order to prevent future landslides, it is important to understand the triggering mechanisms that cause landslides and the main types of rock slope behaviour (Huang, 2009; Paronuzzi et al., 2014). In the case of a landslide, failure occurs when the load exerted to a block exceeds the bearing capacity. At this point, the driving forces of the block have exceeded the resisting forces, which at a particular threshold value causes a failure and the block begins to slide (Highland & Bobrowsky, 2008). Failures of this kind are identified as either ductile or brittle in their behaviour. The character of landslide failure determines the predictability of the failure, which is important to prevent disasters.
Certain characteristics of rock materials determine whether the material behave as brittle or ductile. This behaviour affects the character of potential failure and deformation (Petley & Allison, 1997). It is better if the solid begins to flow, rather than break instantly. A brittle failure is much more abrupt and difficult to detect before failure compared to ductile failure. The failure range can be affected by both stress and temperature (Choo & Sun, 2018).
Landslide events can occur due to long-term destabilization. For example, long-term destabilization can be triggered due to saturation of weaker layers below the landslide (Highland & Bobrowsky, 2008; Prokešová, Medveďová, Tábořík & Snopková, 2013). This long-term destabilization is exacerbated by brittle fracture damage and strength degradation, which can occur in different parts of the rock mass (Huang, 2009). Massive rock slope failure arises from brittle fractures. These brittle fractures are aggravated by extensional strain, which can create internal shear planes due to its interface with already existing discontinuities. Studies over the past two decades associate large-scale rock landslides with unexpected brittle failure (Huang, 2009). Deep-seated landslides are especially critical, since these landslides can cause a great deal of both direct and collateral damage as the landslide ruptures.
2.2 Factor of safety
The factor of safety is the relationship between the critical and the tolerated loading (”Säkerhetsfaktor”, 2019). For a sliding mass the factor of safety can be defined as the ratio of the resisting and the driving force (Pariseau, 2011), see figure 5. Figure 5 can be expressed as components in a static model (Sällfors, 2013), see figure 6.
Figure 5. Illustration of the driving and resisting forces of a landslide. Author's own copyright.
These models generate an equation for the factor of safety, FS, see equation 1. Additionally, the friction coefficient, 𝜇, generates the friction force. Finally, the gravity is multiplied with the angle of the plane, 𝛽, to obtain the components of the force in the right direction. As can be seen in the equation below, the area of the block and the mass, both in the numerator and denominator, cancel each other out. This yield 𝑐𝑜𝑠(𝛽)
𝑠𝑖𝑛(𝛽) = 𝑐𝑜𝑡(𝛽) = 1
𝑡𝑎𝑛(𝛽). Note that no cohesion is considered in this equation.
𝐹𝑆 =
𝜇⋅𝑚𝑔⋅𝑐𝑜𝑠(𝛽) 𝐴⋅
𝐴 𝑚𝑔⋅𝑠𝑖𝑛(𝛽)=
𝜇 𝑡𝑎𝑛(𝛽)=
𝑅 𝐷 (1)The use of Newton’s second law yields:
𝐹 = 𝑚 ⋅ 𝑎
(2)For the case of a block sliding along a failure surface the equilibrium can be rewritten as following:
𝐹 = 𝐷 − 𝑅
(3)Inserting equation (1) into equation (3) generates equation (4):
𝑎 = 𝑔(𝑠𝑖𝑛(𝛽) − 𝜇𝑐𝑜𝑠(𝛽))
(4)In order to obtain values of the displacements after the factor of safety is exceeded the following equation will be used:
𝛥
𝑆 = 𝑎 ⋅ 𝑡
2 (5)Which describes the displacement, S [𝑚] in terms of velocity, a [𝑚/𝑠2] and time, t [𝑠].
Another equation will be used in determining the relationship between acceleration, time and velocity:
𝑎 =
𝛥𝑉 𝛥𝑡=
𝑉2 − 𝑉1
2.3 Mohr-Coulomb
Mohr-Coulomb is a mathematical model that has been, and is still used, for soil and rock. The model defines the shear strength at different effective stresses, as seen in figure 7.
Figure 7. The Mohr-coulomb failure criterion. Author's own copyright.
The non-linear part of the failure envelope can be difficult to approach and is therefore estimated by a straight line. The failure criterion for Mohr-Coulomb is defined as a linear envelope (Craig & Knappett, 2012), as can be seen in figure 7. The connection between the shear strength and normal stress is defined as:
𝜏
= 𝜎′ ⋅ 𝑡𝑎𝑛(
𝜙
) + 𝑐′
(7)where 𝜏 is the shear strength, 𝜎′ is the effective normal stress, 𝑐′ is the effective inherent shear strength, also known as the cohesion, 𝜙 is the angle of internal friction and 𝑡𝑎𝑛(𝜙) is the slope of the failure envelope, in the 𝜏 − 𝜎-plane. The soil or rock will reach failure in one single point (Craig & Knappett, 2012), where the circle touches the failure envelope.
2.4 Kinematics
Kinematics describes the movement of bodies without regard to the causes of the movement (“Kinematik”, 2019). The fundamentals of kinematics are position and time, how the position of a point on a body depends on the time (“Kinematik”, 2019; Waldron, Kinzel & Agrawal, 2016).
If one understands how landslides move and which mechanisms are the cause of these movements, one can predict the danger that landslides can pose. In the case of landslides, the origins of the movement have to be taken into account as well as the pure case of kinematics. Therefore the next subchapter will explain the different causes for the movement of a landslide.
2.4.1 Simple mechanical sliding
In order to understand the character of a landslide, it is important to understand its mechanisms (Stead & Eberhardt, 2013). Understanding mechanisms in large landslides includes the study of different possible failure mechanisms and their corresponding processes (Stead & Eberhardt, 2013).
Failure in a slope can be initiated due to tectonic damage or temporary conditions such as water pressures (Stead & Eberhardt, 2013). The failure surface geometry considered is therefore important to mention when discussing rock slopes since it determines how the slope will react to the conditions mentioned (Stead & Eberhardt, 2013). Huang (2013) writes that there are three types of failure surfaces, which are presented in figure 8.
The first type of failure surface, see figure 8, is the circular failure which is also called the cylindrical failure surface. This type of failure surface occurs if the materials in the slope are homogeneous with no weak layers (Huang, 2013). The second type is the non-circular failure surface. It consists of a series of planes which explains why it is also known as a plane failure surface. The failure surface will occur at a point when the critical failure surface is located along the bottom of the weaker layers. This occurs if weak layers exist at the start or end of the slope surface (Huang, 2013). The last type of failure considered is the composite failure which is circular and defined as a partially plane failure surface. It is plane because the failure surface will follow the point of weakest strata when the circle cuts a layer of weak material (Huang, 2013).
Furthermore, the rock mass quality and rock slope kinematics have a major impact on rock slope failure. This highlights the importance of rock mass quality and its distribution. If the rock mass quality is unevenly distributed, such as in the case of the Vajont slide, the different rock masses will react differently to stress and disturbances creating failure (Stead & Eberhardt).
2.5 Impact of water
In general, the effect of water flowing through a slope is a rather complicated matter (Li & Liu, 2015). Water can affect parameters such as pore-pressure, groundwater table, reduction of soil suction and the shear strength of a soil. Since water is generally considered to be a huge contributor to landslides, it is of high importance to establish the fundamentals of water effects on slope stability.
One parameter that influences the properties of a material is the degree of saturation (Sällfors, 2013). It is defined as the percentage of water that is present in the pore spaces in a given material. A soil is fully saturated if all the pores are filled with water. If some of the pores contain air and others contain water, it is known to be partially saturated. The equation that describes this property of a soil is the following:
𝑆 =
𝑉𝑤𝑉𝑣 (8)
where 𝑉𝑤 is the volume of water and 𝑉𝑣 is the total volume of voids. Values of 𝑆 range between 0 % to 100 % (Sällfors, 2013).
Another aspect to take into consideration in slope stability is water flow (Craig & Knappett, 2012). In a one dimensional fully saturated soil it is defined by Darcy’s law:
𝑉
𝑓= 𝑘 ⋅ 𝑖 𝑜𝑟 𝑞 = 𝑉 ⋅ 𝐴 = 𝐴 ⋅ 𝐾 ⋅ 𝑖
(9)Where q [𝑚3/𝑠] is the flow rate of the water, k is the permeability [𝑚/𝑠], A is the cross-section area [𝑚2],
𝑖 =
𝛥ℎ𝛥𝐿 describes the hydraulic gradient [−] and 𝑉𝑓 is the flow velocity
pressures. Water moves in the direction of higher to lower total water head. (Cheremisinoff, 1998).
For the calculations presented in this report the fundamental equation for hydrostatic water pressure increase with depth will be used:
𝑃 = 𝜌 ⋅ 𝑔 ⋅ ℎ
𝑤 (10)where 𝑃 is the evaluated hydrostatic water pressure [𝑃𝑎], 𝜌 is the density of water [𝑘𝑔/𝑚3], g is the acceleration of gravity [𝑚/𝑠2] and ℎ𝑤 is the considered water depth [𝑚].
2.6 Filling-drawdown effects
Fluctuations in the water level of a reservoir or a slope are due to natural phenomena such as heavy rain or in other cases it might be an effect of human activities. Since water flow, pore-pressure changes and water loading leads to variations in effective strength and other soil parameters, its influence must be investigated. Therefore, in this chapter, the basic effects of filling-drawdown cycles on aspects such as pore-pressure will be discussed, to better understand the outcome of the Vajont slide.
2.6.1 Rapid drawdown
In general, drawdown of a water table is likely to impact the factor of safety of a slope (Johansson, 2014). Especially the case of rapid drawdown is a major contributor to differences in hydraulic gradients. When the water table is lowered it also tends to have a different type of effect, namely a reduction in the supporting water load (Johansson, 2014).
Several researchers have conducted experiments to quantify the effects of rapid drawdown of a water table and how it affects the slope stability. Yang et al. (2010) conducted an experiment including two one-meter high soil columns with clayey sand over medium sand and silty sand over fine sand. The results of this experiment were that in both soil columns there was a similar result in terms of changes in pore pressure. The pore-pressure changed very drastically immediately after the water table was lowered in both cases (Yang, Xiao, & Yang., 2010). It was also concluded that pore pressures remained at a high level immediately after the rapid drawdown was initiated (Johansson, 2014).
Hence it can be concluded that a rapid lowering of the water level impacts the factor of safety, generates differences in hydraulic gradients, reduces the supporting water load and it develops excess pore-pressures in a slope.
negative pore-pressures. These factors have been linked to slope failure, settlement issues and a decrease of the shear strength in slopes (Johansson, 2014).
One experiment has been performed to quantify the effect of water level rise on a slope with dimensions 15 x 6 x 5 m (Chen, Fredlund, Jia & Zhan, 2009). This is many orders of magnitude lower compared to the Vajont slide but it is applicable to understand the fundamental effects of water level rise. The sample itself consisted of sandy-silty material (Jia et al., 2009). During the raising of the water level the material under the sloping surface started to fail (Jia et al., 2009). The water-flow into the soil bank initiated a wetting-induced collapse. This in turn led to losses in shear strength which was linked to decreasing matric suctions. The water-level rise also influenced the friction angle leading to a reduction from 45 degrees to 33 degrees. Hence it may be concluded that increasing the water level in a reservoir reduces the friction angle, decreases the factor of safety, contributes to an additional load effect and induces seepage in slopes.
2.7 Thermomechanical aspects
The addition of the concept “thermo” to “mechanics” describes how thermal energy affect certain mechanical properties. The amount of temperature determines how materials react to applied forces, which in turn affects their resultant motion (Regenauer-Lieb, Hobbs, Ord & Yuen, 2007).
2.7.1 Basic thermomechanics
Mechanical processes depend on force systems in equilibrium. These forces can be affected by the production and reduction of heat. Different materials have different heat capacities, meaning that the amount of energy required to increase the temperature of the material with 1˚C varies. Hence, material properties influence the heat production capacity and are key to both predict and analyse the resultant motion that is affected by the change of temperature of a material (Noll and Seguin, 2010). However, this requires input data to yield results.
To analyse a sliding mass the landslide can be assumed to act as a solid body of mass, with a considered velocity 𝑉𝑚𝑎𝑥 (Alonso, 2010). 2e represents the thickness of the shear band. 𝑉𝑚𝑎𝑥 is concentrated on the shear band. This results in an average shearing strain rate according to the equation below:
𝛾
=
𝑣𝑚𝑎𝑥2𝑒 (11)
The rate of work input per unit volume of the band material is calculated by the equation below. All of the work input will be converted into heat in the equation considered. As a result, the temperature of the landslide will increase, which in turn increases the excess pore water pressure. The excess pore water pressure increases as the water evaporates, which ultimately means that the volume of the water increases and, therefore, the pressure increases. Hence, the heat generated is dependent on shear strength, velocity and the thickness of the shear band.
𝑤̇ = 𝜏
𝑓𝛾 =
𝜏𝑓𝑉𝑚𝑎𝑥2𝑒
(12)
2.7.2 Thermal softening
The sliding of a rock mass produces local heat on the slip surface (Habib, 1975). The heat is produced from the work generated by gravity forces. This heat induces the vaporisation of the pore water if the depth of the failure surface is sufficiently deep (Habib, 1975). The vapour contained inside the rock will further lubricate the motion. Meanwhile, the friction coefficient remains constant, while the shearing resistance is reduced due to the reduction in effective normal stress. The sliding movement of a large mass can produce much heat, which is generated by the friction between the mass and the planar surface. Alonso et al. (2010) claim that water boils at a temperature of 200 ˚C when the water pressure is estimated to 1.2 MPa. However, Voight and Faust (1982) argue that thermal softening does not require vaporisation of water, but merely a change in pore water pressure. Hence, a complete scientific consensus regarding the catalytic factors enabling thermal softening does not exist.
The shear strain rate is defined by the equation below which can be found in Veveakis et al. (2007). The equation explains the extent of the deformation depending on change in 𝜃 , temperature, whereas 𝜃1= 22 ˚C remains constant. Hence, it defines how the process of thermal softening either reduces or increases the strain rate.
𝛾 = 𝛾
0⋅ 𝑒
−𝑀(𝜃−𝜃1)(13)
( 𝛾 𝛾 𝑟𝑒𝑓)
𝑁 is the strain ratio, the change in deformation, with respect to time and N is a frictional rate-sensitivity parameter that has to be taken into account (Veveakis et al., 2007). The equation below describes the shear stress,𝜏, in relation to in-situ effective stress,𝜎0′, and the friction coefficient. 𝜇𝑟𝑒𝑓is the reference friction coefficient and M is a frictional thermal parameter.
𝜏
= 𝜎
0′⋅ 𝜇
𝑟𝑒𝑓(
𝛾 𝛾𝑟𝑒𝑓
)
𝑁
2.8 Modern standards
In this report modern standards are regarded as recently developed technologies in the field of geotechnical construction. These technologies have been created to monitor landslides and to better understand earth phenomena, as earthquakes, that could trigger landslides to minimise the risk and improve disaster mitigation (Scaioni, 2015). This chapter will present some of the contemporary techniques that were not invented at the time of the Vajont slide.
2.8.1 Ground-based monitoring techniques
One of the ground-based monitoring techniques is close-range photogrammetry, CRP. This technique measures the deformation of a landslide by photographing the area and recreating a 3D-model of the landslide. This method is used for surface point tracking and comparison of surfaces obtained from dense image matching (Scaioni, 2015). CRP can reduce the time-consuming process of collecting data for landslides, however the results of the technique depend on the camera that is used (Abbaszadeh & Rastiveis, 2017). Another technique is a fixed Terrestrial photogrammetric system (Scaioni, 2015). The system is a tool that provides information on discontinuities and slope geometry (Fripo, Salvini, Francioni & Ranjith, 2011). This technique intents to directly or indirectly control the movement of the landslide by installing sensors whose movement can be detected in specific points (Scaioni, 2015).
Scaioni (2015) also discusses remote-sensoring techniques for rockfall risk assessment. This technique enables the characterisation of the main joints. Data on mechanical properties can also be measured and by using geometrical analyses unstable blocks and cliffs can be identified. Terrestrial laser scanning (TLS) is considered an effective method for monitoring landslides (Scaioni, 2015). It is regarded as straightforward and it can collect a great deal of data in short time. It is a technique useful for measuring deformation in landslides with steep slopes and difficult terrains.
2.8.2 Geophysical and geotechnical Methods
The study of passive seismic earth movement allows for examination of internal cracks within a rock mass (Scaioni, 2015). There are different purposes for using passive seismic monitoring, it can be used for studying the source itself or to get an image of the surrounding (Al-Anboori & Kendall, 2010). For example, these purposes can be earthquake monitoring, reservoir hydrofracturing monitoring, landslide and rockfall monitoring. By placing sensors inside of the rock mass and on the surface, and then analysing the movement of the rock mass it produces information on where the risks for rockfall and landslides are located (Scaioni, 2015).
According to Scaioni (2015) flow-slide propagation is a reliable technique to minimize landslide problems in mountain areas. In the case of a steep slope, less water pressure can trigger the landslide, but in the case of a gentle slope the added saturated soil might trigger the landslide, this can make the landslide move in a flow-like motion (Beddoe & Take, 2015). This technique to minimize this problem is to monitor the shear induced pore water pressure or to evaluate the mobility of the flowside (Beddoe & Take, 2015).
2.9 Warning signs
Mount Toc was often referred to as the “Walking Mountain” by the local people of the area (Chernov and Sornette, 2016). It had gained its reputation due to its proneness to landslides in the past and present. Several events that led up to the catastrophe will be reviewed in this chapter and the coined popular name for Mount Toc will prove to have significance. Many of these red flags will be covered in text and in an illustrated timeline in figure 9.
Figure 9. Timeline including some of the most critical events leading up to the landslide.
Author's own copyright.
2.9.1 Indications of concern pre-finalisation of the Vajont Dam
SADE commenced research for the Vajont Dam between 1920 and 1928. The geologist, Giorgio Dal Piaz, was employed by SADE and was involved in the project the entire time (Genevois & Tecca, 2013; Barrotta & Montuschi, 2018). Carlos Semenza was the chief engineer who designed the Vajont Dam (Barrotta & Montuschi, 2018). In literature, Dal Piaz and C. Semenza are recurring names and often held accountable, thus, their names are worth mentioning. The design and permit process for the dam was carried out between 1925 to January 1957 (Genevois & Tecca, 2013). On the 6th August 1957 Müller acknowledges that the rock mass on the left slope of the valley was weak in its properties, which poses a risk to the establishment of the construction (Genevois & Tecca, 2013).
Many geologists and engineers were involved in the design, construction and risk analysis of the dam. The irregular shape of the syncline was expected to act as a break for any potential movements (Genevois & Ghirotti, 2005). Therefore, they were certain that a slope collapse was very unlikely (Genevois & Ghirotti, 2005). During this time, research regarding slope stability of reservoir valleys was seldom included in the planning phase and geology was not considered a concrete division of science (Semenza & Ghirotti, 2000; Barrotta & Montuschi, 2018). Therefore, the research conducted was not enough (Semenza & Ghirotti, 2000).
in the past (Semenza & Ghirotti, 2000). By 1959, the designers and constructors knew that it had existed large scale movements in the past. It was recognised that there was risk attached to the scene of the projects, however, the project carried on regardless. To better control the situation, it was decided that the movement in the landslide would be monitored during all the filling stages (Mantovani & Vita-Finzi, 2003).
While the construction began in January 1957, the High Council of Public Works appointed a committee “Commissione di Collando” to inspect the construction as late as in July 1958 (Genevois and Tecca, 2013). The “Commissione di Collando” carried out field surveys and the second one took place after the finalization of the dam.
2.9.2 Indications of concern post-finalisation of the Vajont Dam
After the construction was finalized in September 1959 another four field surveys were conducted. The first filling of the Vajont reservoir started in February 1960. During the months that followed, several rockfalls appeared on the slopes of the northern toe at Mount Toc (Paronuzzi et al., 2016). These sort of rock failures usually indicate brittle behaviour and this behaviour is often paired with microseismicity (Paronuzzi et al., 2016). In June 1960, E. Semenza and Giudici distinguished the presence of an ancient deep landslide at the left slope, based on past field surveys. They argued that the ancient landslide could be triggered by an increase in pore pressure (Barrotta & Montuschi, 2018). However, Dal Piaz, disregarded the ideas of E. Semenza and Giudici. Based on his research he determined that there were only minor and slow events of displacement.
An alarming event occurred in October 1960. On the slope of Mount Toc a 2 kilometer crack created a gap over an extensive area (Petley, 2008). To better understand why the crack had taken place a deep geological survey was carried out by several specialists. This research led to the belief that the different parts of the landslide would slide at different points in time, due to their varying properties and that these parts could be somewhat controlled. In November 1960, Semenza and Müller, among others, suggested a bypass tunnel to better control the water level in the eastern reservoir (Barrotta & Montuschi, 2018). However, before the bypass tunnel was completed, local newspapers reported on the matter in February 1961, and at the same time Müller estimated a 2 ·108 m3 landslide, which would be impossible to stabilize. Research during 1961 from other specialists seems to conclude that the issue at hand was a shallow landslide, not a deep one as suggested earlier by Semenza and Giudici. As for the fifth and final field survey carried through on the 17th October 1961, by the “Commissione di collaudo”, it established that the filling of the reservoir could go on, but circumstantial displacements cannot be ruled out (Barrotta & Montuschi, 2018).
In 1962, there was more seismic activity, new cracks appeared and further landslides took place (Semenza & Ghirotti, 2000). At the time many of these events are attributed to natural phenomena. Despite the justification of these events, SADE raised the issue of a possible evacuation of the Mount Toc area. Despite past events, on 22nd July 1963 SADE called for the filling of the reservoir up to 245 m. What followed was another seismic shake, several large fissures, displacements and drawdown of the reservoir. People living on the sliding slope were
evacuated on 7th October 1963 and on 9th October 1963 the disaster became a fact (Barrotta & Montuschi, 2018; Marco, 2012).
2.10 Mitigations
This chapter has so far covered the warning signs and the list of those are rather extensive. However, the list of mitigating measures is shorter. This is because while certain red flags were taken into account, others were not. The following chapter will review the mitigating processes that followed parallel to the filling and usage of the dam, as well as explain the two main mitigating measures: the drawdown and the bypass tunnel.
2.10.1 Drawdown
The water elevation in the reservoir was altered to control the surrounding landslides. It was altered by filling-drawdown cycles, which commenced on 2nd February 1960 (Paronuzzi et al., 2013). The pace of the filling and drawdown velocity varied over time. At this point during the operation of the dam there was a lack of deeper understanding of the hydrogeological structure of Mount Toc (Paronuzzi et al., 2013). Therefore, the filling and drawdown velocities were arbitrarily decided upon. Groundwater data was introduced to the project in the summer 1961. Despite the newly acquired data it was not used as input to the operation.
In November 1960 a slow-paced drawdown of the reservoir was initiated. The reservoir level was lowered to 170 m and this level was maintained until October 1961. This action was necessary for the later construction of the bypass gallery, which is covered in the following chapter. During the entire operation of the Vajont Dam the reservoir level was consistently raised and lowered in an attempt to control the sliding events that happened more frequently. In 1962, the level of the reservoir was raised in order to better predict the landslide displacements (Marzocchi et al., 2012). It was increased slowly and reached 235 m by late November 1962 (Havaej et al., 2015). The result of this conduct was a large increase in sliding movement in December 1962 (Marzocchi et al., 2012). In September 1963, the level had increased to 245 m, while the velocity had increased to 3,5 cm/day (Petley, 2008).
2.10.2 Bypass tunnel
As a reaction to the extensive landslide, which took place on 4th November 1960, a bypass tunnel was suggested on the 15th-16th November 1960. A new geoseismic instrument was also installed to better monitor the seismic activity that had been increasing (Havaej et al., 2015). The bypass tunnel was constructed in the northern part of the valley. The construction commenced in January 1961 and was accomplished in 1961. The purpose of this was to better control the water elevation as suggested by Semenza and Müller (Barrotta & Montuschi, 2018).
3. Method
The method will consist of three mechanical applications to the Vajont slide. It will be divided into three different cases and each case will employ a particular method; 1) Mechanical sliding; 2) Hydromechanical sliding; and 3) Thermomechanical sliding.
3.1 Case 1 - Mechanical sliding
This case will address the simple mechanics of the Vajont slide. Aspects such as velocity, acceleration and displacement of the landslide will be analysed in this chapter since they are all intertwined. To understand the magnitude of the disaster it is essential to study the mechanical properties.
3.1.1 Input parameters
The following input parameters were inserted to calculations of the Vajont slide based on values acquired from different reports. The values of mass, specific weight and the inclination of the slope were gathered from Alonso et al. (2010). Values concerning maximum displacement and maximum velocity were collected from Müller (1987). The value for the length of the landslide was collected from Paronuzzi and Bolla (2012). Finally, the value for the friction coefficient was obtained from Kilburn and Petley (2003).
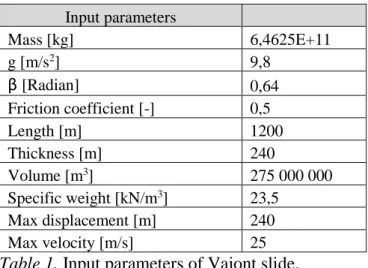
Houlsby et al. (2014) review some of the different data regarding input parameters to the Vajont slide. In table 1, table 2 and table 3, Houlsby et al. (2014: 801-802) data is summarised from different reports and investigations. The input parameters presented in table 1 below have been compared with the values presented by Houlsby et al. (2014) to verify the credibility of the data. Input parameters Mass [kg] 6,4625E+11 g [m/s2] 9,8 β [Radian] 0,64 Friction coefficient [-] 0,5 Length [m] 1200 Thickness [m] 240 Volume [m3] 275 000 000 Specific weight [kN/m3] 23,5 Max displacement [m] 240 Max velocity [m/s] 25
Table 1. Input parameters of Vajont slide.
3.1.2 Assumptions and applications
In order to simplify the calculation of the landslide, one solid block with triangular shape is assumed to be sliding down a slope. The geometry of the Vajont case is rather complex. Therefore, the geometry has been simplified according to figure 11. The alternative solution involves an analysis with two blocks and two interacting wedges, as discussed by Alonso (2010), and two different inclinations. The angle of the upper block would then be 37 degrees
and the other one horizontal. A two-block analysis involves more advanced equations and will therefore not be within the scope of this report.
The rock mass is assumed not to be deformable. To perform valid calculations, it would be troublesome to obtain satisfying results if the mass was deformable. If an assumption of a deformable mass would be considered it would require a FEM analysis such as the one performed in Crosta et al. (2016).
To analyse the shear strength and the effective stresses that the slope is exposed to the Mohr-Coulomb failure criterion is applicable. This implies the use of the Mohr-Mohr-Coulomb theory, which was presented earlier in this report.
No block rotation is considered in the movement of the landslide, hence it is considered to be in moment equilibrium. This excludes any consideration of moment and 3D effects in the analysis presented.
3.1.3 Geometry of Vajont
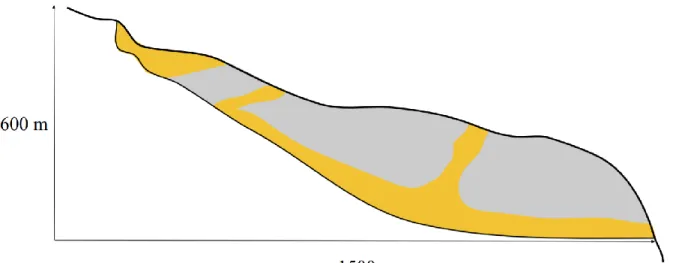
The first model of the Vajont slide is based upon an updated geological model presented by Paronuzzi and Bolla (2012). There are various geological models and cross sections available, however, the one presented by Paronuzzi and Bolla (2012) is one of the more critical cross sections to be considered. The cross section in figure 10 presented below is a simplification of the Castelletto section of Mount Toc.
Figure 10. Castelletto section of Mount Toc. Author's own copyright.
3.1.4 Geometry and considered forces
The length of the landslide equals to 1700 m according to Müller (1987). Numbers for the height, based on Paronuzzi and Bolla (2012), equal 600 m for the landslide. Since both the length of the landslide and the height are known parameters, the upper length of the assumed geometry in figure 11 is calculated according to the Pythagorean theorem. This leads to a total length of 1500 m which is then divided into 1000 m and 500 m according to figure 11. The length is divided into 1000 m and 500 m to take into account the inclination of the rock mass. The upper surface is also lowered by 100 m in order to take the inclination of the geometry in figure 10 into account.
Relevant forces to be considered in this case are the weight of the rock mass which will be divided into driving and resisting force components, which is stated in kilonewton, as presented in figure 11. The normal force, N, is perpendicular to the sliding surface, whilst D, the driving force, is parallel to the sliding surface. The position of the forces has been decided on the basis of the centre of gravity of the sliding mass. The weight of the rock mass is illustrated as 𝑊 = 𝑚 ⋅ 𝑔 in figure 11. In addition, a normal force, N, acts in the same but opposite direction of R. Between the sliding surface and the block a friction force appears, which is illustrated in figure 11, and is directed opposite to the driving force.
Figure 11. Simplified block geometry for mechanical sliding. Author's own copyright.
3.1.5 Performed calculations
For this case the calculations were firstly based on Newton’s second law where
𝐹 = 𝑚 ⋅ 𝑎, where m equals to the total mass [kg] of the landslide and a is the acceleration [𝑚/𝑠2].
F [N] is also defined as 𝐹 = 𝐷 − 𝑅 , where D, is the driving force [N] and R, is the resisting
force [N]. D is defined as 𝑊 ⋅ 𝑠𝑖𝑛(𝛽) and R is given by 𝜇 ⋅ 𝑊 ⋅ 𝑐𝑜𝑠(𝛽) according to Sällfors (2012).
Substituting the two equations above generates the following formula 𝑚 ⋅ 𝑎 = 𝐷 − 𝑅. By inserting the expressions for the driving and resisting forces the acceleration can be expressed as 𝑎 = 𝑔 ⋅ (𝑠𝑖𝑛(𝛽) − 𝜇 ⋅ 𝑐𝑜𝑠(𝛽)).
The factor of safety, FS, is then obtained by
𝐹𝑆 =
𝑅𝐷
=
𝜇⋅𝑊⋅𝑐𝑜𝑠(𝛽)
𝑊⋅𝑠𝑖𝑛(𝛽)
.
Hence the factor ofsafety only depends on the friction coefficient, weight of the sliding mass and the slope inclination. The effect of cohesion is therefore not considered in this case.
The acceleration can be calculated by assuming a friction coefficient of 0,5 which was found in Vajont clay, according to Kilburn & Petley (2003), and a slope inclination of 37 degrees. The acceleration is then considered to be constant since it only depends on the friction coefficient and the slope inclination. Acceleration can also be described as 𝑎 = 𝛥𝑉
𝛥𝑡 = 𝑉2 − 𝑉1
𝑡1 − 𝑡2.
From this formula it is possible to obtain time values for different velocities ranging from 0 - 25 [m/s]. Finally, the displacements are expressed by 𝛥𝑆 = 𝑎 ⋅ 𝑡2, which are known at this stage. This makes it possible to plot the velocities versus the displacements of the landslide. A sensitivity analysis was performed on the friction coefficient and the factor of safety regarding its impact on the acceleration. For the friction coefficient the values were altered between 0 - 1,2 in
𝐹𝑆 =
𝑅𝐷
=
𝜇⋅𝑊⋅𝑐𝑜𝑠(𝛽)
𝑊⋅𝑠𝑖𝑛(𝛽)
,
in the resisting force. Regarding the sensitivityanalysis of the acceleration it was altered between values of 0 ≤ 𝜇 ≤ 0,7 of the friction coefficient in 𝑎 = 𝑔 ⋅ (𝑠𝑖𝑛(𝛽) − 𝜇 ⋅ 𝑐𝑜𝑠(𝛽)). The friction coefficient of approximately 0,7 indicates a factor of safety above 1.
3.2 Case 2 - Hydromechanical sliding
In contrast to the previous case this chapter will address how the presence of water in the reservoir affect the factor of safety. This case will therefore introduce additional forces such as uplift and hydrostatic water pressure forces induced by the water. The role of water impoundment and its impact on the factor of safety compared to the previous case will clarify the significance of the filling-drawdown of the reservoir.
Similarly to the previous case, the Mohr-Coulomb failure criterion, Newton’s second law and trigonometric relations will be considered in the calculations. However, water induced forces will be applied in this case to emphasise the difference between both cases and the resulting impact on the factor of safety.
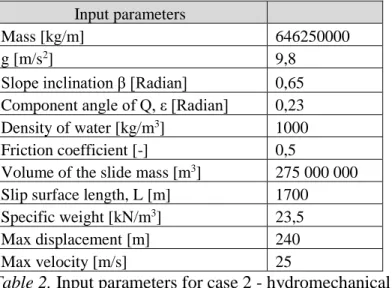
3.2.1 Input parameters
The input parameters for the case of hydromechanical sliding are the same as in the case of mechanical sliding. However in this case the new parameter will be the component angle of Q
Input parameters
Mass [kg/m] 646250000
g [m/s2] 9,8
Slope inclination β [Radian] 0,65 Component angle of Q, ε [Radian] 0,23 Density of water [kg/m3] 1000
Friction coefficient [-] 0,5
Volume of the slide mass [m3] 275 000 000
Slip surface length, L [m] 1700 Specific weight [kN/m3] 23,5
Max displacement [m] 240 Max velocity [m/s] 25
Table 2. Input parameters for case 2 - hydromechanical sliding.
3.2.2 Assumptions and applications
The forces considered in the landslide will be calculated per unit length. One of the reasons for this is because the analysis is in 2D and not in 3D. The cross-section is only valid for a limited width of the landslide. Therefore a width of 1 m is assumed in the calculations presented.
The mass is evaluated as 2350 [𝑘𝑔
𝑚3] ⋅ 275 000 000 𝑚
3 = 6,4625 ⋅ 1011 [𝑘𝑔] and is then converted into mass per unit length of the landslide by dividing the mass with the width of 1000 m. The evaluated mass can be found in table 2.
In order to calculate the uplift force and hydrostatic pressure, the sliding rock mass is assumed to be impermeable except in the sliding surface. In addition, no tension cracks will be considered in the analyses presented. Furthermore, the sliding surface and the clay underneath is considered to be fully saturated.
To sketch the geometry with the angles and water induced forces scalar paper has been used. This makes it possible to measure the distances connected to the uplift force and water pressure, see figure 13 for the corresponding lengths 𝐿1 and 𝐿2.
For the case of rapid drawdown, the uplift force is assumed to be constant and linked to the maximum elevation throughout the analysis independent of the drawdown of the water level. When studying the relationship between the displacement, velocity and acceleration the timesteps will be constant. During the motion of the landslide the water will be raised in relation to the landslide mass. The end constraint for the analysis of the displacement, velocity and acceleration will be at the crest of the slope.
3.2.3 Geometry of Vajont
The figure below displays the same geometry as in figure 11 in the previous case. However, figure 12 below illustrates a water level in the reservoir. The water has not permeated the rock mass, but fully saturated the sliding surface.
Figure 12. Castelletto section of Mount Toc with water in the reservoir. Author's own
copyright.
3.2.4 Geometry and considered forces
In comparison to figure 12, figure 13 below is similar but with the addition of the uplifting force from the water, U, and the hydrostatic water pressure, Q. The hydrostatic water pressure is then divided into sine and cosine components of the angle, 𝜀. This is in order to evaluate its components and its effect on the factor of safety.
Figure 13. Simplified block geometry for the hydromechanical case. Author's own copyright.
Figure 14, below, illustrates the positioning of the block at different time-steps as the sliding of the block has been initiated. The water level is assumed to increase constantly in relation to the sliding of the block. As the block slides along the inclined plane, the water level changes in relation to the block. 𝑡 correspond to 𝛥𝑆 and 𝑊, while 𝑡 correspond to 𝛥𝑆 and 𝑊 and
Figure 14. Simulation of the landslide at different time-steps with corresponding displacements
and water elevations. Author's own copyright.
3.2.5 Performed calculations
Firstly, the hydrostatic water pressure, P, is considered to increase with depth according to 𝑃 = 𝜌 ⋅ 𝑔 ⋅ ℎ𝑤 [𝑃𝑎], where 𝜌 equals to the density of water [𝑘𝑔/𝑚3] and ℎ𝑤 is the water level in the reservoir.
Figure 15. Illustration of the water pressure, Q and the uplift force U. Author's own copyright.
Therefore the water force will be evaluated as the area of the triangle, which is given by the following formulae:
𝑄 =
𝑃 ⋅𝐿12 [N/m]. In figure 15, Q illustrates the force due to the water
pressure, which increases linearly with depth.
Similarly to Q, the uplift force, U, is also considered to increase linearly with depth. However, U is distributed on the length of 𝐿2 which belongs to the slip surface instead of acting on 𝐿1 see figure 13.
Cohesion is evaluated by the formulae 𝑐𝐴 = 𝑐 ⋅ 1 ⋅ 𝐿 , where L is the length of the slip surface and 1 represent the width of the landslide, see table 10. The cohesive force, cA, is only
accounted for in calculations where the factor of safety exceeds 1, 𝐹𝑆 ≥ 1. When the landslide is set in motion due to the factor of safety being lower than one, 𝐹𝑆 ≤ 1, no cohesive force,
cA, is exerted on the rock mass. The value of cohesion for the clay found in the slip surface of
Vajont has been reported to be 762,3 kPa according to (Pinyol and Alonso, 2010).
The factor of safety for this case is evaluated as 𝐹 = 𝑅 𝐷 =
(𝑊⋅𝑐𝑜𝑠(𝛽) − 𝑈) ⋅ 𝑡𝑎𝑛(𝜑) + 𝑄⋅𝑐𝑜𝑠(𝜀) + 𝑐𝐴 𝑊⋅𝑠𝑖𝑛(𝛽) − 𝑄 ⋅ 𝑠𝑖𝑛(𝜀) , this equation is based on the equilibrium of forces presented in figure 13, along with the consideration of the internal friction angle of the rock mass.
The angle of
ε
is calculated by trigonometric relations according to the following equation 𝜀 = 90 − (𝛽 + 𝑎𝑟𝑐𝑡𝑎𝑛(500600). The purpose of determining the angle 𝜀 is to estimate the different components of the water force, Q, which is generated by the water pressure, P.
As illustrated in figure 14, the sliding block is assumed to exist in three different positions as the sliding has been initiated. This assumption makes it possible to calculate different velocities and accelerations. These are calculated for the three positions, which are labelled with index 1, 2 and 3. However more positions will be considered in the calculations but are not presented in figure 14 since it would make the figure unclear.
3.3 Case 3 - Thermomechanical sliding
The following case will provide better understanding how the variation in temperature affect the friction coefficient and by extension, also, affect the factor of safety. The Vajont slide was subjected to thermal softening. Therefore, the friction angle is assumed to decrease, as the temperature increases (Veveakis et al., 2007).
This chapter will employ the method of Veveakis et al. (2007) to investigate how the thermal softening process affects the frictional resistance force, ultimately increasing the total force of the landslide. One of the main mechanisms leading to the effect of the landslide, which increased the total force, was the acceleration. Therefore, this is an important issue to study in order to achieve a better understanding of the disaster.
3.3.1 Input parameters
The results of this case are based upon the following input parameters. 𝜇𝑟𝑒𝑠 is the residual friction coefficient, N is a frictional rate-sensitivity coefficient, M is a frictional thermal-sensitivity parameter and 𝜃1 is the reference temperature at a certain strain rate according to Veveakis et al. (2007). The slope inclination is, as mentioned previously, marked by 𝛽 = 37 degrees.
Input parameters µres 0,18 Table2 N 0,01 Table2 M 0,01 Table2 Θ1[C] 22,00 Table2 g [m/s2] 9,80 - β 37,00 - Sin(β) 0,60 - Cos(β) 0,80 - Tan(β) 0,75 -
Table 3. Input parameters for the case of thermomechanical sliding. Table 2 is from Veveakis
et al. (2007:12).
3.3.2 Assumptions and applications
To calculate the effects of thermal softening several assumptions have to be made to facilitate the calculations. The effect of diffusion will be neglected to simplify the calculation. This means that the temperature gradient will not be considered in the calculations.
In equilibrium the factor of safety equals to 1, 𝐹𝑆 = 1 and the friction coefficient, 𝜇, equals to 0,754 as in the case of mechanical sliding. The reason for choosing this parameter is to make it possible for comparison between the cases. The starting temperature 𝜃, will be equal to 0. In addition, the residual friction coefficient, 𝜇𝑟𝑒𝑠, is assumed to be equal to the reference friction coefficient, 𝜇𝑟𝑒𝑠= 𝜇𝑟𝑒𝑓, according to Veveakis et al. (2007). The shear strain rate has been evaluated with respect to these previous assumptions and is equal to 3,41.
The temperature is assumed to vary between 0 °𝐶 ≤ 𝜃 ≤160 °𝐶. The upper limit has been chosen to emphasize the temperature effect on the factor of safety. Choosing the upper value 𝜃 = 160 °𝐶 is large enough to capture the thermal effects on the factor of safety. Also, water effects will be neglected in this case. The focus will be to emphasize the temperature effects on the factor of safety.
3.3.3 Geometry and considered forces
The length and height of the block in figure 16 is assumed to be equivalent to the figure in the mechanical case, see figure 11. This assumption was made in order to facilitate cross-comparisons between the different cases in the method.
Figure 16. Simplified block geometry for the thermomechanical case. Author's own copyright.
3.3.4 Performed calculations
𝜇𝑐𝑠, the critical state friction coefficient is defined by the following equation: 𝜇𝑐𝑠= 𝜇𝑟𝑒𝑓( 𝛾
𝛾 𝑟𝑒𝑓)
𝑁⋅ 𝑒−𝑀(𝜃−𝜃1). According to Veveakis et al. (2007: 8) 𝜇
𝑐𝑠 has a constant value of 0,4 in the case of the Vajont slide. Furthermore, 𝜇𝑐𝑠, is assumed to be equal to 𝜇0. In these calculations thermal softening is assumed, which ultimately leads to the critical friction angle decreasing as the temperature increases. N and M are sensitivity parameters that are found in table 2 in Veveakis et al. (2007: 12). All variables with index ref are reference quantities (Veveakis et al., 2007). Every term in the equation below is constant except for the temperature θ, which will range between 0 ˚C and 160 ˚C. The purpose of the variation in temperature is to study how these variations affect the factor of safety. 𝜃1= 22 ˚C is the reference temperature according to table 2 in Veveakis et al. (2007: 12). The strain rate, change in deformation with respect to time, is defined by ( 𝛾
𝛾 𝑟𝑒𝑓)
𝑁and equals to 3,41 [-] in the following equation 𝜇 = 𝜇0(
𝛾 𝛾 𝑟𝑒𝑓)
𝑁⋅ 𝑒−𝑀(𝜃−𝜃1) = 𝜇
𝑐𝑠.
The obtained friction coefficient is used to calculate the acceleration, a [𝑚/𝑠2] according to 𝑎 = 𝑔(𝑠𝑖𝑛(𝛽) − 𝜇(𝑐𝑜𝑠(𝛽)). The variation in friction coefficient lead to different values of acceleration and resisting force. The lower the resisting force the higher the acceleration will become. Therefore, the degree of acceleration determines the size of the total force. This means that the total force will increase since 𝐷 − 𝑅 = 𝑚 ⋅ 𝑎. Hence, the decrease in factor of safety increases the acceleration, which leads to a higher risk of failure meaning that the equilibrium state is surpassed.
As a conclusion when different values of the friction coefficient are obtained the factor of safety can be evaluated according to the following formulae, similar to the mechanical case:
𝐹𝑆 =𝜇⋅𝑚𝑔⋅𝑐𝑜𝑠(𝛽) 𝐴 ⋅ 𝐴 𝑚𝑔⋅𝑠𝑖𝑛(𝛽)= 𝜇 𝑡𝑎𝑛(𝛽)
The performed calculations all generate different graphs. These include the friction coefficient vs. temperature, temperature vs. acceleration, factor of safety vs. temperature, velocity vs. temperature and velocity vs. displacement.
4. Results
The former chapter presented the analysis of the Vajont slide by mechanical, hydromechanical and thermomechanical methods. In the upcoming chapter tables and graphs will be presented to the three cases. Also, a sensitivity analysis of the input parameters will be conducted for all the cases. This analysis is important to better understand how the different parameters influence each other.
4.1 Case 1 - Mechanical sliding
As a starting point for the analysis, static equilibrium is assumed when the factor of safety equals to 1, 𝐹𝑆 = 1. This leads to the friction coefficient having a value of 0,754 according to the table 4.
Calculations
Driving Force [kN] 3811444995 Resisting Force [kN] 3813700591
FS 1,00
Equilibrium at friction coefficient 0,754
Table 4. The driving, resisting and resultant forces along with the factor of safety and failure
criterion.
A first sensitivity analysis is presented in figure 17, where the factor of safety, FS is plotted against the friction coefficient. The figure shows that when the friction coefficient is lower than 0,754 the equilibrium state is lost. After this point, the risk of failure increases remarkably. This is due to the factor of safety being lower than, FS < 1.
0,00 0,20 0,40 0,60 0,80 1,00 1,20 1,40 1,60 1,80 0 0,2 0,4 0,6 0,8 1 1,2 1,4 Facto r o f Saf ety [ -] Friction coefficient [-]