HUVUDOMRÅDE: Produktutveckling med inriktning Ljusdesign FÖRFATTARE: Albin Högkvist, Viktor Kjellberg
HANDLEDARE:Benjamin Moe Soheilian
EXAMINATOR:Myriam Aries
Postadress: Besöksadress: Telefon:
Box 1026 Gjuterigatan 5 036-10 10 00 (vx)
551 11 Jönköping
Detta examensarbete är utfört vid Tekniska Högskolan i Jönköping inom huvudområdet Produktutveckling med inriktning Ljusdesign. Författarna svarar själva för framförda åsikter, slutsatser och resultat.
Examinator: Myriam Aries
Handledare: Benjamin Moe Soheilian Omfattning: 15 hp
2
Abstract
Smart lighting has in more recent times developed into a broader market, where it has moved into people’s homes, as opposed to in the beginning when it was used more at office environments due to its benefits of high potential energy savings (Santamouris & Dascalaki, 2002). Today Smart Lighting System (SLS) provides the opportunity for private home lighting fixtures and sensors to be connected wirelessly and connect with other internet of things (IoT) products to perform required tasks. Thus, the purpose of this study is to investigate if how Swedish residents use SLS at home. To answer this, we first needed to do an inventory of the homes currently using Smart lighting and if why it is being used.
As a method for data collection of the study, a web-based survey including a mixed-question questionnaire was used with Single choice, Multiple-choice questions and a 7-Point Likert Scale. It consisted of 20 questions and got 114 respondents to answer about their usage of SLS. Out of these 114, 39 participants were users of SLS. The raw data generated by the survey were analysed and visualized using descriptive statistics with tools like Pivotable and Pivot charts in Microsoft Excel. In general, Functionality is the most important aspect when investing in SLS across all age-groups and gender. Turn On/ Off and Dimming is the most common way of controlling the lights and the
3
Sammanfattning
Smart belysning har på senare år utvecklats till en bredare marknad, där den har flyttat in i människors hem, till skillnad från begynnelsen när den användes mer i kontorsmiljöer på grund av dess fördelar med stora potentiella energibesparingar (Santamouris & Dascalaki, 2002). Idag ger Smart Lighting System (SLS) möjlighet för privata hem belysning och sensorer som ska anslutas trådlöst och ansluta med Internet of things (IOT) produkter för att utföra nödvändiga uppgifter. Syftet med studien är alltså att undersöka hur svenska invånare använder SLS hemma. För att svara på detta behövde vi först göra en inventering av de bostäder som för närvarande använder Smart belysning och om varför det används.
Som en metod för datainsamling av studien användes en webbaserad undersökning med ett frågeformulär med blandade frågor med enkelval, flervalsfrågor och en 7-point Likert scale. Den bestod av 20 frågor och fick 114 respondenter att svara på om deras användning av SLS. Av dessa 114 var 39 deltagare användare av SLS. De rådata som genererades av undersökningen analyserades och visualiserades med hjälp av beskrivande statistik med verktyg som Pivotable och pivot charts i Microsoft Excel. I allmänhet är funktionalitet den viktigaste aspekten när man investerar i SLS i alla åldersgrupper och kön. Slå på/ av och dimring är det vanligaste sättet att kontrolera lamporna och Smarttelefonen den vanligaste interaktion i hemmiljön.
4
Contents
Abstract ... 2 Sammanfattning ... 3 1 Introduction ... 6 1.1 Background ... 61.1.1 What is Smart lighting? ... 6
1.1.2 Why is it used? ... 6
1.1.3 Usage and users present knowledge ... 7
1.2 Problem description ... 7
1.3 Purpose and research question ... 7
1.4 Scope and delimitation ... 8
1.5 Disposition ... 8
2 Theoretical framework... 9
2.1 System ... 9
2.1.1 Lighting control system (LCS) ... 9
2.1.2 Smart lighting system (SLS) ... 9
2.2 Functions ... 9
2.2.1 Main functions... 9
2.2.2 Controls ...11
2.3 Investment ...11
2.3.1 Swedish residents purchasing behaviour ...11
2.3.2 Challenges and opportunities ...12
3 Method and implementation...13
3.1 Data collection...13
3.1.1 Literature review ...13
3.1.2 From Manufacturers ...13
3.1.3 Survey ...13
3.2 The methods relevance to the research question ...13
3.2.1 System ...14
3.2.2 Function ...14
3.2.3 Investment ...14
3.3 Implementation ...14
3.4 Participation ...15
3.5 Method of data analysis ...15
3.6 Credibility ...15
5 4.1 System ...17 4.2 Functions ...19 4.2.1 Controls ...22 4.3 Investment...24 4.4 Relationships ...26
4.4.1 What is the main application of SLS in Swedish homes? ...26
4.4.2 Wich characteristics of the SLS are sued and why are certain functions not used? ...27
5 Discussion ...30
5.1 Result discussion ...30
5.1.1 System ...30
5.1.2 Function ...30
5.1.3 Investment ...31
5.1.4 RQ1 – Main application of SLS in Swedish homes ...31
5.1.5 RQ2 – Characteristics of SLS ...31
5.2 Method discussion ...32
5.2.1 Pro’s ...32
5.2.2 Con’s ...33
6 Conclusions and recommendations ...34
6.1 Further studies ...34
7 References...35
6
1
Introduction
1.1 Background
1.1.1
What is Smart lighting?
Initially, Smart lighting was developed as a lighting technology to increase energy efficiency (Chew, Karunatilaka, PinTan, & Kalavally, 2017). This means that lighting fixtures with the use of sensors and/ or automated controls could adjust to the various conditions that present itself, such as the presence of daylight and room occupancy. Smart lighting has in more recent times developed into a broader market, where it has moved into people’s homes, as opposed to in the beginning when it was used more at office environments due to its benefits of high potential energy savings (Santamouris & Dascalaki, 2002). Today Smart Lighting System (SLS) provides the opportunity for private home lighting fixtures and sensors to be connected wirelessly and connect with other internet of things (IoT) products to perform required tasks. As is with Smart home devices, the application and idea are for these devices to be able to make optimizations to how they are being used. This could be described by Chew et al (2017) as through an intelligence-based system integrated into each device that recognizes feedback from user inputs and connected sensors and manipulates it to provide benefits such as energy savings, ease of use, security, etc. (Chew, Karunatilaka, PinTan, & Kalavally, 2017). The industry is commonly using both Smart and intelligent as a nomenclature when describing their system and its abilities without any single one preference on wording when marketing their systems. But there is a difference between being intelligent and being Smart. Being Smart doesn’t necessarily mean that the system needs user inputs or sensors to optimise the lighting preferences, a Smart system can after the initial setup continue to run by itself without other inputs. To be able to call a lighting system for SLS, it must use a system of different devices that can talk to each other wirelessly over a network. This means that you need a hub or bridge that can receive signals from a specified source to control the system from and pass that on to the end station which is the light source. Which in this case must be LEDs as they must be digital instead of analogue, to be able to send the data in the form of information packets. To control the system, you need a control that is usually in the form of an app in a Smartphone but can also be a remote or a panel on the wall.
1.1.2
Why is it used?
With the ever-growing market of Smart home appliances, the features these devices provide also widens, and in turn making these devices connect could from one view be seen as a step to limit energy consumption. The way that these Smart systems can impact energy consumption and save energy is that they can automatically turn on and off (as programmed). This can be even more potent in combination with sensors when these systems keep the lights on only when a certain value is reached. Since the contribution to almost one-third of the world’s energy consumption comes from buildings where lighting fixtures are a big part of (Lucon & Ürge-Vorsatz, 2014). There is a need to optimize how energy is being used. Furthermore, this has also made it possible for Smart devices to have an impact on the regular household. It aims to provide usability and ideally it could provide ease of use for activities such as providing automation. Mennicken & Huang (2012) describes four motivations for home automation, they found that some people seek a modern home and as they see it, modern is smart. The second motivation was driven by experienced benefits with automation, and the third, some people taking on home automation as a hobby. And finally the fourth, a desire to save energy.
Smart lighting has as well as other Smart home devices a purpose to improve the living experience (Wilson, Hargreaves, & Hauxwell-baldwin, 2014). This can be achieved by providing the users with
7
additional services such as comfort (automatically turning on/ off or dimming lights to personal preference), entrainment (i.e., stimulation from colours), or information in form of visibly showing for example when it is raining outside by turning blue. According to Hargreaves et al (2018), there are four primary reasons for what motivates people to live in a Smart Home: a desire to save energy, interest in technology and automation, protecting the environment and improved control of appliances.
1.1.3
Usage and users present knowledge
Devices are turning Smart and due to increased marketing towards Smart devices, this might lead to an increase in users taking on Smart appliances (MarketsandMarkets, 2020).However, to the extent to which the user's understanding of all the functions little is known (Hargreaves, Wilson, & Hauxwell-Baldwin, 2018). Earlier studies show that Smart home systems are being used differently depending on the user’s level of knowledge. Moreover, Hargreaves et al (2018) write about the connection in the usage of a Smart system that is dependent on how people is interacting with it. They could see that for one person the usage increased once she started using a for her familiar device, the Smartphone. Also, they find people most likely to use less of the functions of the system over time, not least the more advanced functionality of the system. These issues can be related to the scenarios where there was an internet connection lost without users noticing or in some cases there was not enough information available online for the users to solve the problems. In turn, this led to the participant eventually not caring to resolve the issue (Weijia He, 2019). Adding to this some participants went further thinking they had to be an expert to write theirprograms for the more advanced controls. This motivates the need for an understanding of the usage of a home Smart Lighting System. However, there is still very little knowledge about how Smart lighting is being used. It is known that studies investigating Smart home technologies focus on energy savings and aspects of comfort (Kwon, Im, & Lim, 2014).
1.2 Problem description
Aspects of Smart lighting such as advanced controls, convenience, and ease of use may create opportunities such as energy savings.Advanced technologies often lead to more options for the end-user, it is therefore interesting to see how they are being utilized in the home environment by the end-user. Adding more options and features may create more opportunities but could also lead to more confusion, difficulty barriers, and not be user friendly. All the provided options can be overwhelming for some users and therefore it is a possibility they are not being used as intended. Usage is most likely dependent on how familiar the user is with the controls in which the user interacts with the system (Hargreaves, Wilson, & Hauxwell-Baldwin, 2018). Some less technical users might have no interest in investing time to understand all the options and technical terms and might not have the technology required to even begin to start using the system. Instead, this might lead to a missed opportunity where SLS is not fulfilling its purpose of simplifying everyday life and limit energy consumption and is not in tune with the inhabitants. It leads to a counter-intuitive home that should have been otherwise more intuitive for its inhabitants (Mennicken, Vermeulen, & Huang, 2014).
1.3 Purpose and research question
From the problem description, it appears that SLS can provide opportunities for controlled home lighting but can also be hard to understand and that the user interaction can be problematic. Thus, the purpose of this study is to investigate if how Swedish residents use SLS at home. Furthermore, it motivates the need to investigate home characteristics and the residents' intentions with the usage of SLS in their homes. By providing knowledge on how the Swedish residents use SLS at their homes, this study intends to help developers of SLS recognize what Smart Lighting functions to target and how
8
they should be presented. To answer this, we first needed to do an inventory of the homes currently using Smart lighting, and if why it is being used. This led to the construct of our first research question.
1. What is the main application of SLS in Swedish homes?
Knowing the main application we also need to investigate more details to get a widen understanding of how SLS is being used. While knowing the approximate amount of homes using SLS and its main application, it is also a necessity to understand the characteristics of the SLS and how it is being used. From a sample of people already using SLS in their home environment. To answer this, we constructed our second research question.
2. Which characteristics of the SLS are used and why are certain functions not used?
1.4 Scope and delimitation
In this study about Smart lighting usage,we will look at what type of homes are using SLS and their characteristics such as gender, age, and the number of residents in their homes. It will also contain what type of lighting fixtures they have but be limited to if they are of a Smart lighting characteristic or not. Smart Light sources and fixtures are the kinds that can connect to a central unit, a hub, or a bridge, linking all the devices to the home network. The data collected by the participants in this study is only from their responses in the survey. It is not collected from inside users' homes. It will only look at residents currently residing in Sweden.
There are broad spectra of Smart home products on the market and this study will limit itself to only contain products that are used in the lighting market. We will only look in-depth at Philips Hue and IKEA Home smart TRÅDFRI to evaluate the main functions provided but will allow the participants in our survey to fill in any SLS they are using after we have explained to them what the definition of SLS is for this study. Functions specific for other systems not mentioned will not be taken into consideration. The study will not take into consideration how specific light functions affect the participants. It will neither take consideration of design features in the participant's households such as textures and how the lights affect colours.
1.5 Disposition
The report will begin with Chapter 1, which is an Introduction to the topic with a Background, Problem
description, Purpose and research questions, and a Scope and delimitation presented. Followed by
Chapter 2, which contains the Theoretical framework of the study were previous research and literature that forms the basis of this study are presented. In Chapter 3 the Method and
implementation of the study are showcased. Chapter 4 then presents the Results of the study followed
by Relationships. Chapter 5 will then present a Discussion where we will go in-depth explaining our thoughts in a Result discussion and Method discussion. Chapter 6 contains the study’s Conclusion and
recommendations and finishes with a discussion for Further studies. The report will be concluded with
9
2
Theoretical framework
This section of the report describes the present relevant theoretical work that connects to the subject areas of value used. Three aspects play an important role in the transition from conventional light sources to Smart LEDs: System, Functions and Investment. These three aspects are discussed below.
2.1 System
2.1.1
Lighting control system (LCS)
LCS is a solution to control lighting based on an intelligent network of devices that uses various systems inputs and outputs in regards to lighting control, to communicate with each other with the use of a central computing device. When spoken about, LCS is often referred to as Smart Lighting. These systems can be used in both interior and exterior environments to provide the space with the right amount of light where and when its needed and are thus implemented to save energy (DiLouie, 2007).
2.1.2
Smart lighting system (SLS)
The definition of SLS is a system where the idea is that of a lighting system that can control a bigger set of lighting functions such as turn on/ off, dimming the light, making schedules, and changing lighting aspects such as colour temperature. To achieve these services, the system communicates and interconnect data through Smart luminaires that have the option to send data back and forth between each other (Rossi, 2019). These Smart luminaires are LEDs that are connected to a central unit, a hub or bridge, linking all devices to the (home) network. To satisfy the lighting needs of people in interior spaces, these systems have their intelligence that can make the lighting systems adaptability incredibly high based on the modularity, integration, and customisation these lighting systems bring (Rossi, 2019).
2.2 Functions
2.2.1
Main functions
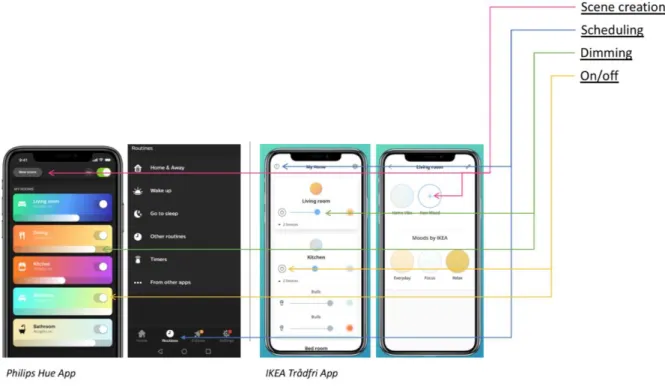
The main functions provided in SLS are Scene creation, Scheduling, Dimmability, and Switch On/ Off. These were identified by reviewing Philips Hue and IKEA Home smart TRÅDFRI mobile applications to gather the functions provided by these systems (Signify Holding, 2020)(Inter IKEA Systems B.V. 1999-2020, 2020). This was done to identify the fundamental functions provided and displayed to the user in SLS. Reviewing these systems gave insight into what to be expected and considered interesting to include in the survey. Both options of SLS was tested by the authors with Smart bulbs and the provided set of functions within the apps themselves at the point of writing this article. The experience of testing the systems is that the IKEA system was more basic in its set of functions and that the Hue system had a bit bigger set of functions that users could control. Different ways of controlling these systems after they had been set up were by a Smartphone, Switch/ Remote, Voice, and Sensors.
10
Figure 1. Displaying the set of functions provided inside of the app IKEA Home smart TRÅDFRI (Inter IKEA Systems B.V. 1999-2020, 2020)
11
Figure 3. Overview of the locations of SLS functions in their respective apps (Signify Holding, 2020) (Inter IKEA Systems B.V. 1999-2020, 2020)
2.2.2
Controls
With the constant development of technology, the way today's lighting is controlled has also developed. Today, this can be done in more than one way compared to when in the past only On/ Off was used with a switch. As Gerhardsson et al (2019) also say, light control is now a component that is especially important for the modern home's light system. As it enables users to control more aspects of light such as its intensity and to choose whether to do it manually or automatically. With SLS, the way you can control light in the home environment looks very different. Common ways in most SLS are to use a Smartphone, a remote control/ panel, or with your voice. With the help of these accessories and others such as sensors, you can also set up your system to be automated and adapt to specific needs where the user does not have to worry about turning the lights On/ Off. This instead happens automatically based on preprogrammed lighting scenes and schedules.
2.3 Investment
Smart device's popularity has increased exponentially and they are built and have an opportunity to provide the end-user with convenient features such as automation, ease of use, comfort, and energy savings. To be able to decide on the reasons why people’s actions and decision-making when faced with why they use certain functions or choose which systems to purchase, we will use the well-known Goal Framing Theory (GFT). Introduced by Lindenberg & Steg (2007) it categorizes people into three different primary objectives depending on what motivates people: hedonic goals (i.e. feeling good), gain goals (i.e. saving money or time), and normative goals (i.e. feeling morally obliged to act in a certain way).
2.3.1
Swedish residents purchasing behaviour
Gerhardsson et al (2019) showed that an average of 39 light sources is used per Swedish household. It confirms that, although LED light sources have been widely acknowledged, many phased-out light sources are still in use. By looking at what type of housing tenure type have the most lamps, the study shows that rented apartments had fewer lamps per home (24lamps/home, 0.33/m2) when compared
12
to tenant-owned apartments (33 lamps/home, 0,39 lamps/m2). There is a significant difference based on housing tenure type. Laying down a base of what type of light sources that are most used and therefore the resident's lamp purchasing behaviour will be beneficial. According to Gerhardsson et al (2019), who studied what aspects will affect Swedish residents purchasing behaviour when choosing lamps, the price of the lamps was not the biggest aspect. When respondents of their survey rated performance factors, the most important was ´lamp quality´(colour tone), followed by ‘lamp lifetime’ and ‘energy efficiency’, ‘purchasing cost’, and ‘lamp design’.
A study performed by Juric & Lindenmeier (2018) has evaluated why there was consumer resistance to buying Smart-lighting products. They found out that along the lines of other research in the area, health concerns and the pricing point was the major reasons for consumers hesitance. Their findings show that in terms of age groups and gender, young individuals and men were the most inclined to adapt to the new technology and that women and older age groups were more resistant. Furthermore, it shows that social pressure and performance expectancy was critical to how these products would perform on the market. Another study suggests that perceived usefulness is the driving factor of continued usage of Information Systems (IT) when compared with the perceived ease of use (Davis, 1989).
2.3.2
Challenges and opportunities
These devices might provide some negative experiences that are critical to highlight. As described by Weijia He (2019), participants of a survey about Smart devices in their home found network issues, which were mostly down to network failures and power outages, and build-in learning features (e.g., Nest learning thermostat) such as complex schedules when participants had different personal preferences, to spoil the user experience. Evaluating these experiences and providing knowledge on what works and not, will be valuable and highly beneficial to allow the developers to get these Smart devices to the next step. Furthermore, it is important to get a better knowledge of the mentioned areas to provide the end-user with a system that is easier to understand and interact with. Figuring out these points will in turn make these systems attractive for consumers and make a compelling choice to invest in.
There is an estimation that the Smart lighting market will grow by 18%, from USD 13.4 billion in 2020 to USD 30.6 billion over the next five years. This seems to be mainly by growing awareness about energy savings worldwide. There are also other driving factors behind the growth of the market such as the advent of integrated lighting control systems, an increase in adoption of LEDs that also is decreasing in cost, and the integration of lighting solutions with Smart devices (MarketsandMarkets, 2020).
13
3
Method and implementation
In the following chapter, an explanation of the choice of method applied will be presented. It will also contain a description of how the implementation was carried out and how the data were collected and analysed.
3.1 Data collection
3.1.1
Literature review
As a method of collecting data, a literature review was conducted to be able to find studies that had previously investigated subjects correlating to smart lighting, smart home technology, user interaction, purchasing behaviour, technology, energy efficiency, and functionality in the residential environment. Adequate literature was searched for in databases Scopus and Primo. Keywords that were used in the search were: Smart lighting, IoT, User experience, User interaction, Smart homes. After reviewing the literature, the snowball-sampling was used. Meaning when we found a peer-reviewed source that was close to our subject we used its references as part of our literature. Then it was used to find likewise references to the subject. Some of the literature was provided by a supervisor. The reviewed literature, which was considered interesting and relative to the topic, then formed the basis for the questions used in the survey to collect data on the topic.
3.1.2
From Manufacturers
Apps and manuals were collected and reviewed from the manufacturers' Signify/ Philips and IKEA websites. Philips's application is called Philips Hue and IKEA is called IKEA Home smart (TRÅDFRI). The apps were available to be downloaded from both Android (Play store) and iOS (Appstore).
3.1.3
Survey
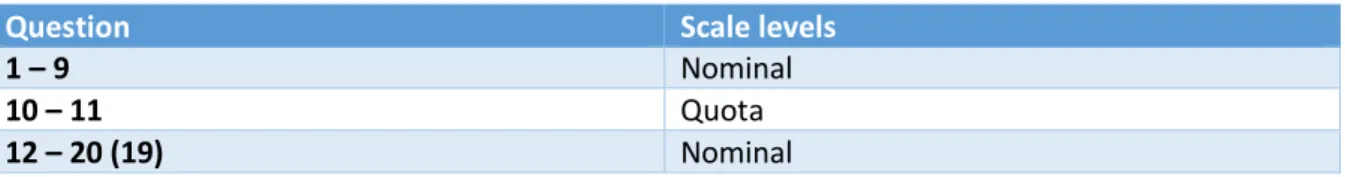
The study's data collection consisted of collected empirical data from the survey that were answered by the participants. The property of the variables measured can enrol different scale levels (Patel & Davidson, 2011). Table 1 describes the scale levels of the variables measured in the survey.
Table 1. Descriptive table of what type of data the survey questions consisted of.
Question Scale levels
1 – 9 Nominal
10 – 11 Quota
12 – 20 (19) Nominal
3.2 The methods relevance to the research question
This is a survey-based study taking on a quantitative approach, it’s an effective way to get a reasonable sample size in the set timeframe. It is a good way to draw universal conclusions from the use of SLS in Swedish homes. The material collected gives us measurable data on how a scattered smaller part of the Swedish population uses SLS. The data collected can provide a picture of how SLS is used in Swedish homes and be able to set it against each other on a larger scale, to get a general picture of how it is used. A quantitative method is used to collect statistical information about the given situation (Patel & Davidson, 2011). More specifically investigating the homes with SLS. As a method for data collection of the study, a web-based survey including a mixed-question questionnaire was used with Single choice, Multiple-choice questions, and a 7-Point Likert Scale. Asking for usage and the way of interaction with the system and how the participant would rate the functionality of certain functions. This was to get measurable information related to the participant and it was used to answer research questions one and two.
14
3.2.1
System
The survey was designed to distinguish which people were using SLS and which ones were not with the first question in the survey. This meant that people that participated in answering the survey and were not an SLS user, did not get to finish answering all the questions. They did, however, provide a number of how many participants that were not users of SLS. It was also noticed that there are many different ways of what common people defined as Smart lighting, therefore there needed to be a control question to make sure the participants are actual users of SLS, in the way it has been defined in this report. In the control question, it was asked about what kind of light sources was used, conventional, Smart, or a mix of both.
To answer the first research question it is relevant to get some information about the system in Swedish homes. First, what platform/ system are they on, second what kind of light sources do people have connected to the system. More specifically: are the light sources Smart, is working conventional light sources being replaced, and do the system contain more light sources than previously.
To answer the second research question, to get an idea of which characteristics are used asking about the light sources was necessary. More specific, does the home include only smart or a mix of smart and conventional light sources and also does the home include more light sources than before.
3.2.2
Function
Information about the usage of functions and choice of controls gives relevant information in answering both research questions. What functions are being used and the way the user is interacting with the system may give an idea of the main application of SLS. Moreover, the size of the household and how many people there are, characterize the home and will most certainly have an impact on what functions are being used. Letting the participant rate functionality may show us a connection between rating and usage.
Our idea is that the usage will be different between gender and among different age groups. The idea is that usage might be different regarding the type of home agreement. Therefore, it was necessary to collect this information to see if there can be other reasons for different usage and not only be connected to the home and size of the home.
3.2.3
Investment
The housing tenure type in which the participant lives may have an impact on investment. Information about the housing tenure type and why the participant chooses to invest in SLS is relevant to answer research question two. By asking what was the main reason why the participant chooses to invest in SLS will either show the participants' beliefs in the product and/ or what problem the participant wishes to solve with SLS. That said this information may give a lead towards the direction in which SLS will be used.
3.3 Implementation
The survey was distributed online, shared on social media platforms LinkedIn, Facebook, and was also sent to the municipality of Motala employees by Email. They were told to fill it out and forward it to people in their contact network. The survey is highly structured and standardised as described by Patel & Davidson (2011), with fixed answers and identical questions in the same order for every participant. Some questions with several multi-response options, yes or no, and a grading scale that was constructed after relevance to the research questions (see appendix). This was done to be able to analyse the dataset numerically. Thus, we can pin the majority of the main application for SLS and what functions are the most commonly used (Patel & Davidson, 2011).
15
For creating the survey, the online software Microsoft Forms was used. After testing and evaluating other platforms such as this one, it had the correct use of features that were important, such as options for the creation of each question. It also made it easy to exclude the participants that were not meeting our criteria for this study by only letting the participants that answered they have SLS finish the survey. The survey consisting of 20 questions was tested by letting students and teachers at Jönköping University evaluate it so that the survey was working as intended and that it was understandable. This happened beforeit was sent out and it took approximately five minutes to fill out. Because of the goal of 50 people answering the survey, it was most important that the survey did not get too long (Schrepp, Hinderks, & Thomaschewski, 2017), increasing the chances of people filling out the survey. The importance of participating was explained beforehand and a description of how the collected information is being handled was described to the participants before entering the survey.
3.4 Participation
The participants were a random sample of adult (18+) Swedish residents. Only gender, age and if the person is living in Sweden was collected as personal information.
3.5 Method of data analysis
The data was imported from Microsoft Forms into Microsoft Excel. The raw data were first cleaned removing objects that did not match the criteria for this study. Some answered that they have Smart bulbs which are a requirement, though they also mention they use a system that in this study is not defined as a Smart lighting system. It is a risk that these people had confused Smart plugs with Smart bulbs. For systems mentioned that had not been predefined as Smart lighting systems, was placed in a separate system category that was called Other. The participants that were removed were six entries answering they are only using conventional light sources. This conflicts with the criteria of this report's explanation of what Smart lighting is. The remaining entries were then sorted by age and gender and analysed using PivotTable. Descriptive statistics in Excel was used to be able to summarize a sample size and to be visually displayed in graphs and tables.
3.6 Credibility
To be as credible as possible, the authors made sure to use applicable methods for every aspect of the study. In the beginning, it was then necessary to evaluate and get an understanding of existing technology, to be able to reliably perform the designing of the survey. This means that finding out what the two most common systems were and then deciding to do self-tests of them to evaluate what is wanted to be included in the survey.
As in a quantitative study, there is a “true” value of the study object that the authors want to get hold of. This means that the authors had to be very careful about how the measures were performed. As with the design of the survey, to not tamper with the object by letting them know what is expected of them (Patel & Davidson, 2011). Therefore, the survey had to be prepared well and also many pre-tests of the survey on other non-study objects were made by letting them evaluate it and give feedback, before using them to find out what worked and what did not. Furthermore, it was ensured that the questions in the survey could not be misinterpreted to reduce the margin of error, so the respondents do not misunderstand what was asked of them. Also by using a mix of response options this might have kept the participant committed to the allotted task. The self-designed survey who included rating scales and multiple-choice questions took inspiration from Stahre (2009) who had successfully done a similar method in previous scientific studies in the field and thus was deemed applicable.
16
The study used itself of relevant peer-reviewed literature to this study found on various well-known scientific databases on the web and books found at the Jönköping University library. The reliability was strengthened since the survey was designed so that only the actual users of SLS could be counted towards certain parts of the study. It was also designed to only count responders that say they lived in Sweden, although there was ultimately no way for the authors to know if all the respondents answered the survey genuinely. An attempt in keeping the participants to be Swedish residents was made by first, all information provided in the survey was all written in Swedish, and second, a question in the survey was put in asking if the participant lives in Sweden. Answering no to this question closed the survey, greeting the participant with a thank you for participating message. Ensuring the credibility of the data set we let MS form record the data and second, the data was reviewed and cleaned of input obvious that a participant had misinterpreted the question. More specifically by reviewing the string of input for that participant could tell that he/ she was not a user of SLS. Regarding the sample size gathered in the study, it is of a too low number to generalize the whole population and means further studies on this field is needed to ensure the situation. By not exceeding the set delimitations for the study and keep it within its specified frames, its reliability is strengthened.
17
4
Results
In this chapter, the analysed data will be displayed as the results of the study. Using the same structure as in the theoretical framework the results will be presented in the following order System, Function and Investment.
Based on raw data taken from the Microsoft Forms survey, of the 114 participants who answered the survey, 45 respondents answered that they have SLS in their home. The 45 respondents were all residents of Sweden. Of the 45, 29 were Men and 16 were Women. As previously mentioned six out of these 45 participants were removed because they were not users of SLS.
4.1 System
There are a few factors that can tell more about the characteristics of SLS in the home environment. The following Figure 4 shows that in this study the majority of people have a mix of Conventional and
Smart light sources at home, 33 people answered they have both and six people answered all their
light sources are Smart.
Figure 4. Characteristics of SLS in terms of light sources.
SLS could be seen as an upgrade, and when people decide to upgrade they make changes to their home lighting. In regards to SLS, it seems that people buy new light sources to upgrade and not only to replace broken parts. Figure 5 shows that most people replace working light sources with Smart light sources. For Women, the results were ten people saying Yes and four people said No if they replace already working light sources for Smart light sources. For Men, 18 people were saying Yes and seven said No. There seems to be no significant difference between Men and Women. The ratio of No to the total of Women is 29% (no(4)/ N=14) and with Men 28% (no(7)/N=25).
33 6 0 5 10 15 20 25 30 35
Conventional and smart Only smart
18
Figure 5. When men and women replace their light sources.
Another factor contributing to the characteristics of SLS in the home environment is the kind of platform that is being used. These are the results from the survey showing what platforms are being used (Figure 6), 14 people are users of Philips Hue, 13 people IKEA TRÅDFRI, seven people use Other SLS not defined in the survey and five people use Multiple SLS. As mentioned previously, for systems that had not been predefined as Smart lighting systems, they were placed in a separate system that was called Other. The Other systems that the participants mentioned were Plejd, Co home, Shelly, Telldus, Nexa and Casambi.
Figure 6. The number of people per SLS.
10 18 4 7 0 2 4 6 8 10 12 14 16 18 20 Women (N=14) Men (N=25)
Do you replace already working light sources to
smart light sources?
Yes No 14 13 7 5 0 2 4 6 8 10 12 14 16
Philips Hue; IKEA TRÅDFRI; Other; Multiple;
N um be r of pe op le SLS
19
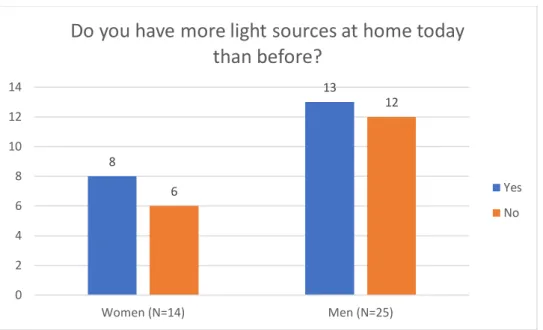
To further dig into characteristics of SLS it is interesting to look for changes in the number of light sources that people are using in the home environment. If users of SLS have an increased number of light sources in their home compared to before. It seems that it is an even mix of people increasing the number of light sources and replacing the old (Figure 7). No significant difference between gender, eight Women have more light sources than before, six Women have the same or less. For Men, 13 people report they have more and 12 people report they have the same or less.
Figure 7. Increased number of light sources with SLS, the same number or less.
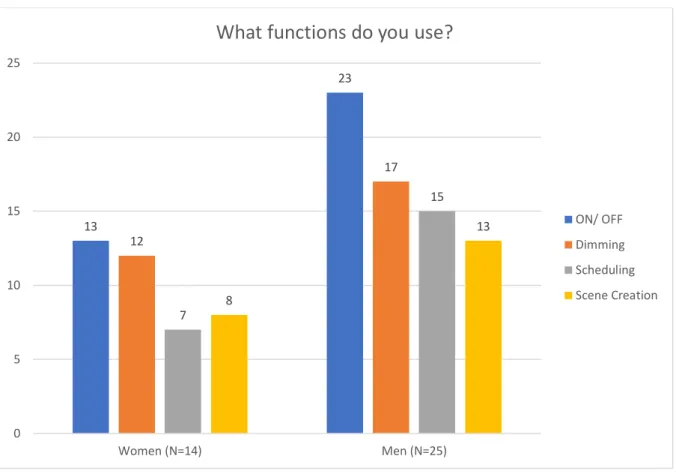
4.2 Functions
To get an understanding of how people interact with SLS it is crucial to know what functions they use. The following Figure 8 shows the functions being used by the people in this study. For Women 13 people use the ON/ OFF function, 12 people use Dimming, seven people use Scheduling and eight people use Scene Creation. For Men 23 people said they use ON/ OFF, 17 people use Dimming, 15 people use Scheduling and 13 people use Scene Creation.
8 13 6 12 0 2 4 6 8 10 12 14 Women (N=14) Men (N=25)
Do you have more light sources at home today
than before?
Yes No
20
Figure 8. The total number of men and women and the functions they use.
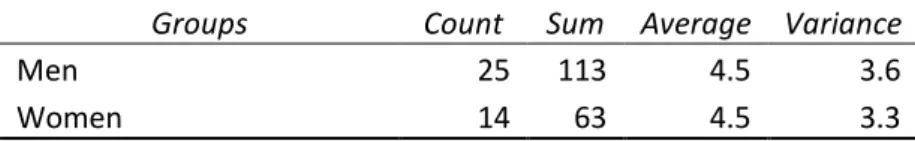
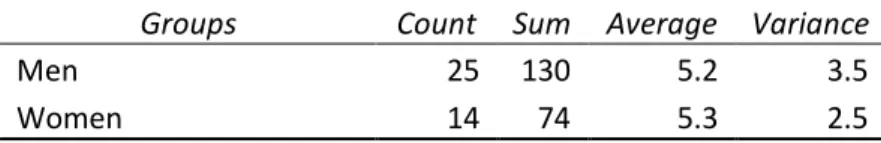
People were asked to rate the functions of Scene Creation and Scheduling on the 7-point Likert scale. It seems that between Men and Women, there are no significant differences between perceived functionality of the functions Scene Creation and Scheduling, averaging 4.5 by Men, 4.5 Women and 5.2 Men, 5.3 Women respectively. However, the Scheduling functions seem to be perceived as more useful than Scene Creation. The difference in perceived functionality in these two functions seems not to be gender-dependent but rather age-dependent see Table 2for an example, age group 51-64 rated
Scene Creation the lowest with an average score of 4 and age group 26-35 rated it the highest with an
average score of 5.6. 13 23 12 17 7 15 8 13 0 5 10 15 20 25 Women (N=14) Men (N=25)
What functions do you use?
ON/ OFF Dimming Scheduling Scene Creation
21
Table 1. Anova: single factor; Rating form 7-point Likert scale for scene creation sort by gender.
Anova: Single Factor (Scene Creation) SUMMARY
Groups Count Sum Average Variance
Men 25 113 4.5 3.6
Women 14 63 4.5 3.3
ANOVA
Source of Variation SS df MS F P-value F crit
Between Groups 0.0 1.0 0.0 0.0 1.0 4.1
Within Groups 129.7 37.0 3.5
Total 129.7 38.0
Table 2. Anova: single factor; Rating form 7-point Likert scale for scene creation sort by age-group.
Anova: Single Factor (Scene Creation) SUMMARY
Groups Count Sum Average Variance
18-25 10 41 4.1 3.2 26-35 7 39 5.6 1.3 36-50 15 68 4.5 3.8 51-64 7 28 4 4.7 65+ 0 0 #DIV/0! #DIV/0! ANOVA
Source of Variation SS df MS F P-value F crit
Between Groups 11.4 4.0 2.8 0.8 0.5 2.6
Within Groups 118.3 34.0 3.5
22
Table 3. Anova: single factor; Rating form 7-point Likert scale for scheduling sort by gender.
Anova: Single Factor (Scheduling) SUMMARY
Groups Count Sum Average Variance
Men 25 130 5.2 3.5
Women 14 74 5.3 2.5
ANOVA
Source of Variation SS df MS F P-value F crit
Between Groups 0.1 1.0 0.1 0.0 0.9 4.1
Within Groups 116.9 37.0 3.2
Total 116.9 38.0
Table 4. Anova: single factor; Rating form 7-point Likert scale for scheduling sort by age-group.
Anova: Single Factor (Scheduling) SUMMARY
Groups Count Sum Average Variance
18-25 10 41 4.1 3.9 26-35 7 41 5.9 1.1 36-50 15 81 5.4 3.1 51-64 7 41 5.9 2.1 65+ 0 0 #DIV/0! #DIV/0! ANOVA
Source of Variation SS df MS F P-value F crit
Between Groups 18.7 4.0 4.7 1.6 0.2 2.6
Within Groups 98.2 34.0 2.9
Total 116.9 38.0
4.2.1
Controls
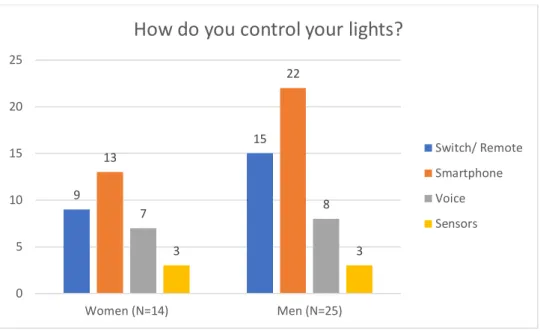
There are different ways to control the lights in SLS. Figure 9 below shows how the people participating in the survey control their lights. For Women, nine people use a Switch/ Remote, 13 people a
Smartphone, seven people by Voice and three use Sensors. For Men, 15 people use a Switch/ Remote,
23
Figure 9. Controls people use in SLS.
Figure 10 shows that people live in different sized homes and the number of people living there. Three people answered their home consists of one room with one person living there. 23 people are living in homes size two to four rooms, in which one person answered living by itself, 14 people living with two and 8 people three to five people in their home. For homes with five rooms or more, three people count two people in their home, six people three to five people and four people six or more.
Figure 10. The number of people per size of the household.
More people in the home means the possibility for more people to control the SLS. Figure 11 shows the number of people controlling SLS in the home. For one room-sized home, three people answered one person has control of SLS. For two to four room-sized homes three people answered one person has control, 17 answered two people have control and three answered three to five people. For homes with five or more rooms, four people answered one people controls the lights, five people answered two people, three people answered three to five and one people answered six people or more are in control. 9 15 13 22 7 8 3 3 0 5 10 15 20 25 Women (N=14) Men (N=25)
How do you control your lights?
Switch/ Remote Smartphone Voice Sensors 3 1 14 3 8 6 4 0 5 10 15 20 25
1 room (N=3) 2 till 4 rooms (N=23) 5+ rooms (N=13)
Number of people in the household
6+ people 3 till 5 people 2 people 1 person
24
Figure 11. The number of people in control of SLS.
4.3 Investment
There are several reasons why people invest in SLS, Figure 12 below shows the reasons why the people in this study choose to invest in SLS. For Women, one person answered Simplicity, four people
Functionality, four people Comfort, four people Excitement and one person had Other reasons. For
Men, two people answered Energy saving, 15 people Functionality, two people Comfort and six people
Excitement.
Figure 12. Reasons why people invest in SLS.
3 3 4 17 5 3 3 1 0 5 10 15 20 25
1 room (N=3) 2 till 4 rooms (N=23) 5+ rooms (N=13)
Number of people controling of the lights in the
household
6+ people 3 till 5 people 2 people 1 person 2 1 4 15 4 2 4 6 1 0 2 4 6 8 10 12 14 16 Women (N=14) Men (N=25)Reasons to invest in SLS
Energy saving Simplicity Functionality Comfort Exitement Other25
The housing tenure type varied for the people taking part in this study, the different housing types are displayed in Figure 13 below. For age-group 18-25 (N=10), two people live in an owner-occupied house and eight people in a rental apartment. In the age group 26-35 (N=7), three people live in owner-occupied apartments, two people in an owner-owner-occupied house and two people in a rental apartment. In age-group 36-50 (N=15), one person lives in an occupied apartment, ten people in an owner-occupied house and four people in a rental apartment. In age-group 51-64 (N=7), one person lives in an owner-occupied apartment and six people in an owner-occupied house.
Figure 13. Housing tenure type by age.
3 1 1 2 2 10 6 8 2 4 0 2 4 6 8 10 12 14 16 18-25 (N=10) 26-35 (N=7) 36-50 (N=15) 51-64 (N=7)
Housing tenure type
Rental apartment Owner-occupied house Owner-occupied apartment
26
4.4 Relationships
4.4.1
What is the main application of SLS in Swedish homes?
Figure 14 below shows the number of participants that have selected a category and this shows what was the most important factor in investing in SLS. The most important factor for investing in SLS was
Functionality over all age-groups.
Figure 14. Reasons why people invest in SLS by age-group.
In the age group 18-25 it seems that the driving factor for investing in SLS is Functionality for Men and we can see that for the three Women in this age-group one choose Functionality, one Comfort and one Excitement. In the age group 26-35, it seems that the driving factor for investing in SLS is
Functionality for men and Comfort for women. In the age group 36-50, it seems that the driving factor
for investing in SLS is Functionality for Men and for Women it is Excitement and Comfort. In the age group 51-64, it seems that the driving factor for investing in SLS is Functionality for Men and
Functionality and Other for Women. As with age groups 18-25, 26-35, and 36-50 approximately 40%.of
votes was towards functionality.
1 4 2 3 0 1 2 3 4 N um be r of pe op le (N =1 0)
Age-group 18-25
3 2 2 0 1 2 3Functionality Comfort Excitement
Number o f peo pl e ( N= 7)
Age-group 26-35
1 1 7 2 4 0 1 2 3 4 5 6 7 8 N umbe r of peopl e (N= 15 )Age-group 36-50
1 5 1 0 1 2 3 4 5Other Functionality Excitement
Number o f peo pl e ( N= 7)
Age-group 51-64
27
4.4.2
Wich characteristics of the SLS are sued and why are certain functions not
used?
Figure 15 shows the distribution of function being used by the type of housing tenure type. The most used function is Switch On/ Off, this is true for all of the different housing tenure types. Exceptions being for the owner-occupied apartment where Dimming is an equally common function.
Figure 15. How participants use function depending on the housing tenure type.
Figure 116 shows the distribution of functions being used when compared to the number of rooms in the home. The most used function is Switch On/ Off, this is true for all sizes of home. Exceptions being in the owner-occupied apartment where Dimming and Scene Creation is as frequently used.
Figure 16. How participants use function depending on the size of the home.
5 18 13 5 14 11 2 13 7 4 10 7 0 2 4 6 8 10 12 14 16 18 20 Owner-occupied apartment
Owner-occupied house Rental apartment
N umbe r of peopl e (N= 39 )
Housing tenure type
Usage of functions depending on housing tenure type
ON/ OFF Dimming Scheduling Scene Creation 2 23 11 2 21 7 1 11 10 2 12 7 0 5 10 15 20 25 1 2 - 4 5+ N umbe r of peopl e (N= 39 )
Number of rooms in the home
Usage of functions per number of rooms in the home
ON/ OFF
Dimming
Scheduling
28
As can be seen, there is no significant difference in what functions are being used in the housing tenure types compared with the size of the home. In total, this suggests the functions used the most seem to be Switch On/ Off that was shown in Figure 8.
Figure 17 shows the distribution of controls being used by the participants depending on the housing tenure type. The most used control is by using the Smartphone, this is true for all of the types of housing.
Figure 17. How participants control their light depending on the housing tenure type.
Figure 18 shows the distribution of controls being used when compared to the number of rooms in the home. The most used control is by using the Smartphone, this is true for homes greater than two rooms. For one-room homes, Switch/ Remote is the most common control.
Figure 18. How participants control their light depending on the size of the home.
3 14 7 5 19 11 1 9 5 4 2 0 2 4 6 8 10 12 14 16 18 20 Owner-occupied apartment
Owner-occupied house Rental apartment
N umbe r of peopl e (N= 39 )
Housing tenure type
Usage of controls depending on housing tenure type
Switch/ Remote Smartphone Voice Sensors 3 11 10 2 20 13 9 6 3 3 0 5 10 15 20 25 1 2 - 4 5+ N umbe r of peopl e (N= 39 )
Number of rooms in the home
Usage of controls per number of rooms in the home
Switch/ Remote Smartphone Voice Sensors
29
Looking at the data of the controls, we can see that the Smartphone seems to be the most common way of controlling the lighting. Furthermore, when comparing the type of home and the size of the home, the usages are similar.
Figure 19 shows the use of Scene Creation by different systems. Users of Philips Hue are the sample that uses this function the most and IKEA TRÅDFRI users the least.
Figure 19. Shows the majority of people using Scene Creation depending on their system.
Figure 20 shows the use of Scheduling with different systems. Users of Philips Hue are the sample that uses this function the most and IKEA TRÅDFRI users the least.
Figure 20. Shows the majority of people using Scheduling depending on their system.
3 3 3 12 4 2 10 2 0% 10% 20% 30% 40% 50% 60% 70% 80% 90% 100%
Other Multiple IKEA TRÅDFRI Philips Hue
P art ici pa nt s us ing
Distribution (%) using Scene Creation
Scene Creation YES Scene Creation NO
4 3 6 9 3 2 7 5 0% 10% 20% 30% 40% 50% 60% 70% 80% 90% 100%
Other Multiple IKEA TRÅDFRI Philips Hue
P art ic ipan ts us ing
Distribution (%) using Scheduling
30
5
Discussion
This chapter provides a discussion of the study’s results and method.
5.1 Result discussion
In the problem description, we suggest that more options can be overwhelming for SLS. Furthermore, during our review of the two systems IKEA TRÅDFRI and Philips Hue, we could see that Philips Hue offered a wider set of functions. This would imply that this system has a risk of causing users to feel startled. However, our results show the opposite. Philips Hue, in particular, has the highest usages of the functions Scene Creation and Scheduling, the users of Philips Hue also rated these functions the highest out of these two. That said, we cannot know if every participant is aware of all the functions provided in another system or if they have looked at other alternatives at all. Furthermore, from reviewing both Philips Hue and IKEA TRÅDFRI we have also seen that mentioned SLS handles these functions differently and this might also contribute to usage and perceived usefulness.
5.1.1
System
From the result section, it tells us that participants' systems are for the majority a mix of Conventional and Smart light sources. This may be due to several different factors such as the difference in price, that the technology is relatively new, or simply that the need for only Smart light sources does not exist. There is however a small number of six that only have Smart light sources, which can at least indicate that there is an interest in using the technology as the only means of home lighting. There, the results can also show that the majority (Figure 4) of those who buy the Smart Light Sources do so not only to replace broken light sources but to upgrade. This suggests that the aspects Smart light sources bring are of interest to the average homeowner.
From what can be discerned in the results of how the characteristics of the participants' systems are distributed over the different SLS there are on the market, there was an even distribution between Philips Hue and IKEA TRÅDFRI, with even a smaller group using other systems (Figure 6). This suggests that these systems are also the most appreciated systems among users in Sweden. There may be various factors that this is due to as the price difference is large, but also light properties such as colour choice may differ. However, these are two systems that have the same or similar choice of functions that indicate that this is what SLS users want at this moment in time.
5.1.2
Function
In understanding how the interaction between the users and SLS are, functions that participants are using play a big part. The majority of the participants used the functions ON/OFF and Dimming most frequently. These functions were already the basis for the conventional systems used and it can therefore not be perceived as surprising that these are the most used functions also in SLS. They are basic, familiar and easy, however, when looking at the controls when they use these functions, it sheds a light on those users of these systems have moved away from the simple switch to the Smartphone instead when controlling these functions (Figure 9). Which means that the way users prefer to use their Smartphone to control SLS is a difference for even its most basic functions.
The rating of the functions Scheduling and Scene creation indicates that the difference in perceived functionality in these two functions seems not to be gender-dependent but rather age-dependent (Table 2). Which indicates that the older segment of users might feel that it is too much of a hassle to use these functions, that they are not familiar with how they are used or how they can improve/ simplify their everyday life. This could be understood as Hargreaves et al (2018) previously described it as the familiarity with the controls is most likely the reason users interact with the system.
31
In the daily use of SLS, the control of the systems can look very different among its users, as factors such as the type of accommodation, the size and how many are allowed access to the control of the systems come into play. This can allow the systems to behave differently depending on whether people in the home have different personal preferences. From the results, it can be deduced that regardless of the size of the home, there are usually no more than two people who can control the system. On the other hand, in a few scenarios, it happens that as many as more than six people can be in control (Figure 11). That more people in the homes can have the possibility to control the light could, of course, be a good thing, but as these systems provide more functions it could easily be problematic to meet the personal preferences of all residents of the home.
5.1.3
Investment
There is not a typical gender user of the systems and it is likely probable that it will be used equally much by both, with Functionality for Men and Comfort for Women as key features. The mix of systems is also apparent in the use in Swedish homes and could be related to where the first introduction was met i.e knowledge of SLS took place and then bought. When the interest and further knowledgeability developed the curiosity of new systems and functionalities overcomes the hesitation to invest. This will broaden the number of integrated systems and suppliers used.
As Juric & Lindenmejer (2018) describe, there is some resistance to buying Smart lighting products from certain age groups. There is also said that the biggest reason for this is health concerns and pricing. Based on what we found in the results, instead, the biggest reason people invest in Smart lighting is the Functionality, Comfort and the Excitement factor the system provides. There may be a point made for Women to refute that health concerns are resistance to buying since they seem to invest in SLS to provide them with Comfort. Whereas Comfort could be described as a hedonic goal and aim to provide them wellbeing and feeling good with good lighting, which in turn could alleviate stress in every day living and be a big reason for investment in these systems (Lindenberg & Steg, 2007). For Men it is a majority who has picked Functionality, this means that the majority of Men chose to invest in SLS with gain goals, which means they would, in turn, look to get more out of their lighting than before in regards to functions. This shows that energy-saving, which Santamouris & Dascalaki (2002) and also DiLouie (2007) describes that these systems were initially developed for, is not the major reason why Swedish residents invest in SLS.
5.1.4
RQ1
– Main application of SLS in Swedish homes
The main application seems to need to have some kind of functionality as this seems to be why Swedish residents invest in SLS. This functionality looks to be applied by the Swedish resident in form of using either Philips Hue or IKEA trådfri to turn on/ off the lights using a smartphone. The smart light lighst sources connected to SLS coexists with conventional lights in the Swedish home. It seems SLS is most commonly applied in owner-occupied houses and there is generally a household with 2- 5 people with 2 people that take control of the lights.
The results answers the research question, what the main application of SLS in Swedish homes is. However, this focus is on the reason why the user initially invested in SLS and we never asked if this feeling has changed from continued usage.
5.1.5
RQ2
– Characteristics of SLS
The answers show that the majority of users have a clear preference to control their Smart lighting with their Smartphone and that the most frequently used function is Switch On/ Off.
To answer the question of why certain functions are not being used, we have reviewed the number of users ofthe function for the given system. We have then compared the number of users to the average
32
score taken out from the 7-Point Likert Scale. We suggest that a “higher” score >4 is related to the number of users. In other words, if the users believe the function is useful, they will likely use it. An attempt to investigate why certain functions are not being used has been done. We picked the two more advanced functions as we see it that is provided by SLS. We hoped that by combining the information of usage and the rating would give us the evidence we need to answer why the function is being used or not. Our idea was that a low score would tell us that this function is not being used. The data suggest that a higher average score leads to usage, but we can also see that some participants use the function even though they have rated it low.
5.2 Method discussion
As described in the method section, this is a quantitative study on the usage of Smart lighting systems in the home environment. The quantitative approach is based on the data collection required. Given that we needed to collect data from existing SLS users and get a big enough population to increase the validity, a quantitative study was a good approach within the time frame that we had. We had a goal set out to be able to make generalizations of the population of users with SLS, which meant that we needed to get a large number of answers. This would have been a hard target to reach with a qualitative approach since interviews at people’s homes would be time-consuming. Although the thought process from the planning start was that a mixed approach of quantitative and qualitative approaches was something we wanted to do. Because we wanted to get the general population while still exploring deeper what people thought about these systems after investing in them i.e.:
• What they enjoyed the most?
• How they are using certain functions? • What they would like to see in the future? • What they are missing from these systems?
These ideas were later scratched to make a more quantitatively focused study. Since we felt that to get a deeper understanding of how people use and integrate with SLS, we would have had to interview people at their home, do a longer-term experiment or a field study. Things that were not ideal at the timeframe when this study was taking place due to the Covid-19 pandemic.
5.2.1
Pro
’s
Since the purpose of our study was to investigate how Swedish residents use SLS at home. We did an online survey to investigate this and in doing this the biggest strengths were that we could reach a bigger sample. It was also easier to find this sample online then find the same sample size by reaching out to people in public. Moreover, another contributor to the sample size that we got can be explained by the length/ size of the survey, hence a short survey that is quick to fill out will not as likely intimidate participation and completion. One could argue that it is also more convenient for the participants to answer the survey online wherever they want, than having to take time to answer while having a different agenda. It also made it more convenient and reliable to record the data collected since this happened automated, then having to transcribe it from the datasheets, which in turn could have led to human errors when inputting the data collected.
Given the circumstances of the period when this study where conducted due to the Covid-19 pandemic throughout the world, it made it not ideal to collect data through meeting people in person for interviews. This was because of the social distancing that led to some early isolation and hesitance among people, by recommendations from the Swedish government to contain the spread of the virus. It made us choose to conduct a digital approach to the method of data collection, which meant that
33
we did an online survey to get participants. This worked out well in the end since our participation number almost met the goal to get 50 participants using SLS and we got 45 out of 114.
5.2.2
Con
’s
Since the study was implemented by using digital surveys, the reliability is lowered since we cannot guarantee that every participant was answering the survey just once and therefore might not be unique. This also meant that we were not able to track the background of every participant and tell want kind of self-knowledge they had beforehand. We don’t know what the participants' prior knowledge of working with these systems is, therefore we do not know if the participants just got it installed at home the same day. Another subject that lowered the reliability of the study was that the survey was not built with one specific well-known and proven survey-theory in mind, it used a mixed approach of theories that the authors thought would give better data to analyse.
34
6
Conclusions and recommendations
The study aimed to investigate if how Swedish residents use SLS at home. The questions for the study were then formulated according to;
1. What is the main application of SLS in Swedish homes?
The conclusions that can be drawn based on the study´s results, is that when it comes to how Swedish residents use SLS at home, the main application for SLS in Swedish homes is Functionality across all age groups and gender. However, Comfort is also a big contributor to Women.
2. Which characteristics of the SLS are used and why are certain functions not used?
Regarding characteristics, we have chosen to look at the user-interaction with SLS, how it is being controlled and what kind of functions are being used. We can see that the most common way of interacting with SLS in the home environment is by using the Smartphone. Though as discussed, SLS open for more advanced ways of controlling the lights. We can see that the simple control functions
Turn On/ Off and Dimming is still the most common way for most Swedish residents. A large group
also uses SLS to create schedules to allow their lights to Turn On/ Off, Dim or even change colour at a certain time.
6.1 Further studies
To get a greater understanding of the actual use of home Smart lighting it would be interesting to collect usage data within the home. To get a number of how frequently a function/ control has been used. It would have been interesting to know for how long they have used the SLS to relate it to how they have rated the functions. Open-ended questions could have given us a deeper understanding of what they think about the function and more specifically why they use it or not. This might have helped us get a better answer to why or why not certain functions might not be used. This means that a qualitative study with more in-depth interviews or field studies could be valuable in this field.
This can later be connected to AI and machine learning in order to ease the use of controls in the home. Something else that got to our mind is that it would be interesting to study what control systems/ panels are used and how they affect the behaviour of users of Smart lighting products. From our own experience, it is also likely that the use of control systems looks different in the home environment compared to the workplace. So, it would be interesting with a complimented study that investigates the use of lighting controls in the workplace compared to the home environment. This could be done over a longer period and at their specific place of usage to get a more reliable data collection of actual usage.