Recovery from
Acidification in the Natural Environment
REPORT 5034
isbn 91-620-5034-6
issn 0282-7298
Recovery from Acidification in
the Natural Environment
Present Knowledge and Future Scenarios
Acidification of air, soil and water has had highly
detrimental effects on Sweden’s ecosystems. Over the
last decade or so, however, emissions of acidifying
pollutants have decreased, and we now expect to see
signs of recovery in the natural environment. This
report is a summary and synthesis of the information
and knowledge currently available concerning the
nature of the recovery process that may be expected
to result from reduced atmospheric deposition of
acidifying compounds. It describes deposition trends,
soil chemical processes, the results of experimental
studies and environmental monitoring, and different
scenarios for the future. The report will, it is hoped,
provide a basis for environmental policy decisions and
measures.
REPORT 5034
Editors
Per Warfvinge
Ulla Bertills
Recovery from Acidification in
the Natural Environment
Present Knowledge and Future Scenarios
u
Editors
Per Warfvinge
Ulla Bertills
Environmental Assessment Department Environmental Impacts Section Contact: Ulla Bertills, telephone +46 8 698 15 02
The authors assume sole responsibility for the contents of this report, which therefore cannot be cited as representing the views of
the Swedish Environmental Protection Agency. The report has been submitted to external referees for review.
Production: Margot Wallin Translation: Martin Naylor
Cover photograph: Lake Stora Idegölen in the rain Photographer: Jan Schützer/N
Most of the illustrations in this report have been redrawn by Johan Wihlke
Photographs page 38: Per Warfvinge, page 50: Per Hörstedt Address for orders:
Swedish Environmental Protection Agency Customer Services
SE-106 48 Stockholm, Sweden Telephone: +46 8 698 12 00 Fax:+46 8 698 15 15 E-mail: kundtjanst@environ.se Internet: http://www.environ.se isbn 91-620-5034-6 issn 0282-7298
P
REFACEThis report is a summary and synthesis of the information and knowledge currently available concerning the nature of the recov-ery process that may be expected to result from reduced atmos-pheric deposition of acidifying compounds. It is one of the final reports on the project area Acidifying Substances and Tropospheric Ozone, which was established in 1993 as part of the research programme of the Swedish Environmental Protection Agency. Funding for the final phase of this research has been provided by the Swedish Foundation for Strategic Environmental Research (MISTRA).
A number of individuals, most of whom received research funding through the project area, have been involved in writing this report. It should be noted, though, that many of the results and much of the knowledge on which it is based stem from the efforts of fellow researchers beyond the immediate circle of the authors. We would like to emphasize our appreciation of the patient, long-term and high-quality work they have undertaken in this field.
The present report is intended for readers who already have some understanding of the causes and effects of acidification. The aim is that the synthesis of knowledge which it contains will provide a basis for measures, decisions and policies, while also laying a foundation for future research. For a more in-depth scientific discussion of the issues involved, we refer to the publications cited.
PER WARFVINGEAND ULLA BERTILLS
LUNDAND STOCKHOLM
C
ONTENTSEXECUTIVESUMMARY 6
1 INTRODUCTION 9
1.1 Acidification of soil and water 9
1.2 International agreements 10
1.3 Chemical and biological recovery 12
1.4 Gaps in current knowledge 13
1.5 Monitoring data, field experiments and models 14
2 DEPOSITIONTRENDSIN SWEDEN 15
2.1 Why, where and how is deposition measured? 15
2.2 pH of precipitation has risen 16
2.3 Sulphur deposition is decreasing 17
2.4 Only gradual decline in nitrogen deposition 18
2.5 What is happening to base cation deposition? 20
3 WHATPROCESSESGOVERNRECOVERY? 23
3.1 Reversible and irreversible soil processes 23
3.2 Studies of catchments and soil profiles 24
3.3 Ion exchange 25
3.4 Weathering 26
3.5 Sulphur fluxes in soil and water 27
3.5.1 Sulphate adsorption 28
3.5.2 Organic sulphur 29
3.5.3 Sulphide oxidation and bacterial sulphate reduction 29
3.6 Aquatic chemical equilibria – ANC and pH 30
3.7 Nutrient uptake and leaching of nitrogen 32
3.8 The importance of land use 33
3.9 Spatial variation within catchments 34
3.10 The dynamics of acidification and recovery 34
4 EXPERIMENTALSTUDIESIN SWEDEN 37
4.1 The Gårdsjön Roof Project 38
4.1.1 Why was the roof built? 41
4.1.2 Benefits and limitations of the roof project 41
4.1.3 Higher ANC and lower aluminium levels when deposition
decreases 42
4.1.4 Soil sulphur dynamics – important and uncertain 43
4.1.5 Base cations – concentrations falling despite lower acid deposition 46
4.1.6 Many questions still to be answered 47
4.2 Diatoms as a biological pH meter 49
4.2.1 Lake Örvattnet, Värmland 50
5 RECOVERYOFSURFACEWATERSANDFORESTSOILSIN SWEDEN 53
5.1 Recovery of lakes – indications in individual lakes 53
5.2 Trends in the water chemistry of the time series lakes 54
5.2.1 Sulphate concentrations falling 54
5.2.2 Slow rise in alkalinity and pH 55
5.3 National lake surveys 57
5.4 The Integrated Monitoring programme – recovery of catchments 58
5.5 Changes in soil chemistry – Survey of Forest Soils and Vegetation 59
5.5.1 How is the pH of forest soils changing? 60
5.5.2 How does growth affect changes in pH? 61
5.5.3 Exchangeable base cations, acidity and aluminium 63
5.6 How is chemical recovery affecting biota? 65
6 INTERNATIONALEXPERIENCE 67
6.1 Roof experiments within the EXMAN project 68
6.2 The RAIN project 69
6.3 Studies in the Netherlands 71
6.4 Sudbury, Canada 71
6.5 Monitoring programmes under CLRTAP 72
7 PROSPECTSFORTHEFUTURE 74
7.1 Future deposition trends 74
7.2 Interpretation of the roof experiment – modelling 78
7.3 Modelling of forest sites in southern Sweden 80
7.4 Regional assessments 82
8 SYNTHESIS 85
8.1 What do we know? 85
8.2 What do we believe? 87
8.3 What problems lie ahead? 87
8.4 What knowledge gaps remain? 89
8.5 Concluding remarks 90
9 REFERENCES 91
E
XECUTIVE
SUMMARY
A
cidification of air, soil and water has had highly detrimental effects onthe environment of Europe and North America. In Sweden, the eco-logical value of many lakes, rivers and streams has been greatly under-mined, and vital nutrients have been leached from forest soils. Cultural assets such as rock carvings and architectural features have been affected. Over the last decade or so, however, emissions of acidifying pollutants have decreased. It is hoped, therefore, that the natural environment will recover, to a state similar to that prevailing before the acidification of the past century.
International negotiations to reduce pollutant emissions in Europe and North America have taken place under the Convention on Long-Range Transboundary Air Pollution (CLRTAP). The 1994 protocol now in force is based on the principle that the difference between current sulphur deposition levels and critical loads must be reduced by 60%. In December 1999 a ‘multi-effect, multi-pollutant’ protocol was signed. This agree-ment lays down new emission ceilings for sulphur dioxide, nitrogen ox-ides, ammonia and volatile organic compounds (VOCs). Within the Euro-pean Union, the Commission has drawn up an Acidification Strategy which includes several proposals for directives aimed at achieving substan-tial emission reductions.
Recovery from acidifying deposition comprises both a chemical and a biological component. Chemical recovery means that certain critical chemical variables return to an original state, for example pH values rise and aluminium concentrations in surface waters fall. In aquatic environ-ments, biological recovery occurs when key organisms have resumed their role in the ecological system by re-establishing viable populations; the organisms concerned may for instance be zooplankton, benthic animals or a characteristic fish population.
At the end of the 1980s, the average pH of precipitation in the southern Swedish county of Blekinge was between 4.0 and 4.2. By 1997, the figure had risen to 4.5. Roughly the same trend has been observed in other parts of southern and central Sweden.
Atmospheric deposition of sulphur has decreased considerably, while deposition of nitrogen has exhibited relatively little change since 1990. Deposition of sulphate-sulphur in bulk precipitation has fallen by 30%;
deposition to spruce forests (in throughfall) has on average shown a larger decrease, of about 45%. The downward trend in sulphur deposition is rela-tively strong, and similar throughout Sweden. Emissions of nitrogen in Sweden and the rest of Europe have not abated to the same extent as sulphur emissions in recent years, which explains the differing deposition trends.
Acidification and recovery from acidification are processes which ex-tend over many decades. The time-scale is governed primarily by chemical processes in the soil, such as chemical weathering, cation exchange and sulphate adsorption. The most important surface water parameter in bio-logical terms, pH, is determined by aquatic chemical equilibria. As deposi-tion falls, soils will tend to bind base cadeposi-tions and release sulphate, delaying recovery. The risk of forest soils generally beginning to leach nitrogen in the form of nitrate, which would have an acidifying effect, is small.
In Sweden, recovery has been investigated experimentally in the Gårdsjön Roof Project and through palaeolimnological studies. In the Lake Gårdsjön area, a roof was built over a 0.6 ha catchment and polluted precipitation was replaced with water corresponding to natural rain and snow. After 7 years of this experimental treatment, concentrations of sul-phate, inorganic aluminium and base cations in runoff have fallen by 50– 60%. The buffering capacity (acid neutralizing capacity, ANC) of runoff has increased at the same rate as aluminium levels have fallen. There has been only an insignificant rise in pH, as the increased buffering capacity of the water has served to reduce the concentration of aluminium.
A palaeolimnological study of Lake Örvattnet in Värmland has shown how chemical recovery, from pH 4.7 to 4.9, has coincided with biological recovery, e.g. of the lake’s perch population.
According to a study of the water chemistry of the ‘time series lakes’, which are sampled regularly, sulphate concentrations in these lakes have
fallen by around 2 µeq/l/yr since 1983. Concentrations of base cations
have also declined, limiting the increase in buffering capacity (measured as ANC). In most of the lakes that have had positive alkalinity, alkalinity has increased since the beginning of the 1980s. The general picture remains the same, whether the data are drawn from studies of the time series lakes, lakes included in national surveys, small streams covered by the Integrated Monitoring programme, or studies outside Sweden. There are clear signs of recovery even in areas where critical acid loads are still exceeded. Over a 10-year period, the median pH of the time series lakes increased by 0.1 units.
Analyses of soil chemistry carried out as part of the National Survey of Forest Soils and Vegetation have shown that the pH of forest soils fell by
an average of 0.1 units between the mid-1980s and the mid-1990s. The decrease was particularly marked in inland areas of southern Sweden, north-west central Sweden and Västerbotten. In the B horizon of the min-eral soil, concentrations of exchangeable magnesium fell and concentra-tions of exchangeable aluminium rose throughout the country. Since more recent data are not available, we do not know whether soil acidifica-tion has been halted in the last 4–6 years, following the substantial reduc-tion in sulphur deposireduc-tion.
Future levels of acid deposition are dependent on what undertakings the countries of Europe make within the EU and CLRTAP. Several differ-ent future deposition scenarios are therefore conceivable. By 2010, sul-phur deposition is expected to be 65–75% lower than in 1990. The reduc-tion of nitrate-nitrogen will be 50–60%, while deposireduc-tion of ammonium-nitrogen will decrease by only about 15%. Compared with 1980, the reduction in sulphur deposition will be 80–85%. The largest relative de-creases in sulphur and nitrate-nitrogen will occur in the southern counties of Sweden.
A simulation of the recovery process in the Gårdsjön roof experiment suggests that sulphate concentrations in runoff will stabilize within the next 20 years. Runoff concentrations of base cations will continue to de-cline, as will levels of inorganic aluminium. Even after 30 years with no acidifying deposition, however, aluminium concentrations will still be ele-vated and ANC will remain below 0, although the pH will have risen somewhat. Modelling of developments at 17 forest sites in southern Swe-den shows that the base saturation of the soil will not be restored, and that ANC will not reach estimated pre-industrial levels at any of the sites con-cerned. The most marked recovery in terms of pH and ANC will occur in soils with relatively high buffering capacities and high weathering rates. Modelling of 147 sites included in the National Survey of Forest Soils and Vegetation reinforces the picture of very slow recovery of the soil system, and shows that acidification is not entirely reversible, even over a period of 50 years. The results of these model calculations are particularly discour-aging when it comes to the most sensitive and most severely acidified areas.
The report underlines the importance of environmental monitoring and experimental scientific research being guided by a long-term view, with the aim of further enhancing our understanding of recovery pro-cesses.
1. I
NTRODUCTION
PER WARFVINGEAND RICHARD F. WRIGHT
Acidification of air, soil and water has had highly detrimental effects on ecosystems across Europe and caused extensive damage to cultural assets and materials. After about a decade of decreasing emissions of acidifying pollutants, we now expect the natural environment to recover and con-ditions similar to those prevailing prior to the acidification of the past century to be achieved within a reasonable period of time.
The favourable developments now being seen are the result of abate-ment measures brought about in the framework of international environ-mental conventions. To achieve the long-term aim of sustainable develop-ment, deposition of acidifying compounds must be reduced to critical load levels.
1.1 A
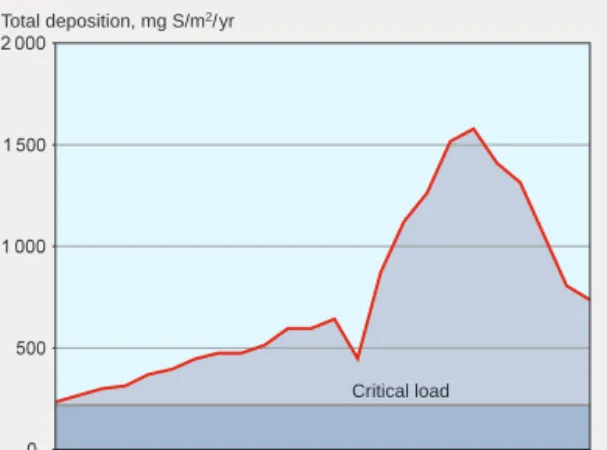
CIDIFICATIONOF SOIL AND WATERSince the industrial revolution of the 19th century, emissions of acidifying pollutants have risen very substantially. The pollutants concerned are sul-phur and nitrogen compounds, arising from the burning of fossil fuels, extraction of metals from ores and a wide range of other industrial activi-ties. The historical development of atmospheric deposition of sulphur closely mirrors the expansion of industrialism (figure 1).
Acidifying pollutants disperse via the atmos-phere and return to the earth’s surface by deposi-tion, in the form of gases or airborne particles or dissolved in rain or snow, far away from their emis-sion sources. Over large areas of northern and cen-tral Europe and eastern North America, many decades of acid deposition have caused extensive damage to the
environ-Figure 1. Estimated levels of sulphur deposition in an area of Småland, southern Sweden, 1880–1995. After Mylona 1993.
Total deposition, mg S/m2/yr
ment. Thousands of lakes, rivers and streams have suffered damage to their ecosystems; above all, populations of salmonids have been lost. Acidification of forest soils has resulted in losses of mineral nutrients, and in chemical conditions in the soil which could have adverse effects on the forests growing there. In addition, high concentrations of acidifying com-pounds, combined with oxidizing substances, have caused widespread damage to buildings and other structures.
As a result of its geographical location and its natural susceptibility, Swe-den is one of the countries of Europe where the ecological damage arising from acid deposition has been most apparent and most serious. Because of this, together with the fact that 80–90% of the acidic deposition to which Sweden is exposed originates beyond its borders, the country has since the 1970s pursued a very active policy aimed at reducing emissions. It has pressed for far-reaching undertakings by the states of Europe, invested heavily in research on acidification, and allocated billions of kronor to direct measures such as liming of lakes and watercourses.
Acidification of soil and water is a complex phenomenon. On a very long time-scale, for example since the last ice age, it is a natural process. Natural acidification is caused by such factors as a gradual decrease in the rate of weathering of soil minerals. However, as more and more land has been brought into cultivation over the last one thousand years, the pH of many southern Swedish lakes appears to have risen (Renberg et al. 1993a, 1993b), probably as a result of swidden (slash-and-burn) agriculture and other land use.
Around the turn of the century, acidification accelerated as a conse-quence of acid deposition. This factor has had many times the effect of natural acidification, and has more than offset the effect of agriculture. As a result of this ‘recent acidification’, therefore, soils in many areas have effectively aged by thousands of years in the course of a single century. Acid deposition has consumed the buffering capacity of the soil. This has manifested itself first of all in heavy leaching of mineral nutrients from the soil, and subsequently in falling pH and elevated aluminium concentra-tions in lakes and running waters. Leaching of aluminium is the direct reason why several sensitive plant and animal species have disappeared from acidified waters.
1.2 I
NTERNATIONAL AGREEMENTSThanks to national and international efforts, there has now been a marked decrease in acid deposition. The highest levels of deposition occurred
some time in the 1970s or early 1980s. Since then, deposition of sulphur has fallen by more than half.
In the last few decades, considerable energy has been devoted to redu-cing atmospheric emissions of acidifying compounds. International nego-tiations on emission reductions in Europe and North America have been conducted under the Convention on Long-Range Transboundary Air Pollution (CLRTAP). The first result of these negotiations was a protocol entered into in 1985, in which the signatory states pledged a 30% cut in sulphur emissions by 1993, compared with 1980 levels. A second protocol on sulphur was signed in 1994. If the undertakings made in that agree-ment are honoured, emissions in Europe could be halved by the year 2000, from 1980 levels. The 1994 protocol is based on the principle that the difference between current sulphur deposition levels and critical loads must be reduced by 60%.
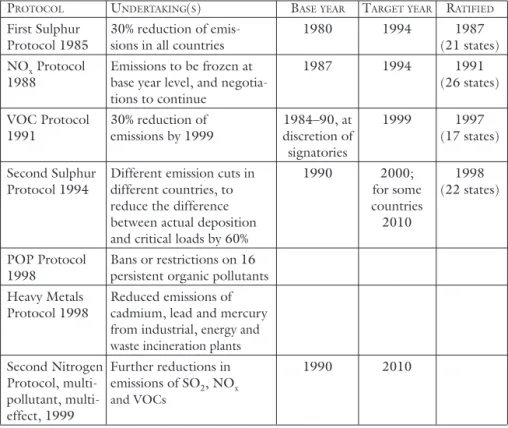
A summary of the agreements entered into under CLRTAP is presented in table 1.
Table 1. Summary of agreements reached under the Convention on Long-Range Transboundary Air Pollution (CLRTAP).
PROTOCOL UNDERTAKING(S) BASEYEAR TARGETYEAR RATIFIED
First Sulphur 30% reduction of emis- 1980 1994 1987 Protocol 1985 sions in all countries (21 states) NOx Protocol Emissions to be frozen at 1987 1994 1991 1988 base year level, and negotia- (26 states)
tions to continue
VOC Protocol 30% reduction of 1984–90, at 1999 1997 1991 emissions by 1999 discretion of (17 states)
signatories
Second Sulphur Different emission cuts in 1990 2000; 1998 Protocol 1994 different countries, to for some (22 states)
reduce the difference countries between actual deposition 2010 and critical loads by 60%
POP Protocol Bans or restrictions on 16 1998 persistent organic pollutants Heavy Metals Reduced emissions of Protocol 1998 cadmium, lead and mercury
from industrial, energy and waste incineration plants
Second Nitrogen Further reductions in 1990 2010 Protocol, multi- emissions of SO2, NOx
pollutant, multi- and VOCs effect, 1999
Work is also in progress in the CLRTAP framework to reduce emissions
of oxidized nitrogen, NOx. An initial agreement to freeze NOx emissions
at 1987 levels by 1994 was reached in 1988. In 1999, a ‘multi-effect, multi-pollutant’ protocol was signed in Göteborg. This agreement defines emission ceilings for sulphur dioxide, nitrogen oxides, ammonia and vola-tile organic compounds (VOCs).
Within the European Union, an Acidification Strategy has been devel-oped and a proposal has been put forward for a directive on national emis-sion ceilings for the air pollutants mentioned above.
The primary aim of these agreements is to slow the pace of acidification and, in the long term, to reduce deposition to, and preferably below, the relevant critical loads. Only when these levels have been reached can a gradual return to natural chemical conditions be expected (Lövblad & Bertills 2000).
1.3 C
HEMICAL AND BIOLOGICAL RECOVERYWhat, then, is meant by ‘recovery’? We distinguish in this report between
chemical recovery and biological recovery.
The term chemical recovery refers to abiotic processes – usually in the soil system – which influence biological recovery. The chemical aspect of recovery is sometimes referred to as reversibility or reversal (see for exam-ple Dise et al. 1994). Chemical recovery does not necessarily mean that all chemical variables return to their original values. In acidified soil systems, it may involve an increase in the pool of base cations (calcium, magnesium and potassium) present in the soil. In lakes and running waters, recovery occurs if the pH rises and aluminium levels fall, for example. These changes are strongly linked to an increase in the acid neutralizing capacity (ANC) of the water.
The term biological recovery relates to biotic processes. (Some writers refer to this simply as recovery; see Dise et al. 1994.) In aquatic environ-ments, biological recovery occurs when a number of key organisms have resumed their role in the ecological system by re-establishing viable populations (Dise et al. 1998). Key organisms in standing and running waters may consist of sensitive phytoplankton, zooplankton, benthic ani-mals or a characteristic fish population.
A prior condition for the biological recovery of a lake or stream is that chemical recovery has begun. How quickly organisms return then de-pends on their rate of reproduction, but above all on their powers of dis-persal. An aquatic system in which acidification has not progressed very
far, and in which small populations of the original organisms still remain, is better placed to recover in biological terms when its chemical status im-proves. In severely damaged freshwater systems, organisms with a strong dispersal ability are expected to be the first to return.
Just as acidification has been a protracted process, so it will take a long time for the beneficial effects of reduced deposition to become evident in lakes and watercourses. The critical chemical processes occur in the soil, since virtually all air pollutants are transferred to and pass through the soils of catchment areas before entering surface waters. Depending on the cir-cumstances, it will subsequently take varying periods of time for ecological communities to re-establish themselves; in certain cases, important species may have to be reintroduced.
1.4 G
APS IN CURRENT KNOWLEDGEAlthough deposition, particularly of acidifying sulphur, has decreased, many important questions still need to be answered. These include: • Will we actually achieve chemical recovery within a reasonable time on
the basis of the agreed deposition reductions, and in which areas will it be most rapid?
• Assuming that chemical recovery does take place, how will ecological communities develop?
• How should Sweden’s lake liming programme be designed in the future, as recovery progresses?
• Is it necessary to begin large-scale liming of soils in order to prevent further soil acidification, speed up the recovery process and protect sur-face waters?
• Will increased extraction of biomass for energy purposes affect recovery, and is it compatible with agreed environmental quality objectives? • Does the nature of the recovery process mean that Sweden should in any
way modify its line of reasoning and its negotiating position in interna-tional efforts to reduce air pollution?
• What economic costs to society will acidification entail in the future? Three different approaches can serve to shed light on the recovery process: analysis of time series of chemical and biological data, experiments involv-ing radical reductions of deposition, and mathematical modellinvolv-ing. All of these approaches have been used by Swedish acidification researchers.
1.5 M
ONITORING DATA,
FIELD EXPERIMENTSAND MODELSThe empirical data obtained from environmental monitoring in Sweden include measurements of water chemistry from around a hundred lakes and watercourses. These measurements have been performed since the beginning of the 1980s, and therefore we lack data from the actual acidifi-cation phase, which makes the interpretation of any trends more difficult. However, analyses of diatom remains in lake sediments provide informa-tion about when and to what extent lakes have been acidified. Diatoms are also important when it comes to tracking biological recovery, since they are expected to show a rapid response in terms of species composition when the chemical status of surface waters improves. Evidence of changes in soil chemistry is provided by the National Survey of Forest Soils and Vegetation (Ståndortskarteringen), in which soil chemical parameters are measured at some 2000 sites around the country. To date, conditions at each site have been recorded twice, in the 1980s and the 1990s. Measure-ments of deposition, carried out through regional, national and interna-tional networks, are of course another key source of data. In Sweden, monitoring of deposition chemistry began as early as 1955.
Experimental studies include the important roof project in the Lake Gårdsjön catchment, near the west coast. This is an example of a large-scale experimental manipulation involving very substantial reductions of sulphur and nitrogen deposition. Similar studies have previously been con-ducted in several parts of Europe, but the Gårdsjön project is one of the few covered catchment experiments still in progress.
Acidification models have been used to shed light on the chemical re-covery that may be expected in soils and waters under different scenarios of sulphur and nitrogen deposition. Similar biogeochemical models have served as a tool in the estimation of critical loads of acidifying compounds, which have in turn provided a scientific basis for international negotiations under CLRTAP.
Each of these approaches has its limitations. However, a combination of controlled experiments, regional databases and mathematical forecasting tools offers the greatest potential for answering the questions set out above. This report presents the results of a number of studies, most of them funded by the Swedish Environmental Protection Agency. Its aim is to elucidate the recovery process, but also to document Swedish research in this area and to set it in its international context.
2. D
EPOSITION
TRENDS
IN
S
WEDEN
OLLE WESTLINGAND GUN LÖVBLAD
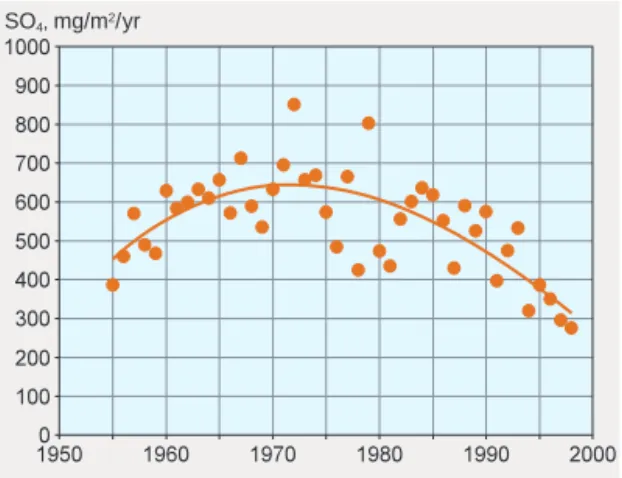
As a result of the industrial revolution, atmospheric deposition of sulphur increased as early as the closing decades of the 19th century. This increase accelerated after the Second World War, primarily owing to a sharp rise in the combustion of oil. Deposition peaked in the 1970s, and is expected to have fallen considerably by the year 2010 as a result of emission reductions achieved on the basis of international agreements. Emissions of nitrogen from fossil fuel use increased at a later stage than those of sulphur, as a consequence of growth in road transport. Deposition of nitrogen oxides culminated around 1990, and a slight decline can now be seen. Nitrogen deposition resulting from agricultural emissions of ammonia reached its highest level in the middle of the 20th century and has since decreased. These deposition trends are illustrated by figure 2, which shows wet depo-sition of sulphate at a monitoring station in southern central Sweden.
2.1 W
HY,
WHERE AND HOW ISDEPOSITION MEASURED?
The purpose of deposition measurements is to quantify pollutant loadings both to open sites, such as land with low vegetation and lake surfaces (bulk, or wet deposition), and to forests (throughfall, reflecting total deposition).
SO4, mg/m2/yr
Figure 2. Wet deposition of sulphate in southern central Sweden. Unpublished data from Department of Meteorology, Stockholm University.
The data thus collected can show whether the emission reductions decided on in Europe are in fact leading to lower levels of deposition, and also pro-vide a basis for modelling. Models can be used to predict deposition trends over the next few decades, on the basis of expected future emissions of air pollutants across Europe. For this purpose, the ‘EMEP model’ is used.
In Sweden, wet deposition has been measured since the mid-1950s, but to date total deposition has only been monitored over a 10-year period. In recent years, deposition measurements have been performed at more than a hundred sites in Sweden, using methods that are employed throughout Europe. These measurements are carried out by the Swedish Environmen-tal Research Institute (IVL) on behalf of the EnvironmenEnvironmen-tal Protection Agency, county administrative boards and local authorities. In addition, the results are reported to European databases. Monitoring has been in progress for varying periods of time, but for several counties relatively long runs of data are available, showing trends over at least 10 years (Hallgren Larsson et al. 1995).
Studies of pollutants in precipitation in open countryside primarily pro-vide information about the wet component of deposition, incorporated in rain and snow. Deposition to forests is measured by means of studies of throughfall at permanent sample plots in representative forest stands. Throughfall contains both the wet and the dry components of deposition and thus indicates the total atmospheric loading of substances, such as sulphate-sulphur, sodium and chloride, which are not affected by pro-cesses in the forest canopy. Concentrations of nutrients such as nitrogen, calcium, potassium and manganese increase or decrease in throughfall as a result of uptake, leaching or transformation on the surfaces of needles or leaves.
2.2
PH
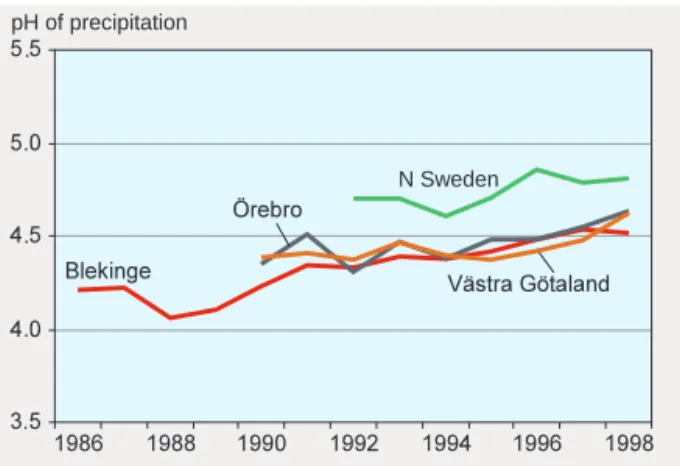
OF PRECIPITATION HASRISENOne of the early signs of acidification was low pH values in precipitation. For several years in the late 1980s, the average pH of bulk precipitation at a number of monitoring stations in Blekinge in the south of Sweden was between 4.0 and 4.2 (figure 3). Even lower pH values, below 4.0, were recorded in throughfall over a period of several years. In the early 1990s, measurement programmes were started in many parts of the country, and, with some variations between years, the pH of precipitation has generally risen. In the far north of Sweden pH values were higher than elsewhere when measurements began, and the same trend has subsequently been observed there as in central and southern Sweden.
2.3 S
ULPHUR DEPOSITIONIS DECREASINGThe principal reason why precipitation and throughfall pH are rising is that European sulphur emissions have been reduced. In the county of Blekinge, for which the longest run of data is available, average deposition to spruce forests dropped from over 20 kg/ha/yr to around 8 kg/ha/yr between 1988 and 1998 (figure 4). Deposition of anthropogenic sulphur to forests has fallen in the other counties/regions included in figure 4, too.
In northern Sweden, where deposition was low to begin with, only a slight decrease has been observed. The data presented do not include the natural sulphur in deposition, from marine salts. In southern and central areas of the country, it is above all the dry component of deposition, in the form of gases and particles, that has abated. On sites where wet deposition predominates, a smaller reduction has occurred.
. . . . . pH of precipitation N Sweden N Sweden SO4-S*, kg/ha/yr Figure 3. Annual mean pH of precipitation (volume-weighted) at open sites in different counties/regions: Blekinge (South-east Sweden), Örebro (Central Sweden), Northern Sweden, Västra Götaland (South-west Sweden). Data: IVL.
Figure 4. Deposition of anthropogenic sulphur to forest sites in different counties/regions. Data: IVL.
In the counties of Blekinge and Västra Götaland, the differ-ence between sulphur deposition to forests and to open sites in the late 1980s was sub-stantial, owing to the large quantities of dry deposition intercepted by trees. Figure 5 shows sulphur deposition in Blekinge, where there is a clear trend in deposi-tion to forests.
The temporary increase in 1994 was a result of the special weather conditions prevailing that winter, which gave rise to a large influx of particulate pollutants into eastern Sweden from neighbouring countries in the southern Baltic Sea region.
The trend for bulk deposition of sulphur is not as clear, since it is influ-enced more by between-year differences in precipitation.
Deposition of sulphur still exceeds critical loads over much of Sweden, despite the substantial decrease (Warfvinge & Sverdrup 1995). In the south of the country, the target level is exceeded by a factor of between two and four. In large areas of central and northern Sweden, deposition is currently close to the critical load. Northern areas, however, face particu-lar problems after the spring snowmelt, when the particu-large quantities of pre-cipitation accumulated during the winter can give rise to short-term acid surges in streams and rivers, despite moderate annual deposition.
Table 2 shows how sulphate-sulphur concentrations in bulk precipita-tion and sulphur deposiprecipita-tion to spruce forests have changed in different parts of the country since 1990.
2.4 O
NLY GRADUALDECLINE INNITROGEN DEPOSITIONEmissions of nitrogen in Sweden and the rest of Europe have not fallen by as much as sulphur emissions in recent years; in Sweden, the decrease be-tween 1980 and 1997 was 30%. This is reflected in a relatively small de-cline in deposition of nitrogen in the last few years. Trends may be partly masked by year-to-year variations, due primarily to fluctuations in the
SO4-S*, kg/ha/yr
Forests
Open sites
Figure 5. Deposition of anthropogenic sulphur to forests and open sites in Blekinge. Data: IVL.
weather. Deposition of nitrogen to forests is difficult to measure, since nitrogen is transformed and taken up by trees before it can pass through the forest canopy. The highest levels of nitrogen deposition in Sweden are found in parts of Halland and Skåne in the south, often exceeding 10 kg/ ha/yr on open sites and 15 kg/ha/yr in forests. Over much of northern Sweden, deposition is less than 3 kg/ha/yr. Nitrogen deposition has both a fertilizing and an acidifying effect, depending on to what extent and in what forms it is taken up by organisms in the ecosystems concerned.
Table 2. Estimates of trends in sulphate-sulphur concentrations in bulk pre-cipitation (open sites) and sulphur deposition to spruce forests, for different counties where measurements were performed between 1990 and 1997. Esti-mated concentrations and depositions are based on the linear regression cal-culated for the period from the reference year 1990 to 1997. The correlation coefficient (r) expresses the strength of the association between the number of years after 1990 and the change in the concentration or deposition.
SULPHURCONCENTRATIONINBULKPRECIPITATION
mg/l, estimated Reduction COUNTY 1990 1997 % r Skåne 1.11 0.72 35 % -0.783 Blekinge 1.05 0.76 28 % -0.675 Jönköping 0.95 0.55 42 % -0.903 Västra Götaland 0.87 0.66 24 % -0.765 Kronoberg 0.84 0.58 32 % -0.838 Örebro 0.93 0.64 32 % -0.887 Östergötland 0.97 0.53 46 % -0.850 Södermanland 0.86 0.64 25 % -0.849 Värmland 0.79 0.51 36 % -0.858 4 counties in northern Sweden 0.53 0.35 34 % -0.848 TOTALDEPOSITIONOFSULPHUR, SPRUCEFORESTS
kg/ha, estimated Reduction
COUNTY 1990 1997 % r Skåne 19.2 10.7 44 % -0.792 Blekinge 16.1 8.9 45 % -0.780 Jönköping 15.3 6.9 55 % -0.963 Västra Götaland 14.6 7.6 48 % -0.966 Kronoberg 11.2 7.3 35 % -0.766 Örebro 9.8 3.2 67 % -0.869 Östergötland 9.8 5.3 45 % -0.649 Södermanland 9.2 5.0 45 % -0.709 Värmland 8.0 4.1 48 % -0.940 4 counties in northern Sweden 3.9 1.8 54 % -0.907
Figure 6 shows average deposition of nitrogen in throughfall in spruce forests and in precipitation at open sites in Skåne. In areas with heavy deposition, there is often more nitrogen in throughfall than in precipita-tion, owing to high levels of dry deposition and relatively limited uptake and transformation. As the diagram makes clear, the difference between forests and open sites varies widely from one year to another, but there is a clear downward trend in deposition. In 1998, however, precipitation was around 50% higher than normal, which explains the high level of deposi-tion to open sites.
2.5 W
HAT ISHAPPENING TO BASE CATIONDEPOSITION?
Atmospheric deposition of base cations is another important element in the process of acidification and recovery. These ions have both natural and anthropogenic origins. Natural sources include marine salts, dust and bio-genic aerosols (e.g. pollen), while important anthropobio-genic sources are the burning of wood and coal and certain industrial processes (Lövblad et
al. 2000).
Atmospheric deposition and weathering are the only mechanisms which offset the leaching of base cations from soils that is caused by acid deposi-tion. Base cations can also play a direct neutralizing role if they are associ-ated with alkaline anions such as carbonate or hydroxide.
Deposition of base cations is generally difficult to estimate, and varies widely from one site to another. Deposition of marine salts, for example, shows a strong gradient from coastal to inland areas. The base cations produced by combustion and industrial processes are associated with par-ticles of varying size, which have shorter or longer lifetimes in the atmos-phere. In the vicinity of emission sources, elevated deposition of base
cat-Forests
Open sites Nitrate-N, kg/ha/yr
Figure 6. Deposition of nitrate-nitrogen to forests (as throughfall) and to open sites (bulk precipitation) in Skåne. Data: IVL.
ions is observed, often combined with high pH. This local effect further complicates the task of mapping deposition over large areas in a way that is reasonably representative of the ecosystems concerned.
Existing monitoring networks only measure wet deposition of base cat-ions. Estimates of deposition trends can be made by reviewing these meas-urements and studying how emissions have varied over time.
As industry has developed over the past century, emissions and deposi-tion of base cadeposi-tions have changed considerably (figure 7).
Even before the industrial era, some deposition of base cations occurred as a result of small-scale burning of wood. The scale of this deposition is difficult to estimate, since there were probably substantial local and sea-sonal variations in atmospheric emissions. With the installation of equip-ment to control particulate emissions at many sources from the mid-1970s on, in Sweden as in the rest of western Europe, and with more widespread use of oil instead of fuels such as coal and wood, which give rise to alkaline ash, emissions and deposition of base cations were reduced along with those of other pollutants. Such reductions were observed both in Sweden and in other parts of Europe, primarily in the 1970s and 1980s (Hedin et
al. 1994).
A further decline in base cation deposition has been noted in some parts of Europe (Germany, the Netherlands and Finland) since 1990. This is assumed to be due to the closure of combustion plants and factories in the
Thousands of tonnes
eq)
Figure 7. Total annual emissions of sulphur dioxide, nitrogen oxides, alkaline dust and ammonia in Sweden, 1900–1990. After Kindbom et al. 1993.
wake of the economic changes in eastern Europe. As yet, no such trend has been observed in monitoring data from Sweden. Any trend that does exist will be revealed by the trend study of Swedish environmental moni-toring results currently in progress.
As far as forest soils are concerned, a decline in base cation deposition means that the rate of recovery will be slowed somewhat, though not to such an extent as to offset the beneficial effects of the abatement measures introduced.
3. W
HAT
PROCESSES
GOVERN
RECOVERY
?
PER WARFVINGE,
MAGNUS MÖRTHAND FILIP MOLDAN
3.1 R
EVERSIBLE AND IRREVERSIBLESOIL PROCESSESA host of different processes, substances and phases in the soil interact to determine how critical soil and surface water variables such as pH and concentrations of base cations and aluminium are affected by atmospheric deposition of acidifying compounds. The parameters influencing these quantities vary widely from one area to another. This means that any given chemical or physical process will assume differing importance in different ecosystems, even though it operates in fundamentally the same way in every ecosystem. This variability is one of the reasons why it is very diffi-cult to assess the prospects of recovery from acidification in any particular area.
In order to analyse and explain how soil and water undergo and recover from acidification, it is important not only to study the responses of entire ecosystems to reduced levels of deposition, but also to investigate the chemical, biological and geochemical processes that take place in the soil. Without a grasp of the individual processes involved, it is impossible to gain the understanding needed to assess the future prospects of recovery, assuming different deposition rates, land use scenarios etc.
Soil processes can be reversible or irreversible, rapid or slow, and may be governed to a greater or lesser degree by biological factors.
Reversible processes include mechanisms buffering against changes in pH. If the input of acidifying compounds increases, cation exchange and sulphate adsorption in the soil, for example, will initially make a positive contribution to the buffering capacity of the soil solution and surface waters. This will counteract the pH-lowering effects of the acid deposi-tion. If the pollutant loading is reduced, such reversible processes will slow down recovery by offsetting the effects of the decrease in deposition.
Of the irreversible processes, chemical weathering is particularly impor-tant. This process always increases the buffering capacity and base cation concentrations of soil water. The rate of weathering depends on a wide range of chemical, geological and biological factors, and can vary
enor-mously from one area to another. This variation is due to, among other things, differences in temperature and in the mineral composition of the soil.
These reversible and irreversible processes are affected by and interact with biological processes such as uptake of nutrients by trees, field-layer vegetation and micro-organisms, and decomposition of organic matter and smaller organic molecules. Complete decomposition results in the
for-mation of CO2, NO3–, NH
4
+ and H
2O. Many biological processes
influ-ence the pH of the soil and release or immobilize substances in such a way as to affect abiotic processes, and vice versa.
3.2 S
TUDIESOF CATCHMENTSAND SOIL PROFILESAcidification and recovery processes can be studied on many different scales in terms of time and space. The molecular scale is relevant to our understanding of the forces driving individual chemical and physical pro-cesses. In other cases, the regional scale may be relevant, e.g. when it comes to developing control strategies at a policy level. In the great major-ity of cases, however, the catchment (watershed) and the soil profile are suitable scales for studies of acidification and recovery.
The water leaving a catchment can be regarded as the combined result of the biogeochemical processes occurring in the soil in the area, which are driven by a range of factors including deposition of air pollutants. By com-paring the chemical composition of the runoff from different catchments, and analysing how it varies geographically and over time, it is possible to obtain a great deal of information about the biogeochemical and hydro-logical properties of individual catchment areas.
This report refers to several examples of catchment studies, such as the research being conducted near Lake Gårdsjön and the analysis of chemical changes in Sweden’s lakes.
As water passes down through a soil profile, chemical reactions occur which determine the composition of the runoff. At the same time, differ-ent substances are redistributed in the soil, resulting, on a time-scale of a few centuries, in the formation of distinct, chemically homogeneous lay-ers, or horizons. It is of course important to be able to distinguish natural soil formation processes from changes caused by air pollution.
A particularly important type of soil system is the podzol, which is Swe-den’s commonest soil type in areas with till deposits, and which is also characteristic of areas susceptible to acidification. A podzol has several easily recognizable layers: an organic horizon nearest the surface, followed
by an eluvial (leached) layer of mineral soil, an illuvial (enriched) layer (known as the B horizon), and finally a layer of relatively unaltered parent material. The properties of a podzol in terms of the release, adsorption and desorption of ions depend on the characteristics of these different hori-zons, and concentrations of different substances therefore vary with depth.
Some of the processes with particularly marked impacts on biogeochemical cycles and hence on the recovery of acidified ecosystems are illustrated in figure 8.
3.3 I
ON EXCHANGECation exchange is one of the most important processes for acidification and recovery from acidification. This is because it acts as a buffer against both acidification and recovery, and thus regulates the pH and buffering capacity of soil water and runoff. Usually, a very large pool of exchange-able cations is availexchange-able, compared with the annual deposition of acid.
Exchangeable cations are bound electrostatically to charged soil par-ticles. Cation exchange is a rapid and reversible process. It occurs on colloids which have negative charges on their surfaces, e.g. clay minerals and partially decomposed organic solids. The total exchangeable pool is referred to as the cation exchange capacity.
The cation exchange capacity of a soil varies with depth (horizon). In contrast to sulphate ions, which are mainly adsorbed in the B horizon,
atmospheric deposition aquatic equilibria sulphide oxidation chemical weathering sulphate adsorption cation exchange nutrient uptake mineralization nitrification
Figure 8. Important processes influencing the course of acidification
cations are adsorbed most strongly in upper layers of the soil, owing to the abundance there of organic compounds to which metals can bind. Around Lake Gårdsjön, about 70% of calcium, for example, is found in the top 15 cm of the soil and the remaining 30% at greater depth. Most of the other base cations have similar distributions.
As a consequence of acidification, base cations have been displaced from soil particles by aluminium and hydrogen ions through the process of cation exchange. There has thus been a reduction of the ‘base saturation’ of the soil. In south-west Sweden, an estimated 2000–10␣ 000 meq of base cations have been displaced per square metre of soil, resulting in higher concentrations of these ions in the soil solution. As this water drains from the soil as runoff, base cations are thus removed from the system.
The process of recovery from acidification entails aluminium and hydrogen ions on exchange sites being replaced by base cations, resulting in a higher base saturation. In the long term, this raises the pH of the soil water, reducing the solubility of aluminium and hence the concentrations of this metal found there.
3.4 W
EATHERINGChemical weathering involves the dissolution of minerals present in the soil, such as feldspars, quartz and mica. The reactions take place at the interface between the minerals and the water surrounding them, and the dissolved reaction products enter the soil solution. The rate of weathering depends to a certain extent on the chemical composition of the soil solu-tion, but primarily it is determined by the properties of the minerals them-selves. Chemical weathering differs in many respects from ion exchange, since it is irreversible and kinetically controlled and the quantities of min-erals occurring in soils do not change on a time-scale of many centuries.
Weathering includes more than just chemical weathering. Wind, water and ice affect the physical structures of the rocks constituted by the differ-ent minerals. In addition, the hyphae of mycorrhizal fungi can bore into and dissolve mineral particles (Jongmans et al. 1997).
Dissolution of minerals adds buffering capacity to the soil. This occurs at a relatively constant rate, from a very large pool. Consequently, chemi-cal weathering is the process that determines a soil’s long-term resistance to acidification. Together with atmospheric deposition of base cations, it is also the chemical process which ensures a long-term supply of mineral nutrients in all soil ecosystems.
The rate of weathering in Swedish forest soils is normally estimated at
somewhere in the range 20–100 meq/m2/yr. Thus, in many areas
weath-ering has been appreciably slower than deposition of acidifying com-pounds. In the Gårdsjön area, the quantities of base cations released by weathering correspond to roughly 30% of the atmospheric deposition of sulphate, i.e. only 30% of this deposition is buffered by weathering. The rate of weathering is decisive to how rapidly the soil pool of exchangeable cations can be replenished.
3.5 S
ULPHUR FLUXES IN SOIL AND WATERSoil contains large amounts of sulphur, bound in organic matter and adsorbed onto minerals. This means that processes which affect the cyc-ling of these solid substances can potentially have a major impact on the flow of sulphur through the soil. The quantity of bound sulphur is several orders of magnitude larger than the amount of sulphur in soil water.
The most stable form of sulphur is sulphate, which is the most impor-tant inorganic form of this element in soil and water (Krouse & Grinenko 1991). In certain environments sulphides also occur, which can be a sig-nificant problem, causing acid surges or more permanent acidification. In the absence of sulphides, however, most of the sulphur in soils is found in organic compounds. In the Gårdsjön area, around 85% of the sulphur pool consists of organic sulphur compounds, while 15% is available as adsorbed sulphate (Torssander & Mörth 1998). These figures are not unusual, even in a global perspective.
Figure 9 shows how a number of processes interact in the soil sulphur cycle. Soil surface immobilization mineralization accumulation of bacterial sulphate reduction sulphides Water table runoff, deposition Org-S Org-S H2S(g), SO2(g), H2SO4 SO4 2-SO4 2-SO 4 2-adsorption desorption
Figure 9. Cycling of sulphur in soil. A reduction of sulphur deposition results in sulphate being released from the soil pool until a new balance is achieved. Net mineralization of organic sulphur can appreciably prolong the recovery process.
3.5.1 S
ULPHATEADSORPTIONIn the part of the soil in which secondary minerals have formed, the B horizon, sulphate can bind to surfaces by adsorption. Upper soil layers on the other hand, which consist predominantly of organic matter, have a low capacity to adsorb sulphate. In the Lake Gårdsjön area, 96% of all adsorbed sulphate is to be found in the B horizon (Torssander & Mörth 1998).
A state of equilibrium exists between the amount of sulphate in solution and the amount adsorbed. This means that sulphur will tend to be released by desorption when atmospheric deposition decreases. When one
equiva-lent of SO42– is adsorbed, one equivalent of H+ is consumed at the same
time at the mineral surface. Sulphate adsorption thus buffers the soil solu-tion against acidificasolu-tion, whereas desorpsolu-tion buffers it against recovery. We also know that the adsorption–desorption process is rapid and that the whole of the adsorbed quantity of sulphate is available and participates in the reaction (Karltun 1994). The latter has been shown by isotope studies in which researchers have tracked sulphate with differing isotopic compo-sitions. There is no reason to believe that a desorption curve looks any different from an adsorption curve. The process would thus appear to be completely reversible.
How much sulphate can be adsorbed depends to a large extent on pH. A fall in pH enables the soil to adsorb more sulphate.
Karltun and co-workers carried out extensive studies of sulphate ad-sorption in podzols, in which they performed measurements along three transects across Sweden (table 3, Karltun 1995). Along the southern transect, soils appeared to be saturated with sulphate. In this region, there-fore, sulphate adsorption will not buffer the soil against further acidifica-tion, but it will, when sulphur deposition falls, delay recovery by several
decades. The amount adsorbed, 2800 meq/m2, corresponds to some 50
years of sulphur deposition at the current, relatively low level.
Table 3. Adsorbed sulphate in Swedish forest soils (after Karltun 1995).
TRANSECT No. of Adsorbed Capacity Amount, 0–80 cm
sites meq/kg meq/m2
Southern: Hallandsås–Västervik 10 2.8 2.8 2800 Central: Dalsland–Sundsvall 9 3.5 4.7 2000 Northern: Gällivare–Boliden 6 2.0 4.5 900
Isotope studies carried out as part of the Gårdsjön roof experiment show that, even after several years of minimal sulphur deposition, all the sulphate in runoff consists of ‘old’ sulphur, and that recovery is thus de-layed by the adsorption–desorption process (Mörth & Torssander 1995).
3.5.2 O
RGANICSULPHURThe majority of the sulphur in soil occurs in the form of organic sulphur compounds, which include amino acids and enzymes. The most important properties of organic sulphur compounds are how stable they are, and how rapidly they are turned over in the soil.
Studies in the Gårdsjön area using stable isotopes show that some 50% of the sulphate deposited from the atmosphere is converted into organic sulphur compounds in upper soil horizons (Torssander & Mörth 1998). In other words, this sulphate is not leached from the soil directly, but does a ‘detour’ via organic compounds. In deeper layers of the soil, organic sulphur compounds can subsequently be immobilized and accumulate in stable forms (Johnson & Mitchell 1998).
Microbial processes consequently have a major influence on how much sulphur is leached from a soil profile. Some of the organic sulphur in upper soil layers has low stability, and studies have shown that a dynamic equilib-rium prevails between the amounts of sulphate that are immobilized and mineralized. Net mineralization corresponding to just a few per cent of the soil pool of sulphur can appreciably prolong the entire recovery pro-cess. This mineralization could be caused by reduced sulphur deposition, a higher temperature, or modified cycling of nitrogen.
3.5.3 S
ULPHIDEOXIDATIONANDBACTERIALSULPHATEREDUCTIONThere are also processes in the sulphur cycle which are not directly linked to the soil profile. Two examples are reduction of sulphate in wetlands, and oxidation of sulphides in wetlands or in conjunction with changes in
the water table. Sulphur reduction consumes H+ ions in the surrounding
water, while oxidation liberates H+.
The reduction of sulphur and its resultant accumulation as sulphides in wetlands is a natural process. The rate of accumulation has probably increased as a result of generally higher fluxes of sulphur in ecosystems. During dry periods, a small proportion of this sulphur can be oxidized, temporarily lowering the pH of streams draining the wetlands concerned. There is nothing to suggest that the reduction or oxidation of sulphur in wetlands and groundwater is increasing or decreasing as a result of
re-duced deposition. However, these processes could become more import-ant in conjunction with climate change. There is therefore every reason to keep an eye on what is happening to the sulphur retained in wetlands and other ecosystems.
3.6 A
QUATIC CHEMICALEQUILIBRIA– ANC
AND PH
As was emphasized above, the chemical composition of soil water and sur-face water depends not only on the scale of deposition, but also on the interaction between soil and water within the soil profile and within the catchment, respectively. Once water has passed through the soil, the pH values and aluminium concentrations found in runoff are determined by its total content of dissolved substances.
Changes in the buffering or acid neutralizing capacity (ANC) of a given body of water are often used as measures of acidification and chemical recovery, in both surface waters and soil water. ANC is a further refine-ment of the alkalinity concept which enables other weak acids than carbon dioxide to be taken into account, and which in addition allows the buffer-ing ability of very acidic waters to be calculated.
ANC can be defined in two ways. According to one definition, it is the difference between the total concentrations of base cations (BC) and strong acid anions (SAA):
ANC = BC – SAA where BC = [Na+] + [K+] + [Ca2+] + [Mg2+] SAA = [Cl–] + [NO 3 –] + [SO 4 2–]
The concentrations are expressed in equivalents per unit volume, e.g.
µeq/l. A shift towards a lower ANC results in more acidic water.
Using the ANC concept, it is possible to see directly how different pro-cesses in soil contribute to or counteract acidification or recovery. For ex-ample, we can see that a process which releases base cations, i.e. increases BC, but does not affect SAA, leads to a higher ANC. One such process is chemical weathering. Conversely, a process which liberates sulphate ions but does not affect BC results in a lower ANC and hence a lower pH. One example of this is the desorption of adsorbed sulphur, another deposition of sulphuric acid.
The balance of charges in the water is also used to arrive at the other definition of ANC, which is the difference between anions of weak acids and cations of weak bases:
ANC = [HCO3–] + [A–] – [H+] – [Aln+]
where A– denotes anions of organic acids and Aln+ all forms of positively
charged aluminium ions. In acid-sensitive waters, all other ions can nor-mally be disregarded. This equation is used to calculate the pH for any given ANC, but also to analyse the causes of low pH in a particular body of water.
Severely acidified waters often have an ANC < 0. Such waters have low pH (normally below pH 5.3) and significant concentrations of inorganic aluminium. Waters with high levels of organic acids can have low pH values, without having a low ANC or being acidified.
With the help of chemical equilibrium relationships, it is also possible to construct diagrams showing the effects of, for example, dissolved organic acids, measured as dissolved organic carbon in the water. An example is shown in figure 10. This diagram illustrates, among other things, how a higher concentration of organic acids results in a lower pH, for a given ANC.
The second definition of ANC also shows that an increase in ANC must result in a combination of lower aluminium concentrations in the water and higher pH. For the theory concerning how ANC and pH are linked to concentrations of dissolved substances and to chemical buffering systems in water, readers are referred to Warfvinge 1997.
pH of water . . . . . . . eq/l
Figure 10. Model calculation of the pH of water as a function of ANC, for three different concentrations of dissolved organic carbon (DOC). The diagram refers to water with twice as much dissolved CO2 as would be present if the water were in equilibrium with the atmosphere. After Warfvinge 1997.
3.7 N
UTRIENT UPTAKE AND LEACHING OFNITROGENIn the great majority of Swedish forest ecosystems, nitrogen is the limiting nutrient for primary production. This means that virtually the entire input of nitrogen from the atmosphere is taken up in the ecosystem, either in the soil, in the field layer or by trees.
Nitrogen undergoes deposition in two forms. Oxidized nitrogen is
emitted as NOx and deposited as NO3–. Reduced nitrogen is emitted as
NH3 and deposited as NH4+.
Uptake of cations, such as NH4+ and base cations, results in H+ ions
being added to soil water. Uptake of anions, e.g. NO3–, causes OH– ions to
be released into the water. Where there is a balanced uptake of NO3– and
base cations, growth as such thus does not entail any acidification of soil water. However, harvesting of trees means that base cations are not re-turned to the soil, which in the long term contributes to a declining base saturation.
Nitrogen deposition has an acidifying effect if nitrate is leached from the soil, or if the nitrogen has a fertilizing effect which leads to a greater uptake of base cations. Whether or not nitrate is leached is thus deter-mined by how much nitrogen is needed as a nutrient. It is normally said that a state of nitrogen saturation has been reached if the atmospheric deposition exceeds the net uptake, which results in nitrate leaching and acidification.
Deposition of nitrogen is not expected to decrease as rapidly as that of acidifying sulphur. Any recovery brought about by a lower level of sulphur deposition could, if the worst came to the worst, be slowed down if nitrate begins to be leached from soils.
How great, then, is the risk of nitrate leaching? Soils have a low capacity to adsorb nitrate, and there is therefore no pool of nitrate that can be directly mobilized. Leaching of inorganic nitrogen seems to be closely re-lated, rather, to how unstable the organic nitrogen in the soil is. A measure of the stability of the nitrogen compounds present is the C:N ratio, i.e. the ratio of organic carbon to organic nitrogen in the soil.
Figure 11 shows the relationship between the C:N ratio and leaching of nitrogen, primarily in nitrate form, in a number of forest ecosystems in Europe. A lower C:N ratio indicates that decomposer organisms in the soil have access to nitrogen in forms more readily available than organically bound nitrogen. The diagram shows that the higher the proportion of nitrogen in relation to the carbon it is bound to (i.e. the lower the C:N ratio), the greater is the risk of nitrate leaching. When the C:N ratio is below 25, there is a high risk of nitrogen being leached.
In areas which experience nitrogen leaching, it normally decreases as soon as deposition is reduced. In Swedish forest ecosystems from which nitrate is not being leached, the ‘safety margin’ is probably quite wide. We therefore do not expect an increase in nitrogen leaching, provided that climate change does not result in greater net mineralization of soil organic matter. In the Gårdsjön area, where the C:N ratio is 35, large quantities of nitrogen have been applied experimentally to the soil, with no long-term effects on nitrate leaching (Wright & van Breemen 1995).
3.8 T
HEIMPORTANCE OFLAND USELand use will also influence the rate at which recovery takes place. In the timber production forests of today, large quantities of nitrogen and base cations accumulate in wood and needles and are subsequently removed from the ecosystem when the trees are harvested. It is difficult to precisely quantify the acidifying effect of forestry; it depends on how forests’ uptake of nitrogen is assessed in relation to their uptake of base cations. What is clear, though, is that the removal of base cations from forest ecosystems
N leaching, kg N/ha/yr
C:N ratio of organic horizon
Figure 11. Relationship between the C:N ratio of the soil and leaching of inorganic nitrogen, primarily nitrate. Based freely on Dise et al. 1998.
has an acidifying effect. If there is a trend in forestry towards a higher extraction of biomass, without compensatory measures such as recycling of wood ash, recovery from acidification will be held back. Whole-tree harvesting is also a potential threat to recovery. It is particularly important not to remove the nutrient-rich needles.
Liming or nitrogen-free ‘vitality fertilization’ of forest soils is a way of rapidly restoring the base cation pool of upper soil horizons, thereby re-pairing to some extent the changes in soil chemistry caused by acidifica-tion. However, it takes several decades for liming to have a significant effect on deeper layers of soil.
3.9 S
PATIALVARIATION WITHIN CATCHMENTSCloser studies of catchments often reveal considerable spatial variation in soil characteristics, even within small drainage areas. The soil is usually thinner and drier on hillsides than down in the valleys, in the vicinity of rivers or streams. The processes shaping the chemical and physical devel-opment of a soil are generally linked to water availability, and differences in soil moisture are therefore of great importance.
Runoff represents an integrated outflow of water and substances from an entire catchment area, but the soil cover in different parts of the catch-ment affects its composition to differing degrees. Areas far away from the stream or river may be of limited significance for runoff chemistry, since at times there may be no hydrological link between these areas and the watercourse. Consequently, soil processes occurring in recharge zones may be less important for the composition of runoff than those taking place in the discharge zone adjacent to the watercourse, even if the latter zone covers only a limited area. This mechanism affects different sub-stances to differing degrees.
3.10 T
HEDYNAMICS OFACIDIFICATION AND RECOVERYThe above discussion of processes in the soil system can be summarized by dividing the acidification and recovery process into four phases:
• Prior to acidification • During acidification • Acidified state
• Early stages of recovery
There is much to suggest that we are now at the beginning of the fourth of these phases.
Prior to acidification, a state of equilibrium prevailed between the pro-duction and consumption of ANC and the most important dissolved con-stituents in the soil system, and hence also in catchments. The degree of base saturation was therefore stable. The concentration of base cations in runoff corresponded to the difference between weathering plus deposi-tion on the one hand and net uptake by vegetadeposi-tion on the other. A stable soil chemistry produced an even and high ANC, and often a high runoff pH, if the effect of organic acids was limited.
When acid deposition – chiefly in the form of acidifying sulphur – in-creased around the turn of the century, this steady state was disturbed. Via the mechanism of ion exchange, the elevated acid input to the soil system resulted in a reduction of the pool of exchangeable cations. This led to higher concentrations of base cations in the soil solution and losses of these ions from the soil system. As yet, there had been no appreciable fall in soil pH, and concentrations of inorganic aluminium were therefore still low. A certain proportion of the sulphate deposited was adsorbed, delay-ing the acidification process.
prior to acidification during recovery acidified state during acidification decreasing exchangeable pool large exchangeable pool small pool small pool increas-ing pool increas-ing pool large
pool decreasingpool
Base cations (BC):
Strong acid anions (SAA): mainly Ca2++Mg2++K++Na+ SO42– BC > SAA ANC > 0 BC ≈ SAA ANC ≈ 0 BC < SAA ANC < 0 BC ≈ SAA ANC ≈ 0
Figure 12. Illustration of how processes which buffer soil and soil water against acidification also buffer them against recovery when deposition decreases.
An acidified state is reached after a long period of high deposition. At this stage, the buffering capacity of the ion exchange pool declines and the system moves towards a new equilibrium. As buffering ion exchange reac-tions abate, soil and runoff pH fall rapidly to stable low levels. Concentra-tions of base caConcentra-tions in runoff decrease, while aluminium levels in soil water and runoff increase. The anion exchange sites in the soil are satur-ated and unable to adsorb any more sulphate. Streams and lakes show signs of chronic acidification, with ANC values below zero.
When deposition decreases, the process of recovery begins in the soil. This process is delayed by desorption of sulphate, and by replenishment of
the pool of exchangeable base cations. Both these processes result in H+
ions being released into soil water from solid material in the soil, and there is also a decrease in base cation concentrations in the soil solution and runoff. Since the annual rate of weathering is low in relation to the pools of exchangeable cations and adsorbed sulphate, this phase will be very protracted. What is more, deposition of acidifying compounds is expected to remain above pre-industrial levels for the foreseeable future, and it will take a very long time for pools of exchangeable base cations to return to their original levels. Consequently, only partial chemical recovery will occur. However, the biological benefits of this limited chemical recovery may be considerable.