Department of Science and Technology Institutionen för teknik och naturvetenskap
Linköping University Linköpings universitet
g n i p ö k r r o N 4 7 1 0 6 n e d e w S , g n i p ö k r r o N 4 7 1 0 6 -E S
LiU-ITN-TEK-A--12/082--SE
Aamir Abdul Aziz Hasan Ali
Muhammad Adil Shahzad
2012-12-14
A Joint Subcarrier/Power
allocation Scheme for
OFDMA-based Cellular
LiU-ITN-TEK-A--12/082--SE
Examensarbete utfört i Elektroteknik
vid Tekniska högskolan vid
Linköpings universitet
Aamir Abdul Aziz Hasan Ali
Muhammad Adil Shahzad
Handledare Evangelos Angelakis
Examinator Di Yuan
Norrköping 2012-12-14
A Joint Subcarrier/Power
allocation Scheme for
OFDMA-based Cellular
Upphovsrätt
Detta dokument hålls tillgängligt på Internet – eller dess framtida ersättare –
under en längre tid från publiceringsdatum under förutsättning att inga
extra-ordinära omständigheter uppstår.
Tillgång till dokumentet innebär tillstånd för var och en att läsa, ladda ner,
skriva ut enstaka kopior för enskilt bruk och att använda det oförändrat för
ickekommersiell forskning och för undervisning. Överföring av upphovsrätten
vid en senare tidpunkt kan inte upphäva detta tillstånd. All annan användning av
dokumentet kräver upphovsmannens medgivande. För att garantera äktheten,
säkerheten och tillgängligheten finns det lösningar av teknisk och administrativ
art.
Upphovsmannens ideella rätt innefattar rätt att bli nämnd som upphovsman i
den omfattning som god sed kräver vid användning av dokumentet på ovan
beskrivna sätt samt skydd mot att dokumentet ändras eller presenteras i sådan
form eller i sådant sammanhang som är kränkande för upphovsmannens litterära
eller konstnärliga anseende eller egenart.
För ytterligare information om Linköping University Electronic Press se
förlagets hemsida
http://www.ep.liu.se/
Copyright
The publishers will keep this document online on the Internet - or its possible
replacement - for a considerable time from the date of publication barring
exceptional circumstances.
The online availability of the document implies a permanent permission for
anyone to read, to download, to print out single copies for your own use and to
use it unchanged for any non-commercial research and educational purpose.
Subsequent transfers of copyright cannot revoke this permission. All other uses
of the document are conditional on the consent of the copyright owner. The
publisher has taken technical and administrative measures to assure authenticity,
security and accessibility.
According to intellectual property law the author has the right to be
mentioned when his/her work is accessed as described above and to be protected
against infringement.
For additional information about the Linköping University Electronic Press
and its procedures for publication and for assurance of document integrity,
please refer to its WWW home page:
http://www.ep.liu.se/
A Joint Subcarrier/Power allocation
Scheme for OFDMA-based Cellular
Networks
Group Members:
Aamir Abdul Aziz Hasanali
Muhammad Adil Shahzad
Supervisor:
Dr. Vangelis Angelakis
Examiner:
Prof. Di Yuan
Department of Science and Technology
Linköping University, SE-601 74 Norrköping, Sweden
Norrköping 2012
i
Abstract
The assignment of this master thesis consists of initiating power, subcarrier allocation in a dynamic FFR based scheme designed for multi-cell OFDMA networks and to enhance the throughput of all center users in bandwidth hungry borrower cells (overloaded cells) which was previously degraded by original FFR3 scheme as a result of partitioning of system bandwidth into center and edge bands respecti ely. The ethod uses a d orrowi g to co pe sate ce ter user’s throughput loss i a semi and fully overloaded system. The scheme uses dynamic programming method (0/1 knapsack problem) to bargain an edge band on various power levels and tends to check the best combination (power and sub-carrier) which the system can utilize while still maintaining acceptable throughput loss for the users at the edge of the neighboring cell (lender cell).
The algorithm consists of generating a borrowing request to neighboring cells for utilizing their edge bands by the overloaded borrower cell if their average center user throughput reaches below a minimum threshold value set in the system. The borrowing method uses 0/1 knapsack problem to capture an edge band based on limiting factors of total cost in average throughput losses by neighbors (Ci) and Un (tolerable mean user edge user throughput loss by lending cell). While solving knapsack problem the lender (neighbors) will check Ci and Un before granting the right to use its edge band. The later stage requires reducing subcarrier power level in order to utilize the lenders edge a d usi g soft orrower ode. The orrowed su -carriers will be activated take power from the original center band sub-carriers of the overloaded cell by taking into account the interference between the lender and the borrower. In case of negative (0) reply from the lender cell after the first request, multiple requests are generated at reduce power level at every step to order to acquire more bands. If a neighbor has band borrowing requests from multiple overloaded base stations, the band will be granted to the one which gives minimal loss in terms of throughput to the lender cell.
The simulation results are analyzed w.r.t reuse-1 and FFR3 scheme of a multi cell regular and irregular scenarios comprising of lightly to heavily overloaded cells with various subcarrier allocation patterns. An overhead and time assessment is also presented between borrower and lender cells. Si ulatio results show a i crease of 60% i ce ter user’s throughput w.r.t origi al FFR3 sche e with an acceptable loss of 18% at the edges in complex overloaded scenarios while the overall system throughout increases by 35%.
ii
Acknowledgements
We are immensely happy with the completion of this thesis work and would like to express deepest appreciation to our supervisor Dr. Vangelis Angelakis for this guidance and support throughout this thesis work.
Apart, we would also like to thank our examiner and head of Mobile Telecommunications Group at Linköping University Prof. Di Yuan for allowing us to do this thesis work within his department. Lastly, we would like to express our deep love and regards to our family and special friends for their support and guidance.
Table of Contents
Abstract . ... i
Acknowledgements ... ii
1- INTRODUCTION ... 1
1.1 Problem Statement ... 1
1.2 Objectives ... 2
1.3 Thesis Outline ... 2
2- THEORETICAL BACKGROUND ... 3
2.1 Orthogonal Frequency Division Multiplexing (OFDM) ... 3
2.2 The Orthogonality Principle ... 3
2.3 Key Aspects When Considering OFDM ... 4
2.4 Orthogonal Frequency Division Multiplexing Access (OFDMA) ... 4
2.5 Applications of OFDMA ... 5
2.5.1 LTE 4G Systems ... 5
2.5.2 WiMAX Systems (IEEE 802.16x) ... 5
2.6 Interference in Cellular Networks ... 5
2.7 Frequency Reuse and Interference Management Schemes in OFDMA Network ... 7
2.8 Fractional Frequency Reuse Scheme (FFR) ... 8
2.9 Fractional Frequency Reuse (FFR) vs Reuse-1 Scheme ... 8
2.10 Soft Frequency Reuse Scheme (SFR) ... 9
2.11 Other Proposed Schemes ... 10
2.11.1 Enhanced Fractional Frequency Reuse Scheme (E-FFR) ... 10
2.11.2 Flexible Fractional Frequency Reuse Scheme (F-FFR) ... 11
2.12 Types of Optimization Problems ... 11
2.12.1 The 0-1 Knapsack Problem ... 12
2.12.2 Fractional Knapsack Problem and the Greedy Approach ... 12
3- PROPOSED WORK AND THE SCHEME OVERVIEW ... 13
3.1 Simulation Setup and System Parameters ... 13
3.2 Implementation of FFR Scheme & Allocation of Edge Bands ... 15
3.3 Criteria for Edge Bands Allocation ... 15
3.4 Allocation of Center and Edge Type Users ... 16
3.5 Criteria for Overloaded Cell Center ... 16
3.6 Overview of Knapsack Modeling in Implemented Scheme ... 16
3.7 Generation of Lending Request by Overloaded Cell ... 16
3.8 Solving 0-1 Knapsack Problem by Neighboring Cells ... 16
3.9 Borrowing Process ... 17
3.10 Power Considerations - The bargaining concept ... 17
3.11 Calculation of Gain and Loss Estimation ... 18
3.12 Algorithm Flowchart ... 19
3.13 Simulation Time, Efficiency & Overhead ... 20
3.14 Salient features of the Implemented Scheme ... 22
4- SIMULATION RESULTS ... 23
4.1 Evaluation of Implemented Scheme on Different Cell Loads ... 23
4.2 Assessment of Implemented Scheme on Different Subcarrier Allocations ... 26
4.2.1 52/16/16/16 % Center/Edges Bandwidth Allocation Pattern ... 26
4.2.2 70/10/10/10 % Center/Edges Bandwidth Allocation Pattern ... 28
4.3 Conclusion ... 30
4.4 Performance of Implemented Scheme on Irregular Random Topology ... 31
4.5 Implemented Scheme Performance ... 34
5- CONCLUSION ... 35
5.1 Future Work ... 35
References ... 36
Appendix A ... 37
Appendix B ... 39
Appendix C ... 40
1
1- Introduction
Orthogonal frequency division multiplexing access (OFDMA) is a diversified technique used in fourth generation mobile networks such as 3GPP LTE, WiMAX etc. It is based on orthogonal division multiplexing (OFDM). OFDM mitigates the inter symbol interference (ISI) resulting from the frequency selective fading by dividing the whole frequency spectrum into number of orthogonal subcarriers.The use of the same frequency in cells (the so called reuse-1 scheme) raises co-channel interference (CCI) from neighboring cells. To deal with this CCI problem the fractional frequency reuse (FFR) scheme has been studied [10].
In FFR each cell is partitioned into two regions namely the cell center and the cell edge. Available bandwidth is divided into two bands in such a way that center uses resue-1 and the edge employs reuse schemes of factors greater than one. Due to higher order of interference achieved by the edge users in a cell, the FFR scheme limits the edge user’s i terfere ce to a great e te t y usi g higher frequency reuse factor at the edge enabling a better Quality of Service (QoS) for its edge users. However, this interference mitigation scheme reduces the throughput for center users (due to effective reduction of bandwidth available to them). This situation becomes especially prominent when a cell is overloaded. To deal with this problem, a new scheme based on [1] is analyzed here by adopting FFR on each cells center load and generating borrowing requests to neighboring cells when the cell center become overloaded.
If the cell’s average users throughput falls below the minimum throughput threshold value (symbol threshold) the cell becomes overloaded. Once a certain number of overloaded cells are identified a Knapsack problem is implemented on these cells neighbors to optimize per user throughput, by solving this problem on every cell neighbors to e ha ce the cell ce ter user’s throughput through generating borrowing feature to acquire an extra band for its center users thus enabling its neighbors to lend their edge band to the borrower cell.
While, generating borrowing requests to the neighboring base stations the overloaded cell will broadcast expected values of gains in terms of throughput with respect to different power levels. After the edge band borrowing requests have been generated, in response to the request generated by the overloaded cell base station, its neighbors will compute the loss in throughput to its edge users and the interference associated with it. If the resulting interference becomes high enough it will send a deny response to the overloaded cell else an edge band is landed to the borrower base station. Further to investigate on how much power must a certai edge a d orrows i order to i pro e the ce ter user’s throughput while maintaining minimum interference level.
1.1 Problem Statement
I today’s e t ge eratio o ile OFDMA etworks such as LTE & WiMAX an increased amount of research is being done to mitigate interference of cell edge users and to employ a better quality of service of users at cell edges. Various interference mitigation schemes like FFR and SFR are proposed which tends to increase the QoS of cell edge users by partitioning the bandwidth into center and edge a ds respecti ely. But, this co es at a cost of sacrifici g a portio of cell ce ter user’s a dwidth to compensate its edge users. By doing so center users suffers a throughput loss when the cell center becomes overloaded. In order to deal with this situation and to overcome the throughput loss suffered
2
by center users in original FFR a new scheme is analyzed to overcome this issue by using band borrowing feature from neighboring cells when a cell center user becomes saturated.
1.2 Objectives
The assignment of this thesis work consists of analyzing a scheme which can compensate the throughput loss caused by employing FFR on cell center users in an OFDM network by using band borrowing criteria when a cell center becomes overloaded. The new scheme consists of power and subcarrier allocation for the borrowed band as power ratio becomes critical. The algorithm was made and tested in Matlab for a simulation of N base stations in regular and multiple irregular scenarios consisting of random user traffic with variable center and edge band subcarrier allocation to see the overall impact on our implemented scheme. A summarized list of objectives is outlined below.
To increase the throughput of bandwidth sensitive center users that was previously degraded by the implementation of the FFR scheme.
To implement a dynamic programming approach (knapsack problem) for bargaining an edge sub band for borrower cells center users with least possible interference.
To investigate a detailed power assignments and the associated gain and loss from bargaining of an edge band from neighboring cells and to optimize best possible power and sub band allocation conditions.
To investigate multi-cell regular and irregular scenarios with multiple user traffic cases. To investigate total overhead caused by message exchange between adjacent cells.
1.3 Thesis Outline
The thesis report is divided in five parts, chapter 2 gives a theoretical overview regarding OFDM networks its application and various adopted interference mitigation schemes such as FFR, SFR etc. chapter 3 discuss about knapsack problem, details about the implemented scheme, calculation of interference and SINR for users in cellular networks etc. chapter 4 outlines the various simulation results achieved for the implemented scheme in regular and irregular topology of base stations with respect to different subcarrier allocation divisions and finally chapter 5 presents possible future works that can be done as an extension of the desired scheme.
3
2- THEORETICAL BACKGROUND
2.1 Orthogonal Frequency Division Multiplexing (OFDM)
OFDM is a diversified multiplexing technique used in next generation wireless communication networks. It is a scheme used to utilize bandwidth efficiently. OFDM can cope up with inter symbol interference caused by different reflected and time delayed signal components at the receiver. It is an application of parallel data transmission technique (like Frequency Division Multiplexing) used in traditional communication techniques [11].
In OFDM the available system bandwidth is divided into a number of low data rate sub-carriers closely apart to utilize system bandwidth efficiently. The orthogonal carriers in an OFDM system can be overlapped without causing inter-carrier interference among subcarriers. This allows instantaneous transmission of data on each subcarrier without causing interference to other subcarriers due to their orthogonal sequence. The figure 2.1 below represents an OFDM sub channel and an OFDM signal with 5 subcarriers.
Figure 2.1 – An OFDM sub channel and OFDM signal with 5 subcarriers [7].
2.2 The Orthogonality Principle
The basic criterion of analyzing an OFDM signal is the orthogonality of carriers. In OFDM all sub-carriers are multiples of sine and cosine waveforms. The area under the curve of any given sine and cosine waveform is zero over a time period.
The multiplication of a sine wave with another sine or cosine wave of frequencies (m,n) as shown in figure2.2
4
By using the trigonometric relation between the two waves by adding and subtracting the two signals frequencies yields
(2.1)
The two signal components are orthogonal to each other, the integral over one time period is zero.
(2.2)
Since any multiples of sine and cosine (harmonics) are orthogonal to each other allowing all the sub-carriers to transmit in a given band without interfering each other.
2.3 Key Aspects When Considering OFDM
The keys aspects when considering OFDMA are.
1. Separate orthogonal narrowband transmissions which are not affected by other channels can be done.
2. A higher transmission rate by using all available subcarriers and an ability to cancel fading caused by inter symbol interference (ISI) due to the use of cyclic prefix.
3. With OFDM the subcarriers can be modulated and coded according to desired scheme.
2.4 Orthogonal Frequency Division Multiplexing Access (OFDMA)
OFDMA is a multiple access technique based on OFDM used in multi-user system. OFDMA is a combination of time division duplexing (TDD) and Frequency division duplexing (FDD) where all users can utilize the whole frequency band simultaneously by using all sub-carriers in different time intervals according to their data needs. OFDMA can combat multipath signal distortion and inter-carrier interference (ICI) due to its orthogonal behavior as a result all users in a wireless network can enjoy higher data rate. The figure 2.3 shows multiple users are assigned multiple sub-carries at different time intervals.
5
2.5 Applications of OFDMA
Two of the most prominent current applications utilizing OFDMA technique are underline below.
2.5.1 LTE 4G Systems
One of the latest systems utilizing OFDMA is the Long Term Evolution (LTE) 3GPP mobile network. OFDMA is used as the radio access technology in the downlink part of LTE network because of its robustness to noise and ability to carry high data rates that can achieve speeds up to 3-4 times greater than HSDPA in 3G by using the same system bandwidth with significantly low latency [6]. An LTE network gives flexibility from a wide variety of channel bandwidth to choose ranging from 1.4 MHz to 20 MHz since, a broad range of carriers can be accommodated in an OFDM signal thus the more the bandwidth the greater the channel capacity. An OFDM symbol used in LTE network comprises of 2048 subcarriers at maximum with guard time spacing of 15 KHz between the subcarriers.
2.5.2 WiMAX Systems (IEEE 802.16x)
The WiMAX systems uses OFDMA technique in both uplink and downlink with a variable signal bandwidth between 1.25 MHz to 20 MHz respectively and a symbol rate with multiples of 128 carriers from bandwidth ranging from lowest to highest. In WiMAX the symbol period is kept as a reciprocal of carrier spacing to maintain orthogonal behavior such as the narrower the bandwidth the longer the symbol period which can also be applicable for NLOS applications due to less interference and multi path fading. The advanced version of WiMAX also called MIMO WiMAX using multiple antennas to transmit and receive signals. The MIMO WiMAX can cope up with throughput losses by providing very high data rates between users. It also provides advantages in term of coverage, power, bandwidth efficiency and frequency reuse etc.
2.6 Interference in Cellular Networks
Interference is the composite of signal components that are superimposed on the same channel as a signal of interest. Interference can be caused by different factors which includes atmosphere, same frequency and channel usage etc. The impact of interference can be severe which allows the original signal to become non-detectable. Interference is a major reason for degradation of user throughput in a wireless system.
In the following figure (2.4) as User UE (x,k) has serving base station 2, it will gain interference from its
neighboring cells users UE(y,k),UE(z,k),UE(w,k) which are using the same subcarrier as that of current cell
6
Figure 2.4 – Interference in a cell
Center and edge users UC, UE are assigned center and edge subcarrier type SC or SE, respectively, these
users will experience interference from the same subcarrier (k) SCk which is later assigned to other users
in neighboring BSs. As an example, user (i) UCi which is using SCk and if any neighboring user (j) UCj is
using the same SCk then that user UCj is an active interfere to the user UCi. The Interference Ii of UCi is now
computed as by summing all the values of transmitted power of TX times path loss gain G of all the
neighboring BSs UC that are in interference list. In this way interference Ii of a UCi using SCk is computed.
Mathematically signal to noise ratio (SNR) and Interference Ii is expressed as.
(2.3)
(2.4) Signal to interference noise ratio (SINR) is used to measure the clarity of a signal. The SINR value for each user (k) is computed mathematically by the formula expressed by equation 2.5
(2.5)
Where Txk represents the power used by sub-carrier k, Gij is the path loss of a user (j) from its serving BS,
No is noise power spectral density and Interference Ii is calculated as sum of all the interferences
received from neighboring cells as shown in equation 2.4. Thus y usi g Sha o ’s for ula the throughput of a user (k) is computed as the product per user bandwidth and its SINR value as define equation (2.6)
(2.6)
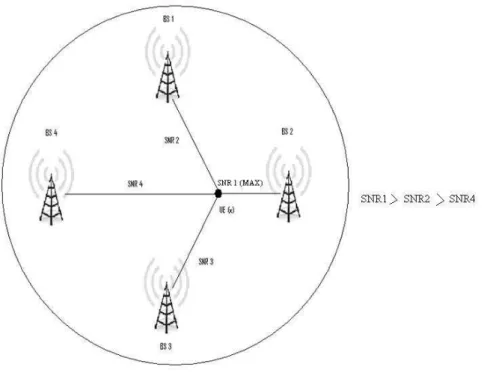
As shown below in figure 2.5, UE (x) will measure the maximum SNR as calculated in equation 2.3 from every base station before assigning itself to that BS. Figure 2.5 shows a scenario when the UE finds base
7
station 2 as its serving base station based on maximum SNR. In our simulation users are assigned to each base station by using SNR values.
Figure 2.5 – Setting users with maximum SNR
2.7 Frequency Reuse and Interference Management Schemes in
OFDMA Network
The idea of fre ue cy reuse is of ital i porta ce used i today’s wireless co u icatio syste s. The method of frequency reuse is used to enhance user capacity and spectral efficiency in any mobile network. It is done by reusing the same RF channels and frequencies in cells that are at certain distance apart within the same mobile network to increase user capacity within each cell for a limited frequency band as shown in figure (2.6). By reusing frequency does not provide interference limited problems.
8
Various interference management schemes and their modified versions are proposed in OFDM network to enhance the throughput and to cope up with the interference related problems of users at the cell edge namely, FFR, SFR, E-FFR, FFR-F [3,9,8]. These schemes provide a very low level of interference to the edge users to enhance their throughput and improve the performance of cell edge users in an OFDM network.
2.8 Fractional Frequency Reuse Scheme (FFR)
Fractional Frequency Reuse (FFR) is one of the interference mitigation scheme used to enhance cells edge users performance in OFDM network. It is based on partitioning the given system bandwidth into center and edge bands used by center, edge users. Each cell is divided into center and edge zones respectively. The center users use their allocated center band with a reuse factor of 1, while the edge user’s uses their edge band with a higher reuse factor. The edge band is further divided into chunk of sub-bands say three edge bands A, B and C respectively with each edge band used by alternate cells as shown in figure (2.7).
In FFR scheme users at the edge yields more throughput since they are less prone to interference due to the higher frequency reuse factor of three. The center users in FFR are more prone to interference from the neighboring cells since they all use the Reuse-1 scheme as a result the throughput for center users decreases for all center bandwidth limited users.
Figure 2.7 – A basic FFR scheme with frequency reuse 3 at the edges
2.9 Fractional Frequency Reuse (FFR) vs Reuse-1 Scheme
Although FFR increases the performance of users at the edge in terms of throughput it also imposes a throughput decrease for its center users due to partitioning of system bandwidth into center and edge respectively since a portion of center bandwidth is sacrificed to compensate edge users decreasing throughput loss in reuse-1 scheme as seen by a graph in figure (2.8) which shows a drastic increase in
9
center users throughput as the UE moves towards the base station in reuse-1 scheme but at the same time the edge users in reuse-1 scheme suffers due to increasing order of interference received by the edge users from neighboring base stations from the set of same frequency bands used all over the system. On the other hand the graph representing FFR shows a tremendous increase in throughput of edge user’s w.r.t reuse-1 scheme but at the same time a decreasing throughput behavior is seen w.r.t reuse-1 as the UE moves toward the base station which creates problems for bandwidth hungry center users.
Figure 2.8 – Throughput comparison of FFR and reuse-1 scheme [1].
2.10 Soft Frequency Reuse Scheme (SFR)
Soft frequency reuse (SFR) is another interference management scheme used to mitigate interference at the cell edge. In SFR the system bandwidth is divided into chunk of three bands as seen in figure (2.9) with only one sub band dedicated to cells edge zone while the remaining edge portion is also used by cells center zone which constitutes a larger bandwidth used by the cell center users. In SFR the non-isolation between the two desired bands produces interference between center users with neighboring cells edge zone due to each cell center uses its edge portion as a result a low power for center band is used to overcome this problem [3].
10
Figure 2.9 – The concept of SFR as interference mitigation scheme at the edges
2.11 Other Proposed Schemes
A wide variety of proposed schemes for minimizing interference at the cell edge for increasing the throughput, QoS for edge users are listed below.
2.11.1 Enhanced Fractional Frequency Reuse Scheme (E-FFR)
The Enhanced Fractional frequency Reuse scheme (E-FFR) uses multiple sub bands to facilitate cell edge user’s perfor a ce. Its divides the system bandwidth into small number of sub bands allocated to edge and center users respectively as shown in figure (2.10). The cell edge zone uses multiple edge bands to provide higher throughput and less interference to its users from neighboring cells edge zones. Any cell may utilize multiple numbers of edge bands to its less interference sensitive edge users with a higher throughput.
11
2.11.2 Flexible Fractional Frequency Reuse Scheme (F-FFR)
This modified scheme divides the whole system bandwidth same as in FFR. In Flexible-FFR the cell uses all allocated edge bands for its edge users instead of utilizing only one edge band in order to maximize the throughput for users at the edge [8]. This version of FFR accounts in increasing the throughput for its bandwidth sensitive edge users.
Figure 2.11 – Flexible FFR scheme (F-FFR)
2.12 Types of Optimization Problems
There are various types of optimization algorithms and corresponding methods in mathematics to solve a specific task either maximize or minimize depending upon the problem being solved. A few of them are listed below
Combinational optimization Dynamic programming Stochastic optimization
12
2.12.1 The 0-1 Knapsack Problem
0-1 Knapsack problem is an application of combinational optimization area in mathematics which deals with searching an optimal answer from any set of data. It can be used in any real world decision making procedure. 0-1 Knapsack problem aims to search for the best solution and optimum answer given a set of n items each with weights (Wi) and its values (Vi). The output of 0-1 knapsack problem produces a maximize solution within knapsack size (W) with the sum of all weights of items in a set is at most (W) and values corresponding to items n is maximized. The mathematical equation of a knapsack problem can be expressed as in equations 2.7 and 2.8 respectively.
Note that the 0-1 knapsack problem limits the number of each kind of item (Xi) to either No (0) or Yes (1).
2.12.2 Fractional Knapsack Problem and the Greedy Approach
The fractional knapsack problem takes values between 0 and 1 and further breaks the item into fractional parts. However the greedy approach used in fractional knapsack problem gives an optimum result based on greedy approach w.r.t profit density that is where each item is further break into fractional parts and added with the highest profit to maximize the result provided that it does not exceeds the total capacity (W) of the knapsack.
2.12.3 The Dynamic Programming Approach to 0-1 Knapsack Problem
Dynamic programming is a very powerful and efficient method. This algorithm is used when the problem can be constantly describe in terms of small sub problems and finds an optimal solution for the sub problems (optimal substructure) starting from the lowest while eventually leading the solution for the highest ones. The solution is than stored in memory for later utilization. The stored results are then used to obtain the final solution.
13
3- Work Performed and the Scheme Overview
In Wireless communication research an increasing amount of focus is given on minimizing interference while increasing the throughput for users. Therefore, by carefully using appropriate frequency reuse schemes as the ones mentioned in the previous chapter, this CCI can be minimized to a great extend. The concept of FFR (Fractional Frequency Reuse) and SFR (Soft Frequency Reuse) have been proposed to minimize the interference and throughput related problems faced by cell edge users by using a higher order frequency reuse pattern at the cell edge and dividing the frequency spectrum into center and edge bands respectively.
In FFR the partitioning of system bandwidth into small portions produces serious problems for the cell center users in utilizing this limited spectrum. As the bandwidth is further divided into center and edge bands respectively, that further reduces the overall throughput for bandwidth limited center users greatly.
To cope with this situation the main focus of this thesis work is to increase the throughput levels of cell center users caused by splitting of system bandwidth in original FFR scheme, while it will still provide acceptable throughput for cell edge users. For this, every cell will go through an optimization process based on solving knapsack problem in each and every overloaded cell neighbors, thus allowing a cell to use its eigh or’s edge a d for its ow overloaded center users.
3.1 Simulation Setup and System Parameters
A simulation of 25-49 base stations analyzing this scheme was performed in Matlab using random distribution of users in a regular and irregular geometry of base stations with wrap round technique to analyze the system in term of realistic interference. The evaluation in gains and losses for center and edge users was analyzed with respect to random user traffic in regular and irregular geometry base stations by various experiments. The overloaded base system threshold criterion was set to 128 – 256 Kbps or based upon maximum number of users per cell. Other, system parameters are summarized in table 3.1
14
Table 3.1 – System Parameters
Symbol Quantity
Value BW bandwidth of OFDM system 20 MHz
FC carrier frequency 2600 MHz
NO noise spectral density -174 dBm/Hz
TX transmit power 40 dBm
N number of cells 25 - 49 RC cell radius 1000 m
NU number of users per cell [80,120]
MU maximum number of users 120
MUin minimum number of users 80
DB distance between base stations 2000 m
MN max number of neighbors 6
X~ user location distribution per cell Random EP edge percentile of center users 5%
ST total number of subcarriers 50
SC center sub-carriers 40%, 52%, 70%
SE edge sub-carriers 20%, 16%, 10%
EA,EB,EC edge band types red, green, blue
UC center user type 1
UE edge user type 2
SBW subcarrier bandwidth 400 KHz
NT Minimum throughput threshold per
cell center (Overloaded Criteria)
15
3.2 Implementation of FFR Scheme & Allocation of Edge Bands
A general overview for FFR scheme in MATLAB showing users along with center and edge bands in a regular and irregular scenario which comprises of 25-49 base stations in a semi and fully overloaded system with users randomly assigned per cell as shown in figure 3.1
Figure 3.1 – Overview of FFR scheme in regular and irregular scenario
3.3 Criteria for Edge Bands Allocation
The criterion for edge band allocation in regular topology is based on scanning nearest neighboring cells at a define distance (D = 2000m) and allocating them edge bands A, B and C alternatively. The initial allocation starts with a base station scanning it nearest neighbors at a required distance D and checks which edge band used in the vicinity considering all its neighbors. It then allocates an edge band to itself which is not used by neighboring base stations. When allocating edge bands in random topology a careful consideration is taken in account by trying not to repeat similar bands once allocated between neighboring BS that cause worse interference along similar edge bands when the cell becomes overloaded. In some complex random scenarios band edge repetition occurs because of a greater number of neighbors per cell. A round robin scheme is used in the system where the users in a cell can utilize all available subcarriers either edge or center based on their type.
In irregular topology some assumptions are also considered that when an overloaded cell scans for its neighbors within a range of Distance (D) and if it is unable to find any neighbors within the required distance it will borrow both the bands at the default (maximum) power level equally distributed among all the subcarriers (borrowed bands & center subcarriers) it is using or in some cases if an overloaded base station finds only a single neighbor using an edge band it will use the next available free band at maximum power level and the other neighboring edge band at a bargained power level.
16
3.4 Allocation of Center and Edge Type Users
The allocations of center and edge users are done on the basis of strongest and weakest SNR values. The users that are close to the serving base station and falls below a certain threshold SNR value are assigned as center users and are allocated all center subcarriers whereas, the users that lie beyond the required SNR limit were assigned as edge type.
3.5 Criteria for Overloaded Cell Center
When a cell center becomes overloaded that is more and more users joining the current cell which tends to degrade the overall throughput of cell center users and a cells minimum average center user throughput level is reached at a threshold limit, the cell issues a lending request to the neighboring cells for acquire more bandwidth for its center users by acquiring an edge band.
3.6 Overview of Knapsack Modeling in Implemented Scheme
A knapsack model is implemented on every borrower BS neighbors (Kn) to optimize per user throughput
for its borrower cell center users. The borrowing BS will send the estimated gain in throughput per center user gi to all of its neighboring BSs. In lending process, every neighboring cell kn will solve 0/1
k apsack pro le ased o the criteria that it’s edge users will suffer i i u i terfere ce fro borrowing BS before lending the band. The definition of lender cell is which gives the right to use its edge band and borrower cell is the one which itself is overloaded. The three stages for the whole process consist of
1. Sending requests to neighboring base stations.
2. Lending process by solving 0/1 knapsack problem by each neighboring cell. 3. Soft borrowing process and other power considerations (Bargaining procedure)
3.7 Generation of Borrowing Request by Overloaded Cell
Whe the a erage ce ter user’s throughput decreases to a i i u threshold alue the o erloaded cell will issue a borrowing request to its neighbors to lend their edge band in order to accommodate the decreasing throughput of its bandwidth hungry center users. The request consists of 16 different power levels along with respective 16 gain values.
3.8 Solving 0-1 Knapsack Problem by Neighboring Cells
Whe a le di g re uest is ge erated y the o erloaded cell to ac uire its eigh or’s edge a d, each neighbor will run and solve a 0-1 knapsack problem. The modeling of knapsack problem is given by.
17
Maximize:
(3.1)
Subject to:
n
(3.2)
Where g(i) is the gain in average center users throughput value for the overloaded cell (i).
Where x(i) is as a Boolean 0/1 lending decision variable
denoted by either 0(unsatisfied) or 1(satisfied).
c(i) is the cost in terms of loss in throughput values for added interference caused by lending an edge band on neighboring cell (i). U(n) is the overall average edge user throughput loss for neighboring cell (i) due to lending an edge band.
3.9 Lending Process
With the decision of knapsack problem the cell examines the total number of satisfied requested it has received from the neighboring cells in order to acquire their edge band. The neighbors before lending their edge band will check the cost in total throughput losses their edge users will suffer before the desired band is landed to the borrower. If the total cost in edge user’s throughput losses C(i) is greater than the maximum average edge user throughout (U) threshold limit due to high interference from the borrower side the cell will eventually send a negative lending reply stopping the lending process.
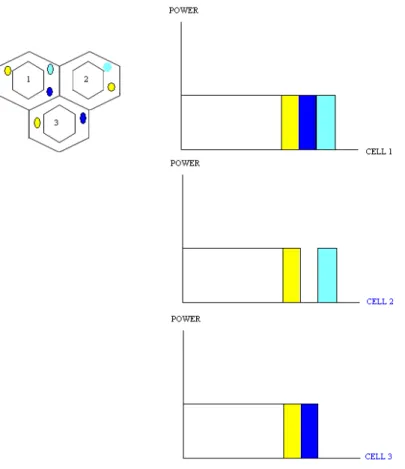
3.10 Power Considerations - The bargaining concept
A general power and sub-band allocation for FFR scheme is shown in figure (3.2). According to the figure 40% bandwidth is reserved for center users while remaining 60 % is divided into three portions each used by corresponding cell. The power for the remaining two extra edge bands is evenly divided among center and edge band respectively.
For the bargaining process, the borrower will reduce its power level in order to activate the borrowed edge band to be used in its center. A further power reduction will be required if the interference associated with neighboring cell is higher enough which may leads to negative lending decision as shown in figure 3.1. Pmin1 and Pmin2 describes the minimum power on which bands are borrowed.
18
Figure 3.2 – FFR Sub-band allocation and power bargaining concept
3.11 Calculation of Gain and Loss Estimation
Upon the generation of a request the borrower cell will calculate the expected gain in throughput value it will achieve after borrowing an edge band on certain power level. The estimated gain in percent consists of difference between the new and previous original FFR center throughput divided by old FFR throughput after acquiring an edge band as shown in equation (3.3). The new center throughput is calculated the same way as the old FFR throughput by using the Sha o ’s formula.
(3.3)
The estimated edge loss in percentage associated with lender cell by lending an edge band is
expressed by equation (3.4)
19
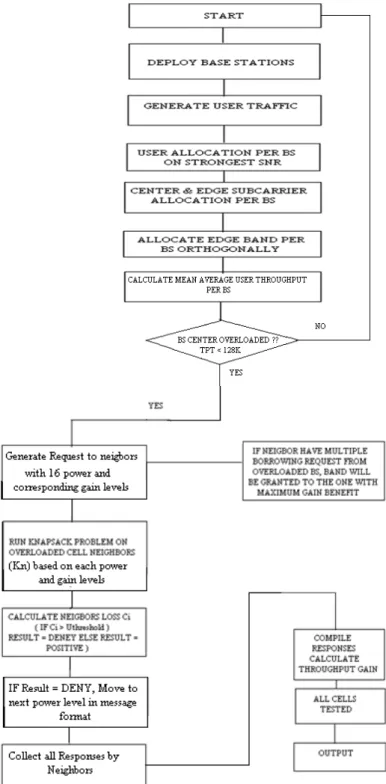
3.12 Algorithm Flowchart
20
The algorithm starts with an implementation of FFR-3 scheme as a baseline by deploying base stations and generating random number is users per BS. The edge and center users are differentiated by SNR values and 5 percent of users which shows worse SNR condition are consider as edge users. The allocation for center and edge bands to respectively cells users are done in the next step.
The criteria for a cell to be overloaded is define as whose cells having average center users throughput below 128-256 Kbps or cells with maximum number of users in it. The overloaded cell (lender) will generate requests to its neighbors (borrowers) to use an extra band for its center users. The request consists of 16 power levels with corresponding estimated gains levels. A knapsack problem is run on each and every neighbor cell. The neighbors will compute loss in throughput for its edge due to added interference from borrower cell center users before granting the right to use its edge band. If the average edge user loss (Ci) of lender cell is greater than the overall edge loss limit (Un) it will send a negative reply to the borrower cell otherwise a band is granted.
With a negative reply the lender will move to the next power level (decreased) from the request message and solve the knapsack problem again. The process will repeat N=16 times till a band is granted to the borrower cell. The final stage consists of gathering all the responses and computing throughput gain for center users.
3.13 Simulation Time, Efficiency & Overhead
Table (3.3) shows the computational time and efficiency for different Un limits. Observe that the bargaining process can be implemented as in [1] where a borrower message request is characterized by M=16 different power levels from highest to lowest along with 16 gain levels as shown in table 3.2. This message is broadcasted to all neighbors by the borrower cell. After receiving this message the lenders will calculate their edge loss due to added interference associated with all borrower cell center users and utilizing their edge band in overloaded cell center. From the set of 16 levels in the message, a power level is decided by the lender who gives the right to use their edge band.
Table 3.2 – Request format between lender, borrower
The computational time starts when a cell become overloaded and it first calculates the gain matrix on different power levels and sends the corresponding message (M = 16 values) to its concerning neighbor, on receiving this message the cell lender will calculates different loss values on the basis of different power levels. This procedure will repeat for all Kn neighbors. When calculating computational time for
Power values (M=16) P0 (Default) P1 P2 P3 P4 P5 …… PM-1
21
all values of loss limit (U) which includes all the time and overhead from the initialization phase until a response is sent to the borrower.
Table 3.3 – Time and Efficiency for different loss limits Un
Loss limit %
(Un)
Computational time for
lightly overloaded
system (Sec)
Efficiency
%
Computational time for
heavily overloaded
system (Sec)
Efficiency
%
10
98.617978
0.5
745.891522
0.38889
20
0.004174
1
0.083511
0.72222
30
0.003602
1
0.075959
0.83333
40
0.003212
1
0.046077
0.94444
50
0.003211
1
0.022981
1
Efficiency is the maximum available band (maximum two) and bargaining responses from lenders using that band depending on U values. In short the efficiency is calculated as the sum of all the gathered responses divided by total number of overloaded cells into maximum number of bands available. Note that with an increase in loss limit U the overall efficiency of the system tends to increase as well as shown in table (3.3)
The overhead between lender, borrower is calculated as 34 bytes of message in total with 16 power levels along with 16 respective gain values and (1+1) bytes of lender response and header which shows the identity for the cell as shown in table (3.4)
Table 3.4 – Borrower, lender overhead message format
Header Data field Response
Borrower, Lender information Index
16 Power levels 16 Gain levels 0 or 1
1 Byte 32 Bytes 1 Byte
22
3.14 Salient features of the Implemented Scheme
The salient features of the implemented scheme are as follows.
It is asynchronous that is no center controller is required to monitor the process.
Any base station can generator request to its neighbors to borrow an edge based on its load conditions.
The neighbors are response for solving knapsack problem when a broadcast request message is received by the borrower cell.
The computational time of dynamic programming 0-1 knapsack is very fast from an optimization perspective.
A minimum total overhead per BS is required from the start to the end of the process i.e. from generating requests to final allocation of edge bands.
23
4- Simulation Results
To analyze the performance of the implemented scheme a detailed simulation scenario from lightly to heavily overloaded system consisting of random user traffic in a regular and multiple irregular symmetry of base stations are created and performed in Matlab from scratch starting from implementing a baseline FFR3 scheme first. Furthermore band borrowing on various power levels with gains and losses are analyzed in much detail. Various combination of sub-carrier allocation for center and edge band is being analyzed to check the details response of overall system, while also calculating total overhead caused by lending/borrowing requests by the corresponding base stations in the system.
4.1 Evaluation of Implemented Scheme on Different Cell Loads
Simulations results for a semi and fully overloaded system in regular topology of base stations which comprises of 10% - 100% of overloaded cells in which the overloaded criteria was set as those stations having minimum average center users throughput threshold in the range of 128 - 256 Kbps. Band borrowing with center gain, edge losses and aggregate system gain for a variety of overloaded base stations are shown in figures 4.1, 4.2. It is evident from these figures that the discussed scheme has performed significantly well in terms of throughput increase in the center w.r.t minimum acceptable loss at the edges with bargaining power limit starting from P(Borrowed) to P(subc/2) as can be seen in figure 3.2. Various snapshots were taken in our simulations to optimize best possible results with a variety of power levels to see the impact on gains and losses for center and edge respectively.
The semi overloaded system as seen in figure 4.1 with lightly overloaded system comprising of 7 overloaded base stations in a 49 BS scenario shows that the average center user gain tends to increase significantly up to 78% over FFR3 with an acceptable edge loss of 9% and an overall overloaded aggregate system throughput up by 3%.
To analyze this scheme at full load, a fully overloaded system as shown in figure 4.2 in which all the corresponding BS are overloaded, the simulation results clearly shows a significant increase in all center users throughput that reaches up to 77% w.r.t to FFR3 scheme with an acceptable edge loss of 23 % with overloaded aggregate system gain increase of 37%.
It can be seen from the all of the above figures that the both the center and overall aggregate system throughput gains increases with w.r.t Un factors and its effect tends to diminish as it approaches to 50 % limit as set in our system.
24
Figure 4.1 – Center gain, edge loss, overall aggregate system gain w.r.t FFR3 for different U values, scenario with 2 BS Overloaded in a total of 49 BS (lightly overloaded system)
Figure 4.2 – Center gain, edge loss, overall aggregate system gain w.r.t FFR3 for different U values, Scenario with 49 BS Overloaded in a total of 49 BS (heavily overloaded system)
25
Figure 4.3 – CDF plot edge user’s throughput w.r.t Reuse-1, FFR-3 and implemented scheme for different U values, scenario with heavily overloaded system
Figure 4.4 – CDF plot ce ter user’s throughput w.r.t Reuse-1, FFR-3 and implemented scheme for different U values, scenario with heavily overloaded system
26
Figures 4.3, 4.4 illustrate the CDF plots of edge a d ce ter user’s throughput for FFR3, Reuse-1 and implemented scheme with original FFR3 subcarrier allocation of 40/20/20/20 %. The implemented scheme tends to approach towards reuse1 scheme as the U curve in figure 4.4 approaches on the right side with increasing values of loss limit U and performs much better as compared to original FFR3 for all center users. On the other hand the edge user in figure 4.3 suffers a negligible loss w.r.t to FFR3 scheme ecause of a d orrowi g a d added i terfere ce fro orrower’s ce ter users ut still perfor s much better as compared to reuse1 scheme. The curves in figure 4.3 shows a slight increase in edge user’s losses with increasing values of loss limit U with the overall implemented scheme lies in between FFR3 and reuse1 scheme. Note that as the values of loss limit U increases the greater the possibility that the borrowed band is acquired on higher power levels and the same band can be utilized in increasing number of borrower cells.
4.2 Assessment of Implemented Scheme on Different Subcarrier
Allocations
A different FFR3 subcarrier allocation pattern of 52/16/16/16 and 70/10/10/10 % is applied to check the detailed response of the corresponding scheme as shown below.
4.2.1 52/16/16/16 % Center/Edges Bandwidth Allocation Pattern
The results of allocation pattern 52/16/16/16 in figure 4.5 shows an increase in center user gain up to 50% with a negligible edge user’s loss of % a d a o erall aggregate throughput i crease of 7% w.r.t to FFR3 scheme for a heavily overloaded system scenario.
The CDF plots for edge and ce ter user’s throughput shown in figure 4.6, 4.7. According to the figure 4.7 the ce ter user’s throughput increases with increasing values of loss limit U and tends to approach reuse1 curve. On the other hand for edge user’s throughput in figure 4.6 shows a negligible increase in edge loss w.r.t Original FFR3 scheme as the U limit values reaches to 50% due to edge band utilization in increasing number of overloaded cells at highest power level.
27
Figure 4.5 – Center gain, edge loss, overall aggregate system gain w.r.t FFR3 for different U values, scenario with heavily overloaded system
Figure 4.6 – CDF plot edge user’s throughput w.r.t Reuse-1, FFR-3 and implemented scheme for different U values scenario with heavily overloaded system.
28
Figure 4.7 – CDF plot ce ter user’s throughput w.r.t Reuse-1, FFR-3 and implemented scheme for different U values scenario with heavily overloaded system.
4.2.2 70/10/10/10 % Center/Edges Bandwidth Allocation Pattern
The results in figure 4.8 shows a i crease of 3% i ce ter user’s throughput gai for the i ple e ted scheme with an affordable loss of 14% at the edges and an overall aggregate throughput gain of 13% w.r.t to FFR3 scheme, as the values of loss limit parameter increases to 50% the system stabilizes and most of the band allocation is done before this limit.
The cdf plot cur e for edge user’s throughput in figure 4.9 shows a negligible increases in losses as the value of U limit approaches 50 % but still performs far much better than the reuse1 scheme. On the other hand the cdf plot for all center users throughput shown in figure 4.10 indicates an increase in throughput change w.r.t FFR3 scheme as the curve moves to the right side with increasing values of percent loss limit U and tends to touch the original reuse1 scheme.
29
Figure 4.8 – Center gain, edge loss, overall aggregate system gain w.r.t FFR3 for different U values, scenario with heavily overloaded system
Figure 4.9 – CDF plot edge user’s throughput w.r.t Reuse-1, FFR-3 and implemented scheme for different U values scenario with heavily overloaded system.
30
Figure 4.10 – CDF plot ce ter user’s throughput w.r.t Reuse-1, FFR-3 and implemented scheme for different U values scenario with heavily overloaded system.
4.3 Conclusion
A comparison of two different subcarrier allocations scheme mentioned above w.r.t to the original FFR3 subcarrier allocation pattern as shown in figures 4.1-4.10. It is worth noticing that as the center subcarrier allocation increases, the cdf center curve moves closely towards the original reuse1 scheme. The worse situation in the original when the center subcarrier allocation is only 40% in FFR3 shows an average low throughput for all center users after applying bargaining scheme the center gains reaches 65% w.r.t FFR3 scheme. But, when comparing it with other subcarrier allocation results the original scheme of 40/20/20/20% does not outperforms well as compared to 52/16/16/16 & 70/10/10/10 allocation. A highest throughput is achieved by applying the 70/10/10/10 allocation as can been seen in figure 8.3 and the cdf center curve moves closely towards the original reuse1.
The gains & losses for the center and edge users after bargaining scheme tends to decrease by using a higher order subcarrier allocation in center but still enjoys a greater throughput due to 70% subcarrier allocation in center.
31
4.4
Performance of Implemented Scheme on Irregular Random Topology
The simulation results was analyzed for as set of 34 base stations irregularly distributed with random number of users allocated to serving BS by strongest SNR. The results in Figure 4.11 for a lightly overloaded system comprising of 2 overloaded base stations out of 34 BS in total showing a significant increase up to 85% in center user’s throughput with the implemented scheme due to less number of interferers found within the 2D range of the overloaded BS. The edge loss corresponding to band borrowing shows a negligible loss of just 5% with an overall aggregate system throughput of 2%.
The cdf plots in figure 4.12, 4.13 shows a minute loss in edge users throughput when loss limit reaches up to 50% w.r.t to reuse 1 and FFR scheme while the overall system center users cdf curve for increasing values of loss limit U moves around FFR curve due to single BS overloaded case.
Figure 4.11 – Center gain, edge loss, aggregate system gain w.r.t FFR3 for different U values, scenario with lightly overloaded system (Irregular topology)
32
Figure 4.12 – CDF plot edge user’s throughput w.r.t Reuse-1, FFR-3 for different U values, scenario with lightly overloaded system (Irregular topology)
Figure 4.13 – CDF plot ce ter user’s throughput w.r.t Reuse-1, FFR-3 for different U values, scenario with lightly overloaded system (Irregular topology)
33
The simulation results as shown in figure 4.14 indicates an increase in center users throughput up to 65% with an acceptable loss of 22% at the edges and an increase in overall system aggregate throughput up to 34% w.r.t Reuse1 and FFR scheme with a heavily overloaded system scenario.
The cdf plots for different values of loss limit U w.r.t original FFR and reuse1 scheme as shown in figure 4.15 indicates a slight decrease in edge users throughout w.r.t to FFR but still performs much better as compared to reuse1 scheme. On the other hand cdf plots of center users throughput shows a significant increase in throughput and the curve tends to move towards reuse1 scheme with increasing values of loss limit U as can be seen in figure 4.16
Figure 4.14 – Center gain, edge loss, aggregate system gain w.r.t FFR3 for different U values, scenario with heavily overloaded system (Irregular topology)
34
Figure 4.15 – CDF plot edge user’s throughput w.r.t Reuse-1, FFR-3 for different U values, scenario with heavily overloaded system (Irregular topology)
4.5 Implemented Scheme Performance
The performance evaluation of our implemented scheme can be observed in a very densely populated user scenario across the center where per average center users throughput is lower w.r.t distance from BS as compared to scenarios with lightly denser user patterns. So, the implemented scheme shows better results with higher gains and minimum edge losses with different Un limits.
35
5- Conclusion
A new power allocation, band bargaining scheme for OFDMA cellular networks is presented. The discussed scheme has proved its ability to co pe sate ce ter user’s loss i original FFR scheme due to portioning of system bandwidth while still providing acceptable throughput loss of the edge users. The implemented scheme is load adaptive, decentralized and time efficient and can be activated on any base station according its load conditions (Overloaded criteria). The band borrowing request is broadcasted to neighboring base stations (lenders) by the overloaded cell (borrower).
The borrowing feature is characterized by running a time efficient optimization algorithm (0-1 knapsack problem) on each and every lender cell as it does not require any central controller to monitor the process. The bargaining phase consists of selecting an edge band from various power and estimated gain levels offered by the borrower cell. In bargaining process based on solving knapsack problem, the edge loss limit parameter Un has a very significant role w.r.t increasing number of overloaded cell and different Un values.
The scheme produces a minimum overhead of 33 bytes (16x2+1) in total for every pair of lender, borrower cell which includes 16 power levels corresponding to 16 estimated gain values and one byte for lender response message.
Furthermore the implemented scheme have performed significantly well in various simulation scenarios from lightly to heavily overloaded conditions along with variable subcarrier allocation conditions. Si ulatio results show a i crease of 60% i ce ter user’s throughput w.r.t origi al FFR3 sche e i a heavily overloaded scenario with an acceptable loss of 18% at the edges.
5.1 Future Work
The future extensions of the presented scheme includes
A comprehensive analysis of end to end delay caused by this scheme.
Analysis on how the scheme stabilizes when all the borrowing requests comes simultaneously. System modeling of the desired scheme in next generation mobile networks such as 3GPP LTE
and WiMAX (IEEE 802.16x)
36
References
[1] A Fully Decentralized and Load-Adaptive Fractional Frequency Reuse Scheme. Vangelis Angelakis, Lei Chen, Di Yuan, Department of Science and Technology, Linköping University, SE-601 74 Norrköping, Sweden. E-mails: vangelis.angelakis@itn.liu.se, leich@itn.liu.se, diyua@itn.liu.se
[2] Orthogonal Frequency Division Multiple Access Fundamentals and Applications. Tao Jiang, Ling yang song and Yang Zang. Auerbach Publications 2010, ISBN: 978-1-4200-8824-3
[3] Generalized Frequency Reuse Schemes for OFDMA Networks Optimization and Comparison. Lei Chen and Di Yuan, Department of Science and Technology, Linkoping University, SE-601 74 Norrkoping, Sweden. E-mails: leich@itn.liu.se, diyua@itn.liu.se
[4] On Fractional Frequency Reuse in Imperfect Cellular Grids. Patrick Mitran, Catherine Rosenberg. Department of Electrical and Computer Engineering, University of Waterloo
[5] Orthogonal Frequency-Division Multiplexing (OFDM) Copyright © 2002 by the International Union of Radio Science (URSI). J.J. van de Beek, P. Ödling, S.K. Wilson, P.O. Börjesson
[6] Toward Ubiquitous and Unlimited-Capacity Communication Networks: European Research in Framework Programme 7, Peter Stuckmann and Rainer Zimmermann, European Commission
[7] OFDM for Wireless Communications Systems. Ramjee Prasad, ISBN # 1-58053- 796-0
[8] Generalizing FFR by Flexible Sub-band Allocation in OFDMA Networks with Irregular Cell Layout. Lei Chen and Di Yuan, Department of Science and Technology, Linköping University, SE-601 74 Norrköping, Sweden. E-mails: leich@itn.liu.se, diyua@itn.liu.se
[9] Enhanced Fractional Frequency Reuse for Large-Scale OFDMA Networks with Heterogeneous Cell Layout: Optimization and Performance Evaluation. Lei Chen and Di Yuan, Department of Science and Technology, Linkoping University, SE-601 74 Norrköping, Sweden. Emails: leich, diyua@itn.liu.se
[10] Analytical Evaluation of Various Frequency Reuse Schemes in Cellular OFDMA Networks. Philippe Godlewski, godlewski@enst.fr, Masood Maqbool, maqbool@enst.fr, Marceau Coupechoux, coupechoux@enst.fr, Jean-Marc Kélif, jeanmarc.kelif@orangeftgroup.fr.
[11] Intuitive Guide to Principles of Communications, http://www.complextoreal.com/ [12] Telecom Cellular Technology Concepts, http://cellular-technology-concepts.blogspot.se/
37
Appendix A
List of Figures
Figure 2.1 An OFDM sub channel and OFDM signal with 5 subcarriers
………... 3
Figure 2.2 Multiplication of sine and cosine wave of frequencies (m,n)
………..3
Figure 2.3 Multiple subcarriers assignment per user in different time slots
……….5
Figure 2.4 Interference in a cell
………6
Figure 2.5 Setting users with maximum SNR
………..7
Figure 2.6 The concept of reuse factor in a cellular system
………..…..8
Figure 2.7 A basic FFR scheme with frequency reuse 3 at the edges
………..….8
Figure 2.8 Throughput comparison of FFR and reuse-1 scheme
………..…..9
Figure 2.9 The concept of SFR as interference mitigation scheme at the edges
………...10
Figure 2.10 E-FFR as interference mitigation scheme
………..…..10
Figure 2.11 Flexible FFR scheme (F-FFR)
………11
Figure 3.1 Overview of FFR scheme in regular and irregular scenario
……….……15
Figure 3.2 FFR Sub-band allocation and power bargaining concept
………..……18
Figure 3.3 Algorithm flowchart
………....20
Figure 4.1 Center gain, edge loss, overall aggregate system gain w.r.t FFR3 for different U
values, scenario with 2 BS Overloaded in a total of 49 BS (lightly overloaded system)
……….…24
Figure 4.2 Center gain, edge loss, overall aggregate system gain w.r.t FFR3 for different U
values, Scenario with 49 BS Overloaded in a total of 49 BS (heavily overloaded system)
………
Figure 4.3
CDF plot edge user’s throughput w.r.t Reuse-1, FFR-3 and implemented scheme for
different U values, scenario with heavily overloaded system
……….….25
Figure 4.4
CDF plot ce ter user’s throughput w.r.t Reuse-1, FFR-3 and implemented scheme
for different U values, scenario with heavily overloaded system
……….…25
Figure 4.5 Center gain, edge loss, overall aggregate system gain w.r.t FFR3 for different U
values, scenario with heavily overloaded system
………...27
38
![Figure 2.1 – An OFDM sub channel and OFDM signal with 5 subcarriers [7].](https://thumb-eu.123doks.com/thumbv2/5dokorg/4265584.94488/11.892.258.673.588.700/figure-ofdm-sub-channel-ofdm-signal-subcarriers.webp)
![Figure 2.3 – Multiple subcarriers assignment per user in different time slots [12].](https://thumb-eu.123doks.com/thumbv2/5dokorg/4265584.94488/12.892.249.607.831.1117/figure-multiple-subcarriers-assignment-user-different-time-slots.webp)